
This past year has been another tricky one for the tourism sector: although demand for tourism products and services has surged, labour issues have continued to pose a problem for the trajectories of recovery and growth that we have all been hoping for.
Wider economic pressures have also affected both consumer behaviour and wage expectations, with 2023 seeing a number of strikes across the country to improve working conditions, pay, and benefits. In a sector that is so dependent on leisure and discretionary spending, these factors can exert a strong effect on businesses, and that effect is very acutely felt in the food and beverage services industry, where tourism spending accounts for only around 1/5 of revenue: the rest comes from local residents. In tight economic times, people may choose to forego local spending in order to save for a more extensive trip later in the year, and businesses that rely on local revenue will feel that impact all the more acutely.
This article—a companion piece to the regular Labour Market Snapshot published in the last edition of HR Insider—explores some of the trends in food and beverage services in the past few years.
Industry Overview
Table 1 provides a summary for food and beverage services across 2023, showing trends in performance across labour force (LF), employment (Emp) and unemployment (UEmp) on month-over-month (MoM) and year-over-year (YoY) bases, as well as a comparison with 2019 as a pre-pandemic baseline. Small arrows represent changes of less than 1%.
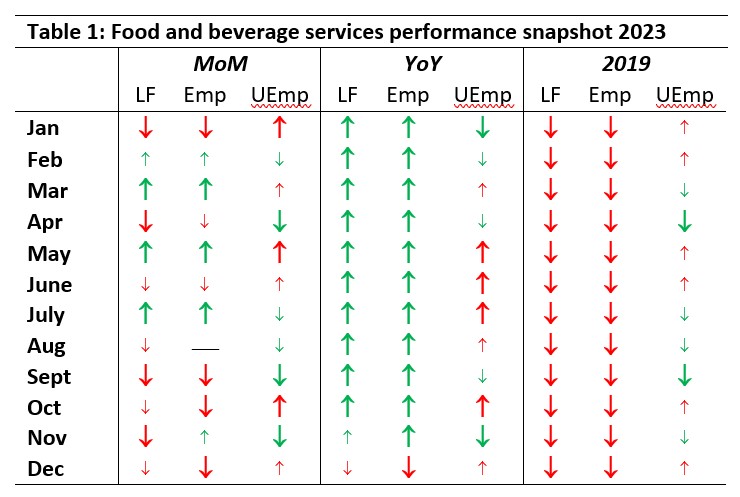
Food and beverage services remained consistently below 2019 levels across the whole year, but it was hardly alone in this: the sector as a whole has not yet recovered to pre-pandemic levels on either labour force or employment. For most of the year, the industry group outperformed 2022, only slowing down into December. This may indicate that December 2023 was particularly weak, or December 2022 was particularly strong; likely it is some combination of the two.
Of more immediate interest are the month-over-month changes across the year. January started out slowly, and there was some volatility into spring and summer. July showed strong growth over June, but from there the industry seemed to stall into August, and began to decline throughout the fall and into winter. This is also when people began to tighten their belts in the face of an economically tight holiday period, and businesses in food and beverage services may have borne the brunt of that impact—but mapping consumer habits directly to employment is not always straightforward, as employment numbers don’t tell the full story.
Employment and Hours Worked
A useful way to look at the employment situation in context is to consider the Labour Force Survey (LFS) estimates for employment (people in jobs) and total actual hours worked (a cumulative estimate of all paid hours of work).
In an industry that is very reliant on shift work and part-time employment, hours worked is more sensitive to short-term changes in consumer behaviour than employment is on its own: when things start to slow down, a business is more likely to scale back shifts or to reduce hours than it is to fire people. This means that the overall number of employees will stay the same, but the total hours worked will decrease. Long-term downtrends may result in staff being lost, but given the costs associated with attraction, hiring, training, and retention, operators are more likely to try to keep staff on the books at reduced employment levels than let them go entirely. Figure 1 provides a monthly comparison of these two metrics, starting in January 2019 and extending until December 2023.
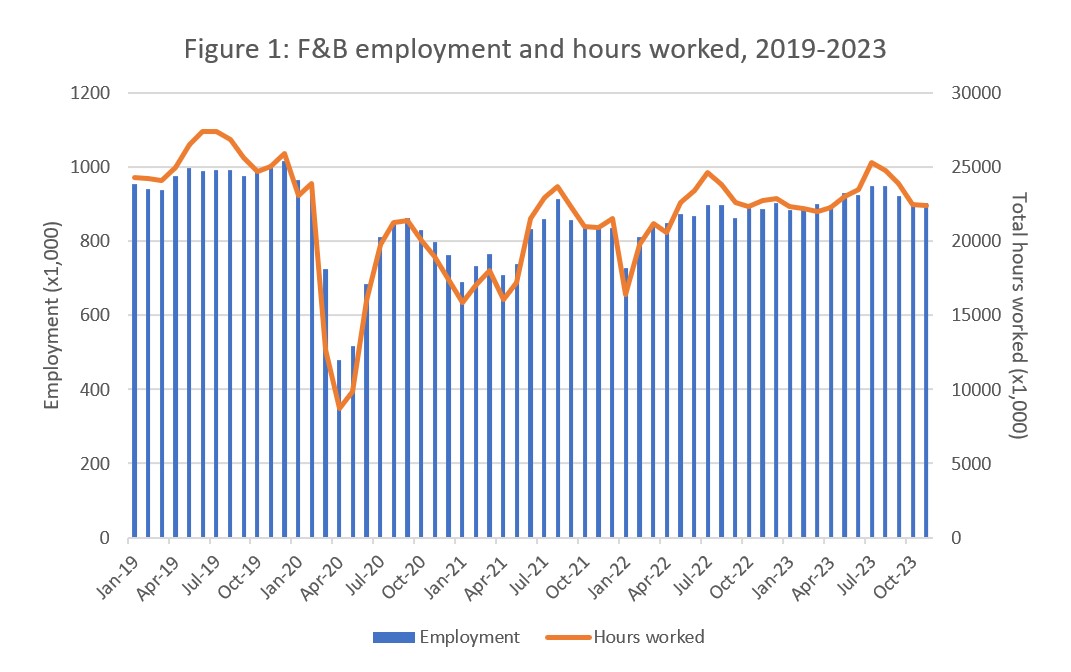
The effect of the pandemic is clearly visible on both employment (blue bars, read against the left axis) and total hours worked (orange line, read against the right axis) as a sharp decline through March and April 2020. Looking at the 2019 data, we see a familiar pattern: employment started to rise in April and May and stayed steady throughout the summer, with hours worked rising even higher—this indicates an increase in average hours worked per employee (i.e., longer or more frequent shifts).
The aftermath of the first lockdown associated with the COVID-19 pandemic can be seen in the fluctuations across both employment and hours worked. Where the blue bars extend above the orange line, this indicates a reduction in average hours worked—people working fewer hours. We can see this lowered average through the first half of 2021, when there was a reduced summer peak followed by another sharp decline in January 2022. Since the summer of 2022, however, things have largely returned to the pre-pandemic pattern of peak seasons with more hours worked, and slower periods in between.
The overall employment numbers remain below 2019 levels, as do the hours worked, but the relationship between employment and hours worked has more or less returned to normal. Employment numbers are continuing to grow, albeit slowly, suggesting that the industry is on a path to return to pre-pandemic employment levels, although it is not clear when we can expect that to happen. Future workforce interventions will hopefully speed things up in this regard, but for now, there is some semblance of a ‘new normal’ across the industry.
Employment by Occupation
Although the businesses that comprise food and beverage services employ a wide range of people doing a number of different jobs (e.g., accountants, marketers), the bulk of employment in this industry can be covered by ten occupations under the current National Occupational Classification system (NOC 2021):
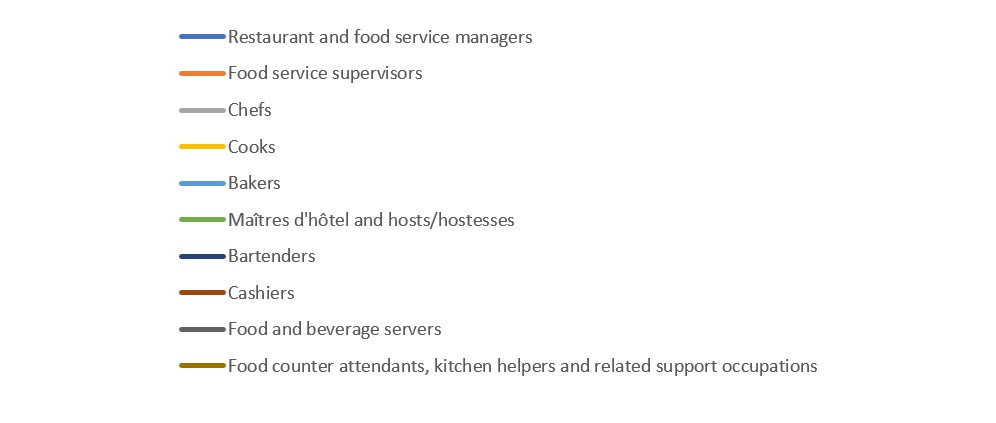
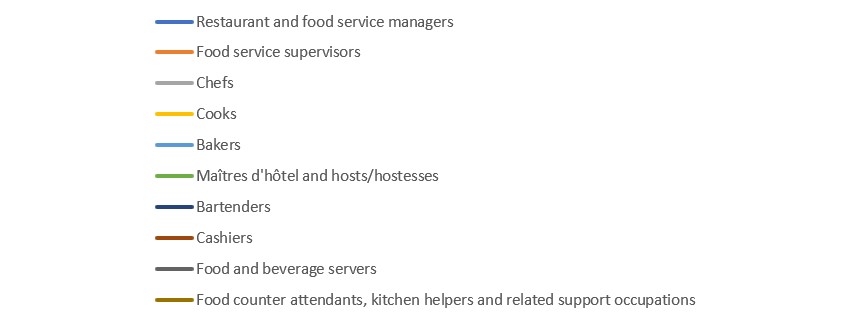
- Restaurant and food service managers [NOC 60030]
- Food service supervisors [NOC 62020]
- Chefs [NOC 62200]
- Cooks [NOC 63200]
- Bakers [NOC 63202]
- Maîtres d’hôtel and hosts/hostesses [NOC 64300]
- Bartenders [NOC 62301]
- Cashiers [NOC 65100]
- Food and beverage servers [NOC 65200]
- Food service attendants, kitchen helpers and related support occupations [NOC 65201]
Figure 2 tracks employment in food and beverage services for these ten occupations, from 2006 through to 2023, using the annual LFS data (an annual average corrected for seasonality, calculated and published by Statistics Canada).
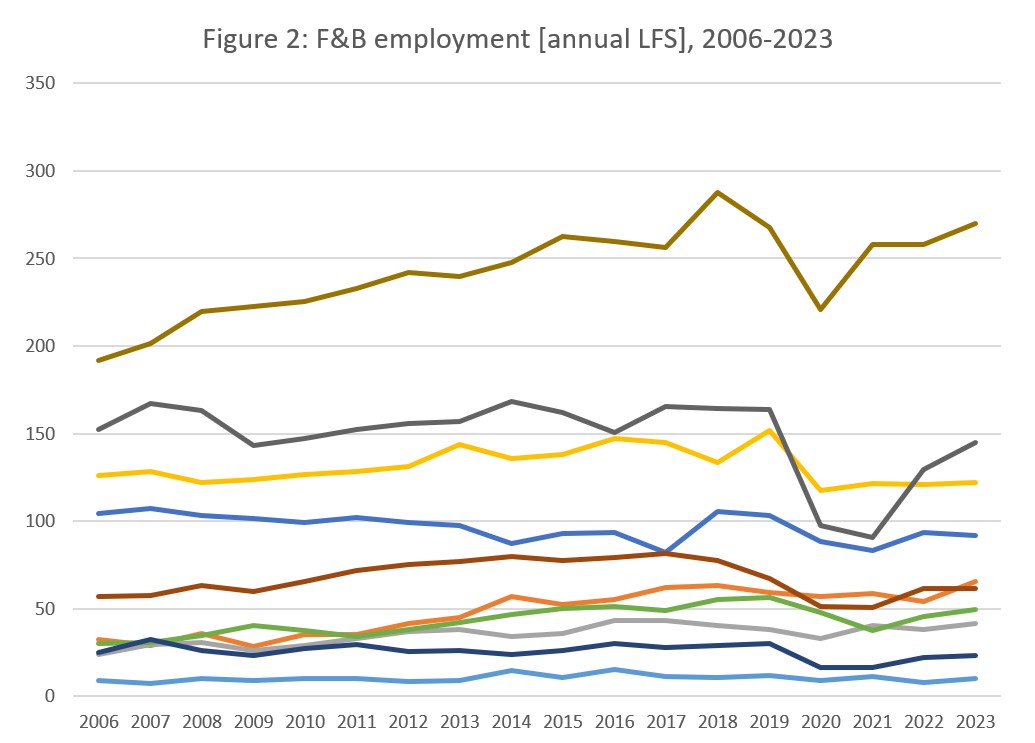
There was a steady growth across several occupations up until around 2019, when the growth curves started to flatten out or decline. Again, the impact of the pandemic is clearly visible in those occupations with the highest overall employment, which also tend to be entry-level-type positions, and so may have been the most immediately impacted by layoffs or other cutbacks in the interest of business continuity. In a crisis, a chef could perform the duties of a kitchen helper, but the converse is not true; so businesses paring back to the absolute minimum would be more likely to retain those in more senior/skilled positions who can perform more duties as needed.
Employment for restaurant and food service managers has been gradually declining since 2007, although there was a bump in 2018 that disappeared as the pandemic restrictions took hold. In contrast, the number of food service supervisors has been increasing over this time frame, suggesting that businesses may be gradually restructuring to rebalance responsibilities between ‘managers’ and ‘supervisors’. There is always some fuzziness in mapping NOC titles to the job titles and descriptions at a business level, where tasks and duties may be distributed and managed more dynamically than the NOC structure would suggest. In a similar vein, the slow recovery of cashiers may indicate that the duties of a cashier are increasingly being shifted: payment at the table by card is increasingly becoming the norm in full-service restaurants, and self-serve ordering and payment is becoming more common in fast-food restaurants.
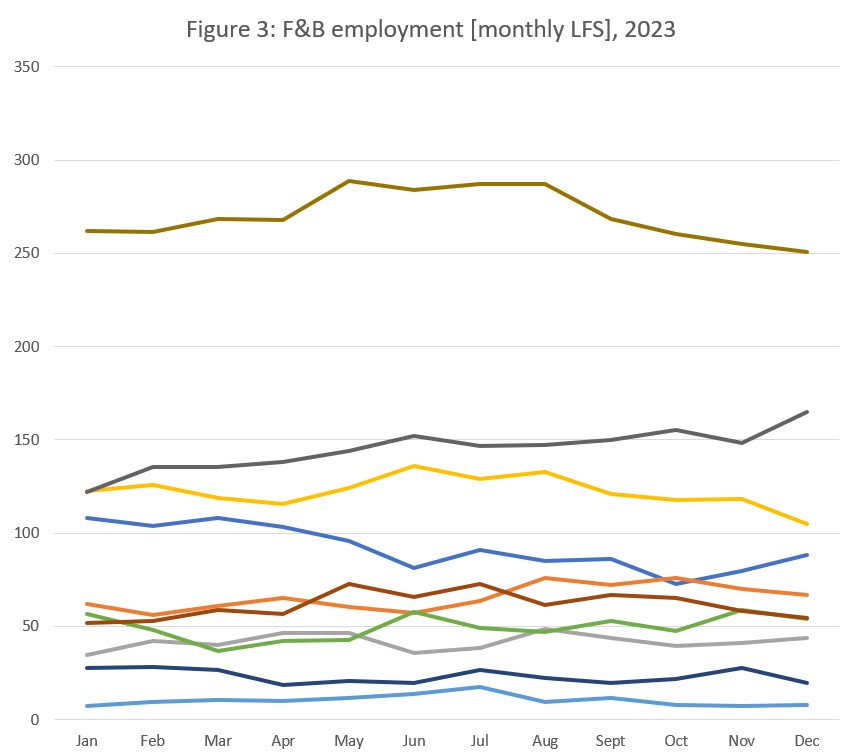
We can also look at employment for these ten occupations month by month throughout 2023 (see Figure 3). The number of chefs has increased throughout the year, as have the numbers of food and beverage servers and food service supervisors, while the number of restaurant and food service managers has decreased. The summer peak was most pronounced for food counter attendants, cooks, and cashiers.
Who Was Working in Food and Beverage Services in December 2023
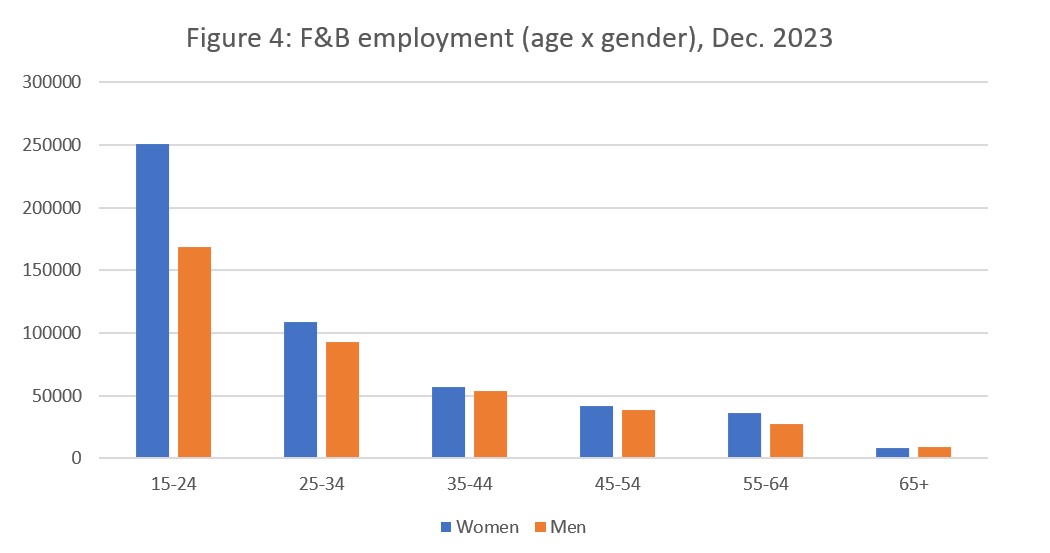
Businesses in food and beverage services employed more women than men in December (56% to 44%, respectively), and this effect was most pronounced among the youngest cohort of workers (see Figure 4). Workers aged 15-24 accounted for 47% of all employment in this industry group.
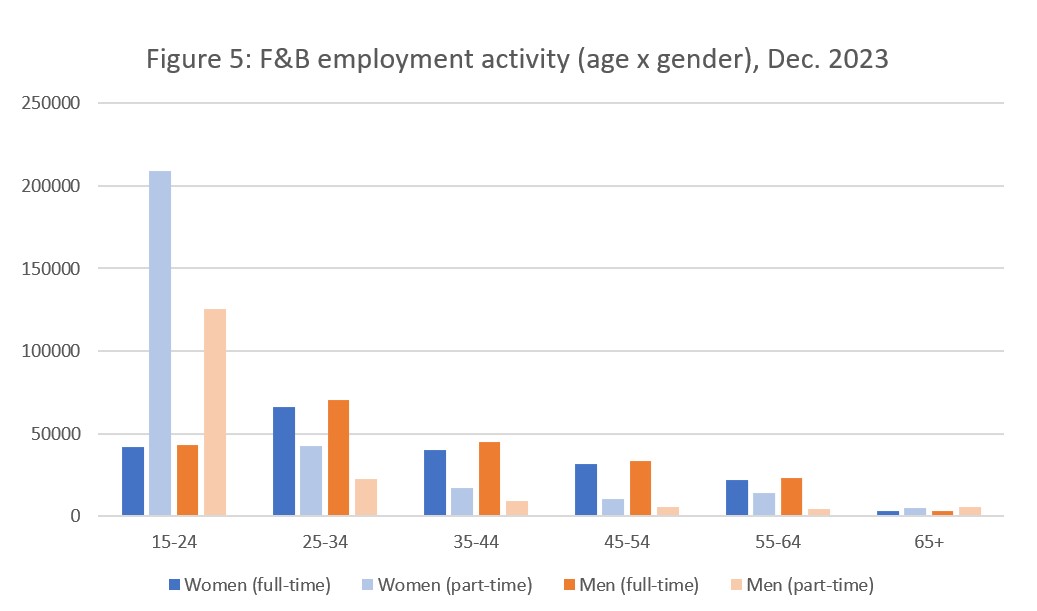
Part-time employment was more common for both men and women in the youngest age group (see Figure 5), and to a lesser extent also in the oldest age group (65+), although the employment numbers for older workers are overall very low, so we should be cautious interpreting these differences. Across all but the 65+ age group, it is interesting to note that women are substantially over-represented in part-time employment, while men have slightly higher rates of full-time employment.
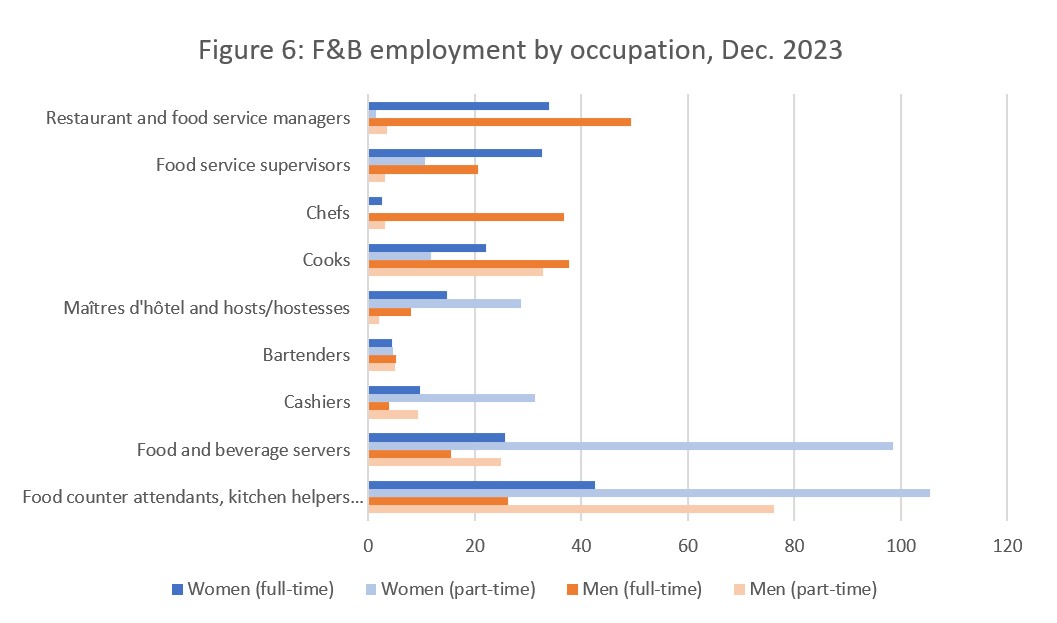
Given that there are some strong gender differences in terms of employment patterns in food and beverage services, it is interesting to explore this distribution across occupations (see Figure 6; note that bakers have been omitted from this chart due to suppression when the data is disaggregated by gender and work activity). Unsurprisingly, the more entry-level-type positions are dominated by part-time employment and the more professional-type positions are dominated by full-time employment, but there are some key gender differences worth drawing attention to. Women are over-represented in entry-level positions (both front- and back-of-house), while men are over-represented in higher-level positions, particularly cooks and chefs. At the highest levels of management, there are more men working as restaurant and food service managers, and more women working as food service supervisors. These patterns suggest a broad gender divide between front- and back-of-house positions, with women tending towards front-of-house career paths (and possibly more institutional contexts), and men tending more towards back-of-house career paths (and possibly more restaurant-based businesses), although this is only speculation at this point. Qualitatively different data is needed to confirm or counter this observation.
Given the importance of immigration and temporary international workers in tourism generally (and in food and beverage services in particular), it is equally productive to consider immigration status across employment. It is important to note that the LFS only reports on two categories: Canadian citizens born in Canada and landed immigrants (i.e., permanent residents). The third category included in our discussion of immigration status is arithmetically derived from the official counts, and includes everyone not included in either of the two official categories. This ‘other’ category therefore includes those with a temporary work permit, international students working while studying, and working holiday visa holders, as well as Canadian citizens born abroad (i.e., naturalized citizens). Unfortunately, it is not possible to disentangle these different statuses within the ‘other’ category, so the data here is necessarily difficult to interpret. However, as previously noted, the LFS non-category of ‘other’ can serve as a proxy for estimating international temporary workers in tourism, at least in the aggregate (in fact, this method seems to slightly underestimate the participation of temporary international workers). Although this approximation is not a perfect fit, it’s the best estimate available from the LFS data, so it is worth considering at least in fairly general terms.
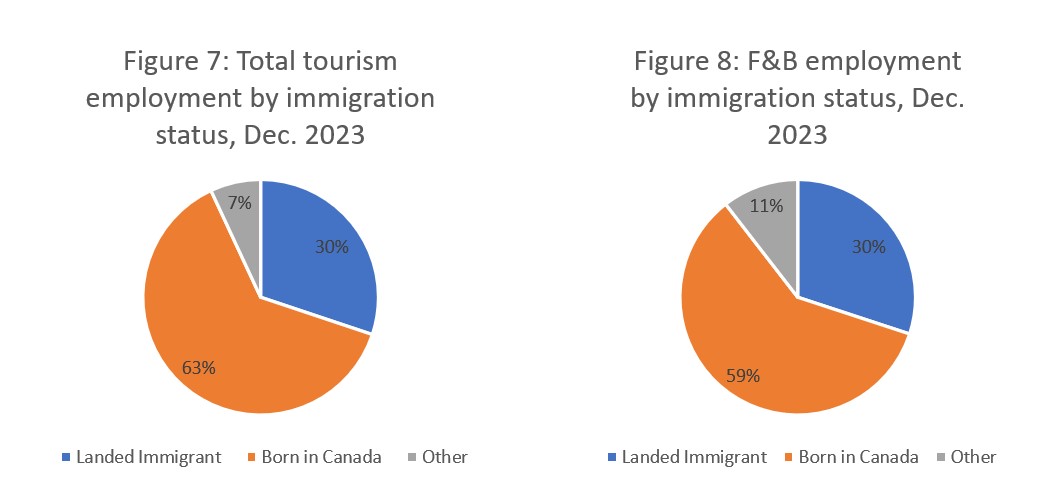
Employment in food and beverage services accounted for around 45% of all employment in tourism in December. Figures 7 and 8 provide a breakdown of employment by immigration status across all of tourism and in food and beverage services on its own. The ratio of landed immigrants in both figures is the same, but food and beverage services employs more people in the ‘other’ category. At this level of detail, the difference does not seem substantial, but because of the size of the food and beverage services workforce, this in fact represents a substantial concentration. Around 42% of tourism employees born in Canada work in food and beverage services, and around 45% of landed immigrant tourism employees work in the industry; in contrast, 68% of ‘other’ tourism employees work in food and beverage services (see Table 2).
At this level of comparison, the difference in ‘other’ employees between tourism and food and beverage services does not seem substantial, but due to the magnitude of the food and beverage services workforce, this in fact represents a substantial concentration. Around 42% of tourism employees born in Canada work in food and beverage services, as do around 45% of landed immigrant tourism employees; in contrast, 68% of ‘other’ tourism employees work in food and beverage services. This industry group is a key employer for temporary international employees, so it is interesting to see in which occupations they were employed in December 2023 (see Figure 9).
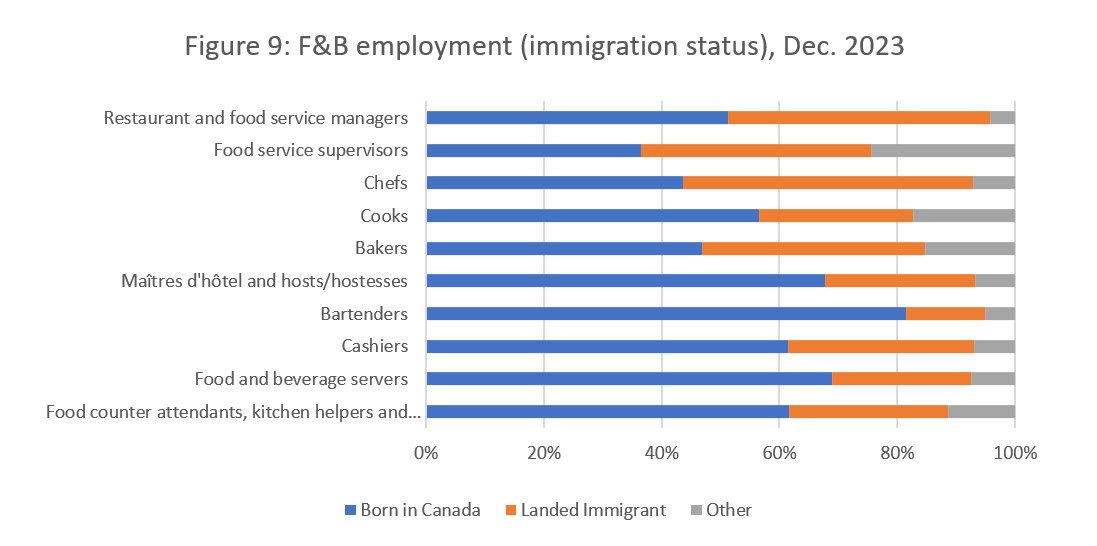
The largest proportion or ‘other’ workers were found at the level of food service supervisors (24%) in December 2023, followed by cooks (17%) and bakers (15%). The lowest levels of ‘other’ workers were in restaurant and food service managers (4%) and bartenders (5%). Landed immigrants are most strongly represented in the occupations of chef (49%) and restaurant and food service manager (44%). Entry-level-type jobs were more likely to be filled by Canadians born in Canada, such as food and beverage servers (69%), food counter attendants, kitchen helpers and related support occupations (62%), and cashiers (61%). These jobs also tended to overlap with high rates of youth employment and part-time employment (see above), suggesting that these are often jobs held by students. The highest share of employment in food and beverage services held by Canadians born in Canada was for bartenders (81%), but this was also among the smallest occupations across the industry (employing more people than bakers, but fewer than any other occupation). The smallest share of employment held by Canadians born in Canada was in food service supervisors (37%).
View more employment charts and analysis on our Tourism Employment Tracker.