Tourism – Who's Visiting Canada?

Who Are Tourists?
Tourists are people who stay overnight (or longer) in a place that is “outside their usual environment”— a technical way of saying that they’re away from home. This includes people travelling for business, leisure, or other personal reasons.[1]

Who Are Same-Day Visitors?
Sometimes called ‘excursionists’, same-day visitors are people who travel outside their usual environment, but don’t stay overnight.
In
2010,
In
2019,
In
2020,
In
2023,
In
2010,
In
2019,
In
2020,
In
2022,
Tourism at a Glance
Canada’s tourism sector is composed of five distinct, but related, sector groups. These groups were defined around 30 years ago, so they may not be fully representative of what tourism looks like today—but updating these industry groupings is a huge project that will take several years. For now, sticking with these groups means that we can more easily track changes in the tourism sector over time.

Accommodation
Food and Beverage Service


Recreation and Entertainment
Transportation


Travel Services
Travel agencies, visitor information centres…
Businesses in these industries—such as restaurants, recreation facilities, and transportation operators—serve tourists, excursionists, and local residents, which can make it difficult to tease apart how much revenue is generated from which type of customer.
Tourism businesses can be found in almost every corner of the country, making tourism an incredibly important part of the Canadian economy. Around 10% of working Canadians have a job in a tourism sector.
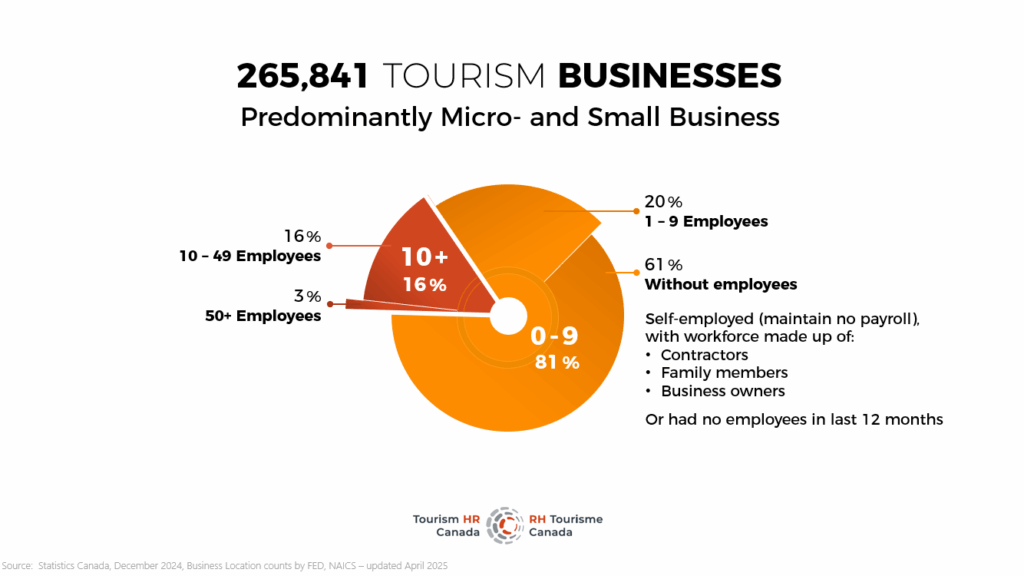
Businesses in tourism industries range from one-person, owner-operated companies through to multi-city, multi-site corporations. The vast majority of tourism businesses are small or micro-operations: in 2023, around 60% of businesses had no employees on payroll (that is to say, they were people who were self-employed, who had family members working for them, or relied on contractors)[4]. Only around 20% of businesses had more than 10 employees.
Working in Canadian Tourism
There are hundreds of different jobs across tourism businesses in Canada, ranging from professional roles (such as accountants, pilots, and chefs) to frontline, customer-facing roles (such as tour guides, flight attendants, and servers in restaurants).
In 2023, there were around 554,000 tourism sector jobs, around 2 million people working in a tourism industry[5], and 675,000 jobs outside of the sector attributed to tourism spending.
Young people in the tourism sector

The tourism sector provides a lot of seasonal and part-time work, particularly for young people.
- In the 2021 census, youth (aged 15 to 24) made up around 27% of the tourism workforce, compared to 12% of the total Canadian workforce. Around 71% of these young workers worked part-time (fewer than 30 hours per week).
- The monthly Labour Force Survey estimates show that youth employment surges over the summer months, particularly in accommodations and in recreation and entertainment—perfect summer jobs for students.
Indigenous tourism

- In the 2021 census, Indigenous Peoples accounted for 5% of the total Canadian population. Indigenous workers made up 4% of the tourism workforce, which is comparable to the 3.9% found across the Canadian economy as a whole.
- The Indigenous tourism workforce tended to be young and interested in entrepreneurship, and Indigenous people were well represented in the tourism workforces of the three northern territories, as well as in Manitoba and Saskatchewan (where they represented more than 10% of the total tourism workforce).
Newcomers to Canada

- In the 2021 census, immigrants (permanent residents) made up around 27% of the tourism workforce, but only 25% of the overall Canadian workforce. In the transportation industry, they accounted for 37% of the workforce.
- Temporary international workers (non-permanent residents) made up 6.5% of the tourism workforce, double that of the total Canadian workforce. In food and beverage services, that share rose to 10%.
- In 2023, 14% of all recently landed immigrants worked in tourism[6] and 35% of the tourism workforce was born outside of Canada.
For the latest tourism labour force and employment estimates from Statistics Canada, check out Tourism HR Canada’s Tourism Employment Tracker. You can also explore the data at the provincial level, and see some additional information about businesses and economic indicators.
The Post-Pandemic Tourism Landscape
Tourism was deeply impacted by the COVID-19 pandemic that disrupted travel and work patterns globally for several years. Both tourism demand and tourism employment fell dramatically in 2020, and the sector has slowly been regaining lost ground.

From 2019 to 2023, revenue in the tourism sector[7] grew by around $23.4 billion, which is an increase of around 14%. As encouraging as this seems, however, it is important to note inflation across the tourism sector grew by around 18.5% over the same period. This apparent growth is actually an illusion, and in real terms, revenue in tourism has not yet returned to pre-pandemic levels.
In terms of tourism demand (tourists coming to Canada), data on international tourists show that as of 2023 we had not quite returned to pre-pandemic levels. Summer is strongly associated with international tourism, so tracking annual summer numbers provides a useful timeline of tourism demand.
- In summer 2019, there were on average 3.2 million international tourists visiting Canada per month.
- In 2020, that dropped to an average of 66,600 per month.
- In 2021, summer demand had grown to 237,800 per month.
- In 2022, that was up to 1.8 million per month.
- In 2023, there were almost 2.5 million international tourists per month.
The relationship between tourism demand and tourism employment can be quite complicated. Increased tourism puts pressure on businesses to deliver their services and products, but without a skilled workforce in place, businesses may struggle to meet those demands. With the loss of so many tourism employees during the peak of the pandemic, many businesses have found it difficult to recruit and retain the right staff.
- In summer 2019, there were on average 2.18 million people working in a tourism industry (nationally).
- In 2020, that fell to 1.63 million people.
- In 2021, summer employment rose again to 1.80 million people.
- In 2022, the sector had reached 1.99 million on average through the summer months.
- In 2023, summer employment had nearly reached pre-pandemic levels, at 2.16 million people on average working in tourism.

As the sector continues to re-invent itself in the aftermath of this unprecedented disruption, operators are taking the opportunity to learn how to do more with less. They’re developing new products and services, figuring out how to work with smaller and nimbler teams, and exploring how to tap into networks of newcomers to Canada to meet their needs.
- Demographic shifts in the Canadian population mean that the workforce is going to change over the next few years. Baby boomers are continuing to retire, and the population is getting older—immigration will continue to be a key factor in maintaining a young and vibrant workforce.
- Technological developments—like innovations around generative and analytical AI—will see a shift in the skills needed in the tourism workforce, but are unlikely to see big levels of job displacement. The social employability and service skills inherent to tourism are hard to replace, so it is more likely that these disruptive technologies will streamline some of the more routine tasks associated with work, allowing tourism employees to focus more on providing high-quality service experiences.
Footnotes
[1] Adapted from Statistics Canada (2007). Canadian Tourism Satellite Account Handbook. ISBN: 0-662-43174-X.
[2] UN Tourism, Global and regional tourism performance dashboard. Statistics Canada. Table 24-10-0054-01 International travellers entering or returning to Canada, by type of transportation and traveller type, seasonally adjusted.
[3] UN Tourism, Global and regional tourism performance dashboard.
[4] Statistics Canada. Business register: Business location counts by federal electoral district, NAICS. Customized tabulations.
[5] Statistics Canada. Labour force survey, annual (2023). Customized tabulations.
[6] Statistics Canada. Labour force survey, annual (2023). Customized tabulations.
[7] Conference Board of Canada, on behalf of Tourism HR Canada (2024). The Future of Canada’s Tourism Sector: Labour demand and supply analysis.