Winter Stasis Across the Tourism Sector
Overall, the tourism sector[1] in December saw little movement from the previous month[2], with aggregate changes across labour force, employment, and unemployment staying under ±0.5%. The sector was in a stronger position than in December 2022, with both employment and labour force up by around 4.5% on the previous year, but both indices remained below 2019 levels.
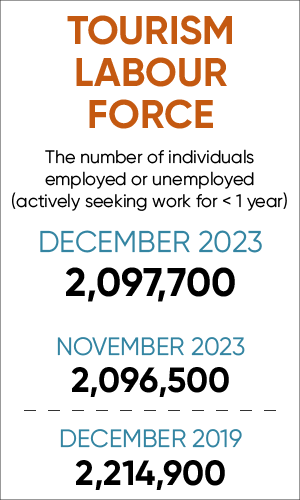
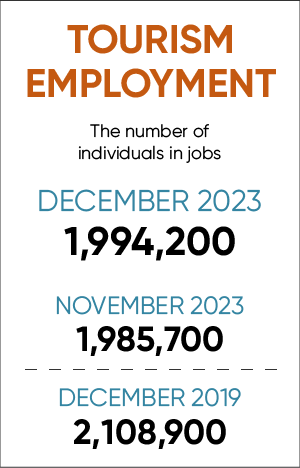
Table 1 provides a snapshot of the industry groups’ performance across labour force, employment, and unemployment, as compared with November 2023 [MoM], December 2022 [YoY], and with December 2019 as a pre-pandemic baseline. Small arrows represent changes of less than 1%.
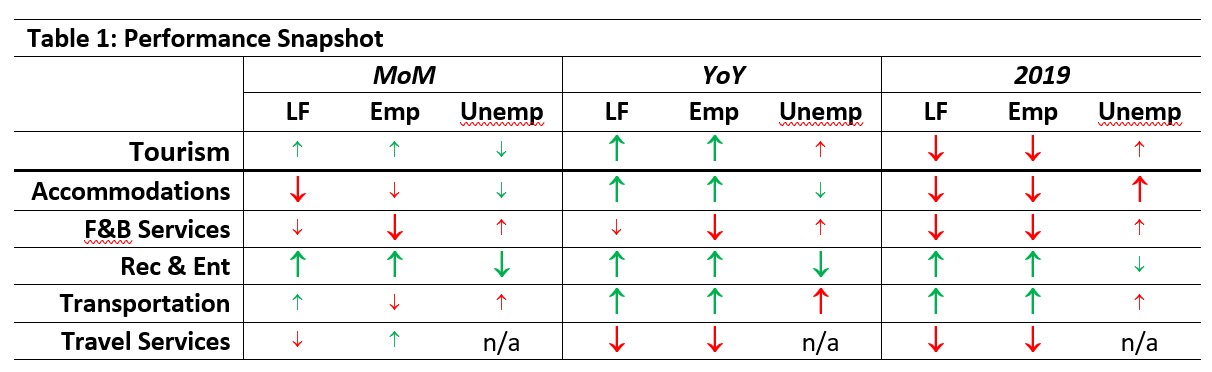
Recreation and entertainment showed the most growth from November across labour force (+1.9%) and employment (+4.1%), and also saw the largest drop in unemployment (-2.0%). There were some modest losses across other industry groups, with accommodations losing around 1.3% of its labour force, and food and beverage services losing around 1.1% of employment. Relative to last year, only food and beverage services and travel services had lost ground; accommodations, recreation and entertainment, and transportation all saw growth in their workforces.
Continuing the trends of previous months, recreation and entertainment and transportation saw growth relative to pre-pandemic levels (December 2019). Recreation and entertainment reached 109% of its 2019 labour force, and transportation rose to 104.6%. In contrast, travel services had only returned to 57.4% of its pre-pandemic labour force.
Tourism Labour Force
The tourism labour force[3] in December 2023 accounted for 9.8% of the total Canadian labour force, holding steady from November. This rate was slightly higher than in December 2022 (9.7%), but below the rate in December 2019 (11.0%). Tables 2a and 2b provide a summary of the tourism labour force as of December.
November 2023: Month-over-Month
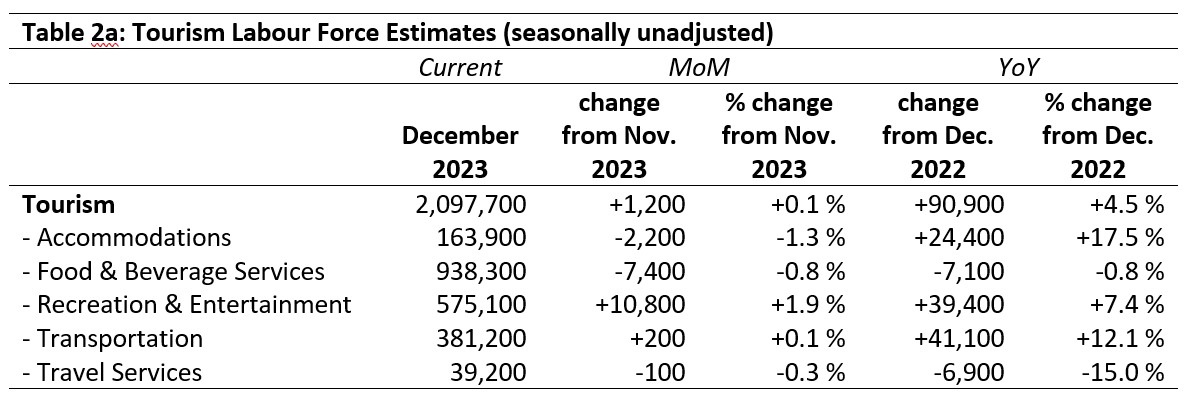
In the aggregate, the tourism sector saw very little movement from November, and indeed things were relatively stable across the industry groups. The largest gains were seen in recreation and entertainment, where an increase of over 10,000 people grew the labour force by just under 2%. The largest absolute losses were in food and beverage services (-7,400 people), while the largest relative losses were in accommodations (-1.3%).
December 2022: Year-on-Year
Compared to the previous year, the sector was in a substantially stronger position in December 2023: the tourism labour force had a net growth of nearly 91,000 people (+4.5%), and most industry groups likewise saw growth. The largest relative gains were in accommodations (+17.5%) and the largest absolute gains were in transportation (+41,100 people). Two industry groups saw decreases: food and beverage services lost just over 7,000 people, but given the size of this group overall, this amounted to less than a 1% loss. On the other hand, travel services had also lost around 7,000 people, but this accounted for a full 15% of its 2022 levels.
December 2019: Pre-pandemic Baseline
The sector remained around 5% below its 2019 labour force, representing a net loss of around 117,000 people. The bulk of this loss was seen in food and beverage services, where 123,500 people had left the labour force. Accommodations and travel services also saw substantial relative losses (-15% and -42.6%, respectively). In contrast, recreation and entertainment and transportation both saw net growth over the past three years, jointly bringing around 64,400 new people into their labour forces.

Tourism Employment
Tourism employment[4] in December accounted for 9.9% of all employment in Canada, and tourism employed 9.3% of the total Canadian labour force. Both measures are comparable to the previous year (9.8% and 9.3%), but substantially below 2019 rates (11.0% and 10.5%). Tourism employment in December 2023 was 94.6% of what it was in 2019. Tables 3a and 3b provide a summary of tourism employment as of December 2023.
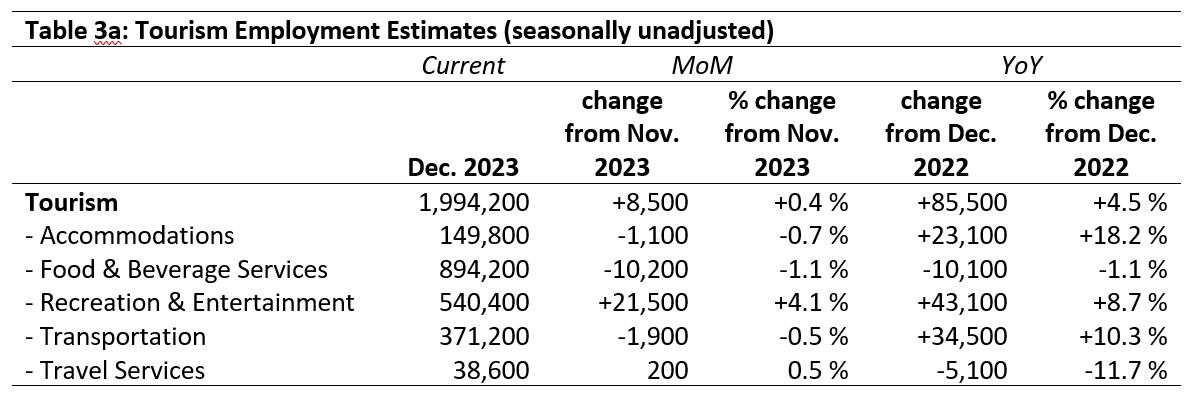
November 2023: Month-over-Month
At the sector level, there was little change from November, but at the industry level, there was some movement. In particular, employment in recreation and entertainment grew by 4.1% (an increase of 21,500 people in jobs), while food and beverage services saw a modest decline of 1.1% (representing a loss of 10,200 people). Accommodations, transportation, and travel services saw movement of less than ±1.0%.
December 2022: Year-on-Year
Employment in tourism overall was up by 4.5% on the previous year, and most industry groups saw substantial growth. Recreation and entertainment (+43,100) and transportation (+34,500) saw the largest absolute gains in employment, while accommodations saw the most substantial relative increase (+18.2%). These gains were offset by losses of over 10,000 workers in food and beverage services (-1.1%), and over 5,000 in travel services (-11.7%).
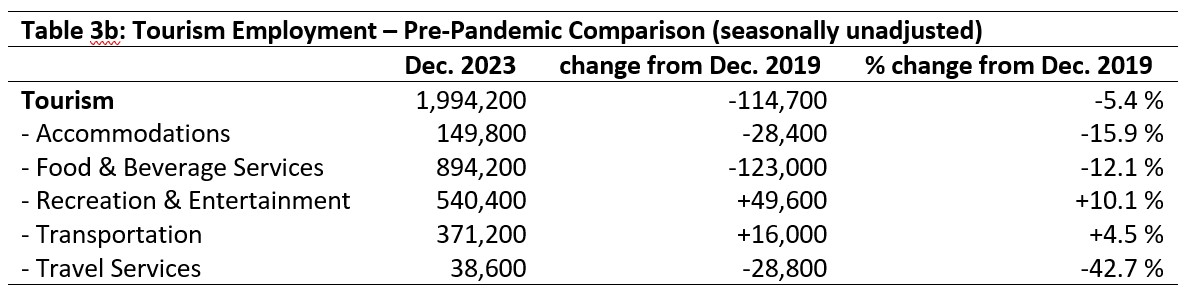
December 2019: Pre-pandemic Baseline
Most industry groups remained below December 2019 levels, resulting in a sector-level loss of around 115,000 people in tourism employment (-5.4%). Recreation and entertainment (+10.1%) and transportation (+4.5%) have both seen net growth over the past three years, while the other industry groups remain substantially below their pre-pandemic employment levels, each one showing a decrease greater than 10%. While demand for tourism products has certainly rebounded, the workforce remains significantly depressed.
Part-time vs. Full-time Employment
The ratio of full-time to part-time work provides some useful insights on the stability of the labour market, with different industries historically relying to differing degrees on part-time workers. During the pandemic, we saw some industries swing towards more part-time workers in an effort to retain as many employees as possible, while other sectors saw layoffs and a switch to more full-time hours as businesses struggled to do more with fewer people. Figure 1 provides an overview of the percentage of part-time employment across the industry groups as of December 2023. Statistics Canada defines full-time employment as 30 hours per week or more; part-time employment is anything under 30 hours per week.
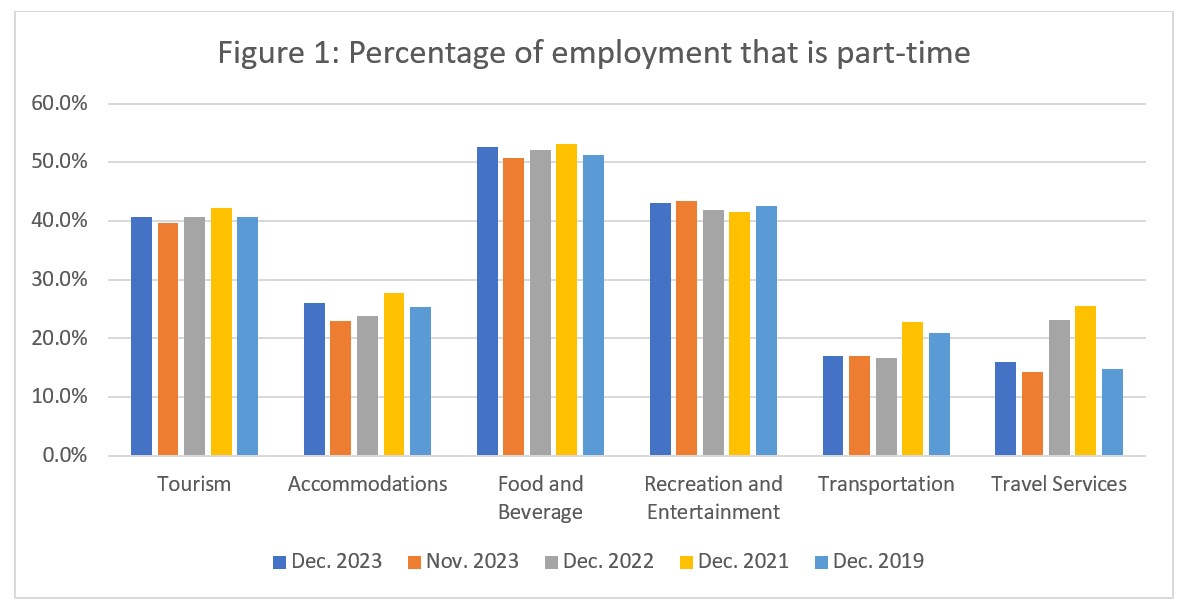
At the sector level, part-time employment had more or less returned to pre-pandemic as of December: there was a slight increase from November and a decrease from 2021. Accommodations, food and beverage services, recreation and entertainment, and travel services were all showing slight increases (less than +2%) in the ratio of part-time employees relative to 2019, while transportation showed a decrease of 4%. Transportation and travel services tend to rely more on full-time employees generally (shown in the historically less-than-20% share of part-time workers), and it looks like transportation may be shifting towards an even lower rate of part-time employment, likely reflecting the tight labour market and shifting demographics; where tour businesses may have been able to rely more on part-time employees for weekend and holiday operations in the past, increased competition from urban transit companies may be making this less sustainable going forward.
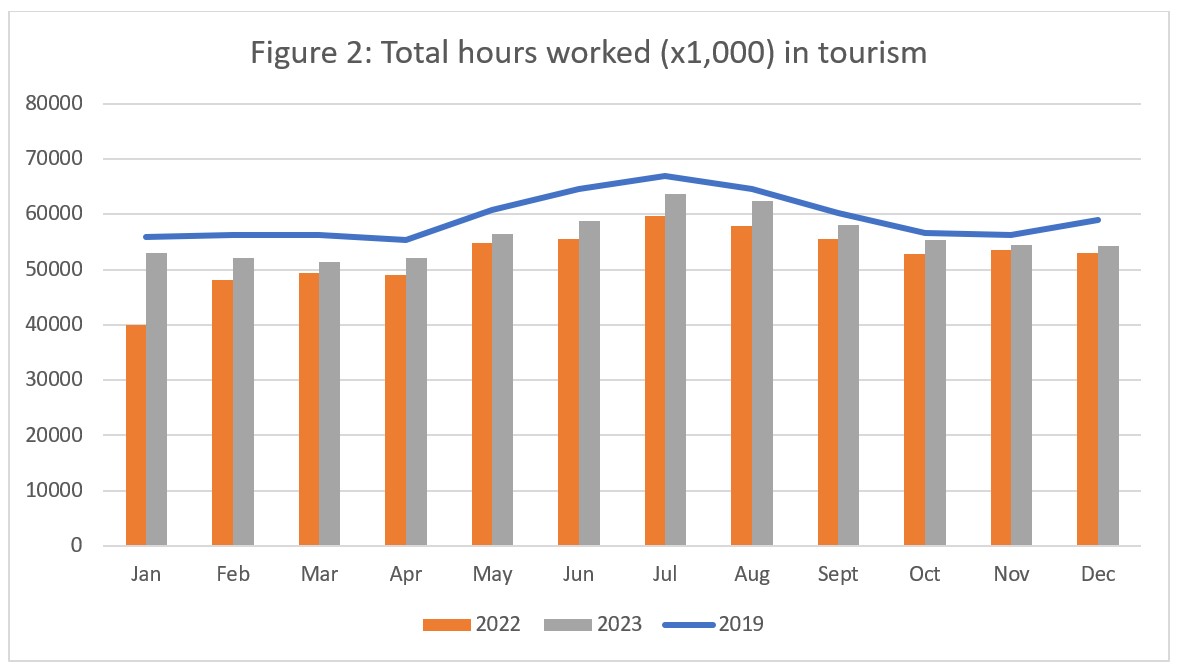
Hours worked
The total actual hours worked within the tourism sector is another useful metric by which to assess the health of the labour market (see Figure 2). Hours worked can be more responsive to short-term changes in tourism demand than employment estimates, as businesses can offer more or fewer shifts to employees (especially part-time staff) in response to customer demand without changing the underlying number of employees they have. That is to say, two part-time staff working 15 hours a week are counted the same way under the ‘employment’ metric as two full-time employees working 40 hours a week, but that difference in hours worked reflects a real change in business conditions.
With December rounding out the year, it is interesting look across the previous 12 months to see general trends. Overall, 2023 hours remained continuously above 2022 levels (showing the re-growth of the sector year-on-year) but below 2019 levels (meaning there is still a shortfall to be made up on the road to post-pandemic recovery). The summer working hours peaked in July as they have historically always done, and the gap between 2023 and 2019 remained tight throughout the rest of the summer and into the autumn. Hours worked in December remained largely unchanged from November, which may reflect a decrease in tourism demand over the holiday season, given the tight economic context of the year.
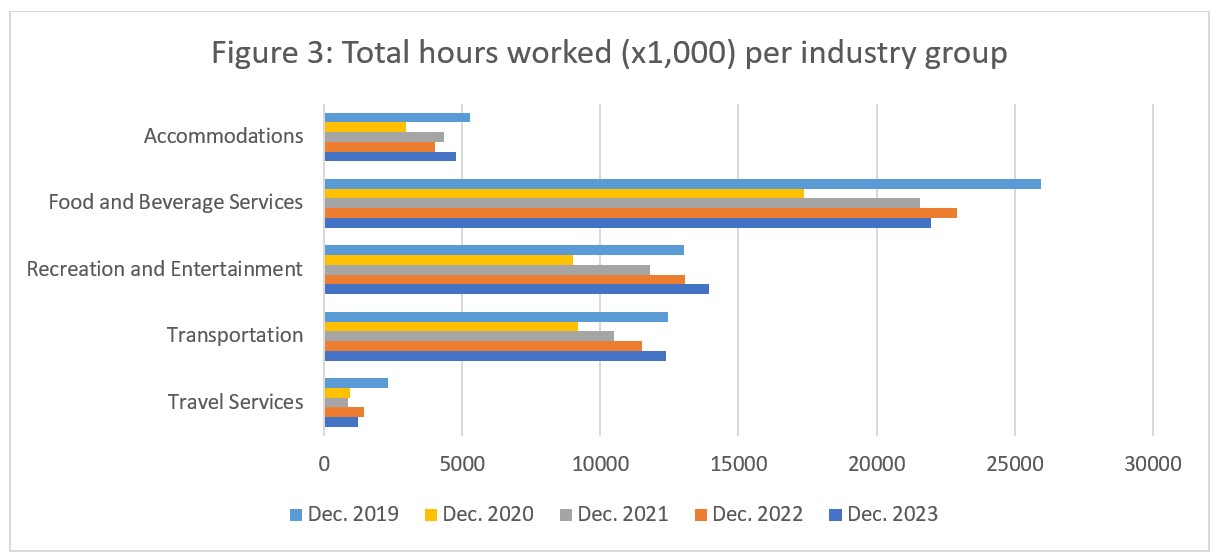
When the total hours worked are disaggregated across industry groups (see Figure 3), we are able to more clearly see where demand has pushed an increase in work-hours. Accommodations showed an increase on December 2022, but remained noticeably below 2019 levels. Transportation was only slightly lower in December 2023 than in 2019, but has shown a consistent year-on-year trajectory of growth. Travel services, unsurprisingly given the low labour force and employment estimates, posted significantly fewer hours worked in 2023 than in 2019; the industry group saw a big drop into 2020, and has only shown slight growth since then. The largest differences between 2019 and 2023 were seen in recreation and entertainment and in food and beverage services: recreation and entertainment saw an increase in hours worked of 6.9%, while food and beverage services saw a decrease of 11.7%. This suggests a shift in how consumers are spending their discretionary earnings: they are eating out less, and spending more on recreation. Whether this is a one-off due to current economic conditions, or a sign of a more substantial shift in consumer behaviour, remains to be seen.
Unemployment
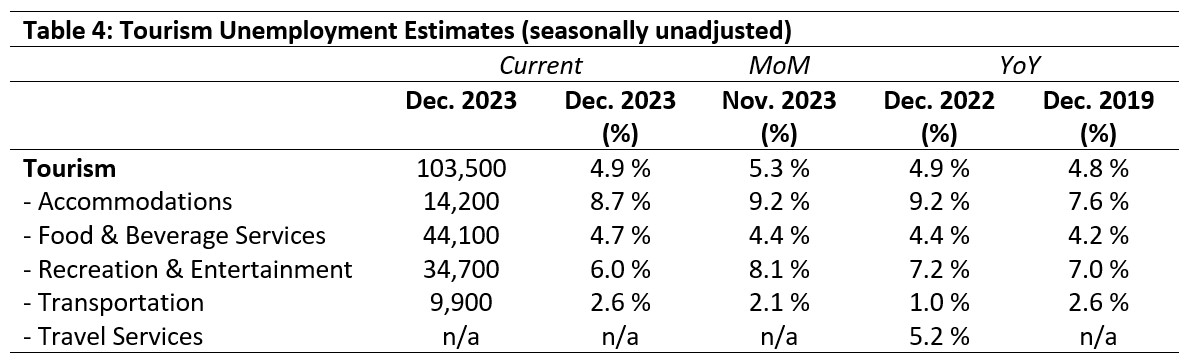
Unemployment[5] in the tourism sector in December 2023 was 4.9%, slightly down from November and on par with previous years. Table 4 provides a summary of tourism unemployment in December.
November 2023: Month-over-Month
On the whole, there was little change from November across the industry groups. Unemployment fell in recreation and entertainment (-2.1%), and likewise fell slightly in accommodations (-0.5%). Unemployment rates in food and beverage services and transportation climbed slightly (+0.3% and +0.5%, respectively).
December 2022 and 2019: Year-on-Year
Current unemployment rates across the sector were not wildly out of step with those of 2022 or 2019. Accommodations posted a slightly lower rate than in 2022 and slightly higher than 2019; food and beverage services saw a marginal increase across the years; recreation and entertainment dropped by around 1%, and transportation was higher than last year but on par with 2019. There is frequently no data available on unemployment in travel services, but it is possible to estimate very low rates by comparing the published data on labour force with that on employment.
Provincial Tourism Unemployment
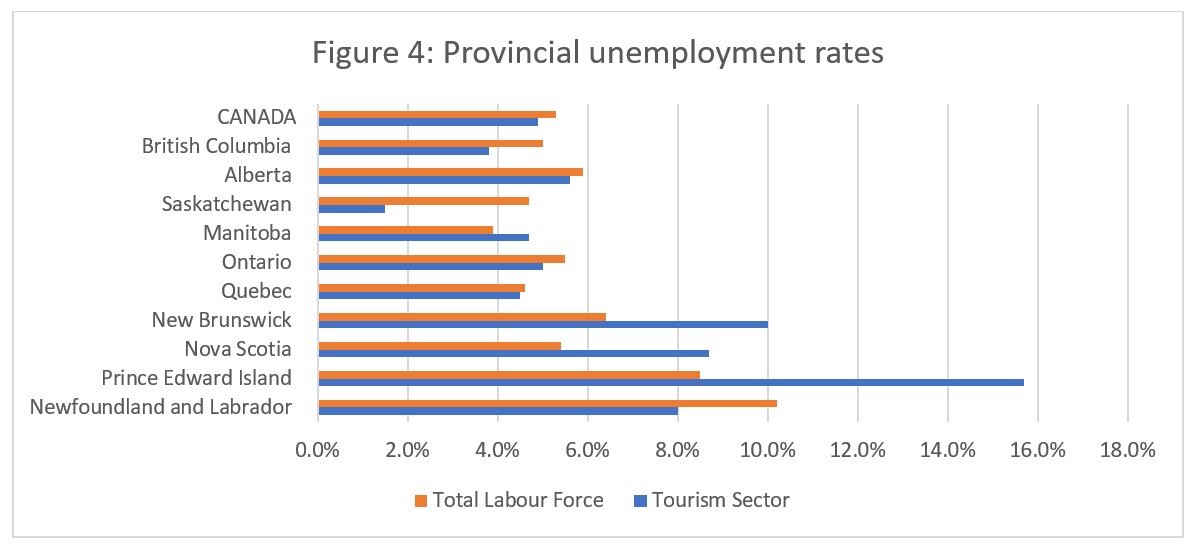
At the aggregate national level, unemployment in tourism in December was slightly lower than across the wider economy (see Figure 4), a pattern which also held true across British Columbia, Alberta, Saskatchewan, Ontario, Newfoundland and Labrador, and, to a lesser extent, Québec. The largest extent to which the tourism unemployment fell below that of the broader economy was in Saskatchewan (-3.7%) and Newfoundland and Labrador (-2.2%).
On the other hand, tourism unemployment outpaced general unemployment in Manitoba, New Brunswick, Nova Scotia, and Prince Edward Island, with the biggest difference seen in Prince Edward Island (+7.2%) and New Brunswick (+3.6%). It is worth remembering, however, that in smaller provincial economies, small absolute differences can become distorted when converted to percentages. Tourism unemployment rates were highest in Prince Edward Island (15.7%) and New Brunswick (10.0%), and lowest in Saskatchewan (1.5%) and British Columbia (3.8%).
View more employment charts and analysis on our Tourism Employment Tracker.
[1] As defined by the Canadian Tourism Satellite Account. The NAICS industries included in the tourism sector those that would cease to exist or would operate at a significantly reduced level of activity as a direct result of an absence of tourism.
[2] SOURCE: Statistics Canada Labour Force Survey, customized tabulations. Based on seasonally unadjusted data collected for the period of December 3 to 9, 2023.
[3] The labour force comprises the total number of individuals who reported being employed or unemployed (but actively looking for work). The total Canadian labour force includes all sectors in the Canadian economy, while the tourism labour force only considers those working in, or looking for work in, the tourism sector.
[4] Employment refers to the total number of people currently in jobs. Tourism employment is restricted to the tourism sector, while employment in Canada comprises all sectors and industries.
[5] Unemployment is calculated as the difference between the seasonally unadjusted labour force and seasonally unadjusted employment estimates. The percentage value is calculated against the labour force.