With the current and ongoing demographic shifts in the Canadian population, many sectors—including tourism—are increasingly turning to immigration to meet their labour needs. Governments are trying to address these changing needs by adjusting immigration policies, including recent changes to some of the programs that bring international talent temporarily into the Canadian labour force (e.g., the Temporary Foreign Worker Program [TFWP] and the International Mobility Program [IMP]). Assessing the impact of these changes on the labour landscape in the country involves carefully tracking the impacts of these changes, but that is a task that is easier said than done.
Some immigration programs issue visas that are directly tied to a specific occupation (TFWP, for one), while others issue open work permits that allow the visa holder to work for any employer in Canada (such as working holiday visas, issued through International Experience Canada, under IMP). Publicly available data that includes occupational information is published by Statistics Canada for some of these programs, but others are impossible to track in this way. Working holiday visas, for example, attract young workers for up to two years; they are generally working to support their travels, and many end up working in tourism—but it is not obvious how to collect data on their employment, as their visas are not associated with a particular job or employer. It may be possible to obtain some reliable estimates through non-traditional data sources (Tourism HR Canada is exploring the possibility of collecting data related to income taxes), but the data sources we traditionally rely on for labour information are not as helpful on the question of immigration as we would like. This means we must get creative and read between the lines to assess the impact of international workers—particularly those on temporary work permits—on our sector.
Data Sources Relating to Labour
Tourism HR Canada purchases customized data from Statistics Canada’s Labour Force Survey (LFS), focused on the industries that comprise the tourism sector. The LFS is a monthly survey conducted on a sample of Canadian households; it collects labour-related information on all members of the selected households who are 15 years of age or older. The results of the survey are scaled up to the provincial and national economies, providing up-to-date and regularly updated estimates of the labour force. Due to some of the limitations of this methodology, and to protect the confidentiality of survey respondents, some data is suppressed, and the granularity—the level of detail—that is available can be quite coarse.
At the other end of the spectrum is the census, which is a national exercise that collects data from the majority of the population. As almost every person in Canada is required to participate, this data is incredibly accurate—but it is only administered every five years. As with the LFS, Tourism HR Canada purchases tourism-focused slices of this data to be able to report on the most accurate and reliable statistics available. The census was most recently conducted in 2021, and the data from that census is being released gradually.
In between the monthly LFS and the five-yearly census, there are monthly, quarterly, and annual data sets released that pertain to labour and to business operations in the tourism sector. The data that we acquire feeds into our Tourism Employment Tracker, where it is presented in a visual and interactive way so that our members and the public can access it as needed.
By far, the most commonly used data source in our labour market reporting is the LFS: it is released monthly so it is up to date, it collects a range of useful information relating to employment and unemployment across several demographic categories, and its estimates tend to be reliable when pooled at the national level. It also provides provincial information, but some of the estimates for the smaller industry groups dip below the confidence threshold for the survey, so they are unavailable. Nevertheless, the LFS is a solid and useful indicator of the real-time labour landscape in Canadian tourism.
LFS and Temporary Workers
One area where the LFS falls a little short of the ideal, however, is around temporary workers. The LFS includes limited information about the immigration status of the Canadian labour force. It reports data according to two categories of immigration status:
- Canadian citizens born in Canada
- Landed immigrants
However, these two categories do not exhaustively include the entire Canadian workforce: there is a third unreported category that includes everyone excluded from the first two. This category is unreported because it lacks any real cohesion: it is composed of a disparate collection of people of variable statuses, including naturalized Canadian citizens, Canadian citizens born outside of Canada, and anyone else who is legally entitled to work in Canada who is neither a citizen nor a landed immigrant. This means that this category must include anyone with a temporary work permit, regardless of the type of permit or visa. This third catch-all category can be uncovered by some simple arithmetic in the LFS data, across any of the indices (labour force, employment, unemployment, etc.) on which the LFS reports: “Other” = Total – (Canadian citizens born in Canada + Landed immigrants).
In the February 2023 LFS report, we explored whether this “other” category could be a useful proxy for estimating the participation of temporary international workers in Canada. We reported that the distribution of these “other” workers across the tourism industry groups was different than those of Canadian citizens born in Canada and landed immigrants, with accommodations and food and beverage services showing the highest rates of employment for this (non-)category.
The tentative conclusion was that this method of interpolating data on temporary workers was far from perfect, but in the absence of better data, it could at least provide some generalized insights on broad trends. But how valid was that conclusion?
May 2021: Census Meets LFS
The 2021 census includes demographic information on immigration status, but it is structured somewhat differently than in the LFS. The census includes the category “Non-Permanent Resident” (Non-PR), which is a much more accurate snapshot of temporary workers than what we arithmetically inferred from the LFS. This gives us the opportunity to directly compare the census data with the LFS data, using the LFS snapshot from May 2021. The two data sets are probably out of sync by about a week, but for our purposes, this is as close a match as we’re going to get.
To assess the reliability of our LFS estimates, we want to compare the Non-PR category from the census (Figure 1) with the “Other” category recovered from the LFS (Figure 2) for May 2021. Both sets of data are organized according to industry groups (accommodations, food and beverage services, recreation and entertainment, transportation, and travel services) and by age category.
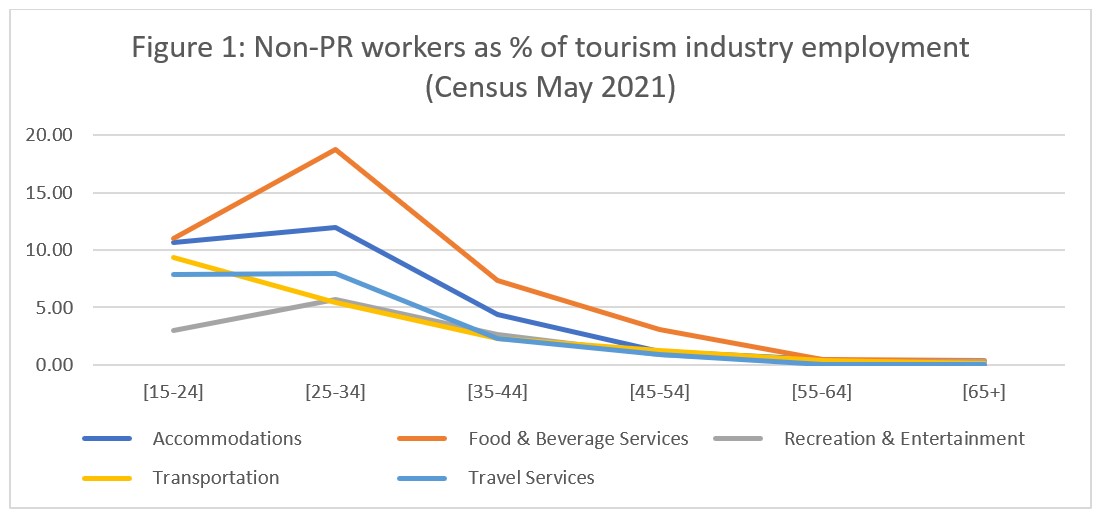
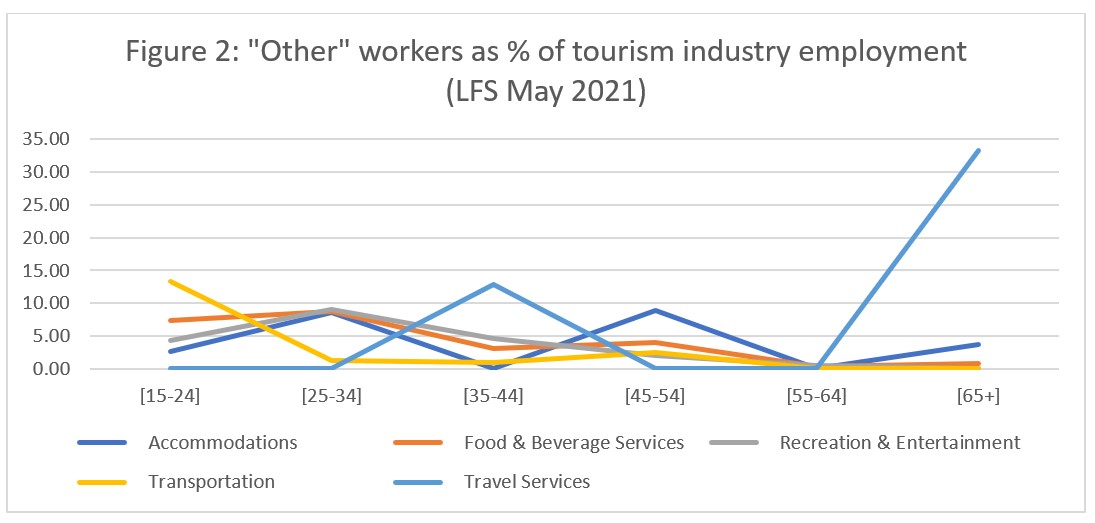
At first glance, the two charts don’t appear that similar: the lines for travel services and accommodations in particular (light and dark blue, respectively) are very different in the two figures. However, it is important to remember that the raw numbers for these two industry groups are relatively small—particularly in the LFS—and turning small numbers into percentages can amplify differences disproportionately. Therefore, Figure 3 excludes accommodations and travel services, and includes only the three larger industry groups.
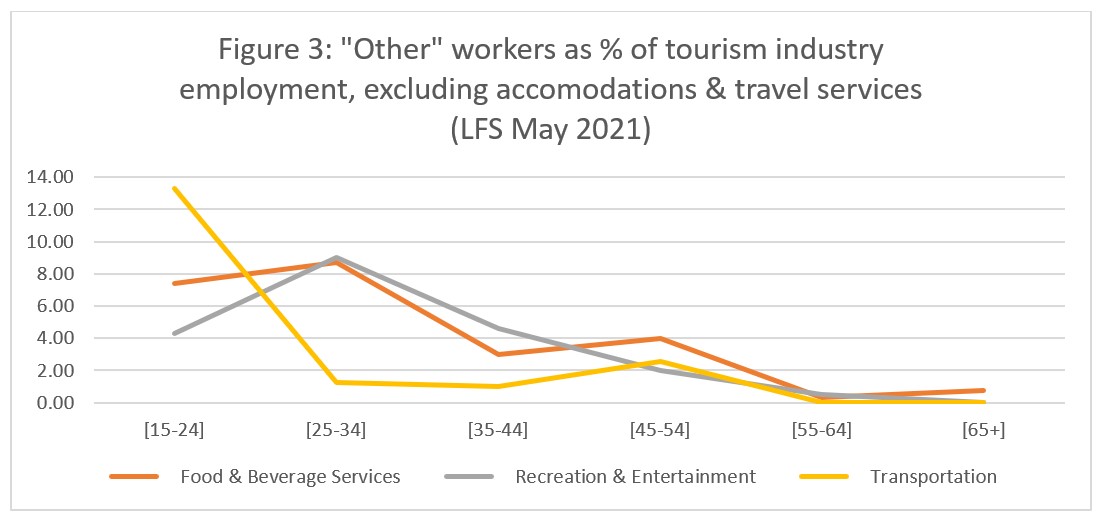
Comparing Figure 1 with Figure 3, the general patterns are more encouraging: for food and beverage services and for recreation and entertainment—the two largest employer groups in the sector—the general patterns are comparable in the LFS and the census data. Both show a peak in the 25-34 age group and a gradual decline across the older cohorts. The broad pattern for transportation is also quite similar across the two data sets. Of course, they are not identical, but given the limitations of trying to interpolate non-permanent resident workers from data that is not coded to capture this information, this general finding is encouraging.
LFS Estimates Can Act as a Useful Stand-In for Missing Data
Interestingly, the LFS data—which includes people who are permanent residents (such as naturalized citizens)—seems to underestimate non-PR involvement in the tourism workforce (Figure 4). On the whole, however, the overall trajectories of the two data sets suggest that, used cautiously, the “Other” category in the LFS data set can be used as a proxy for estimating temporary international workers in tourism, at least at the sector level. At the industry-group level, this data becomes more unreliable, particularly in the smaller industries—but this is always a consideration when working with LFS estimates.
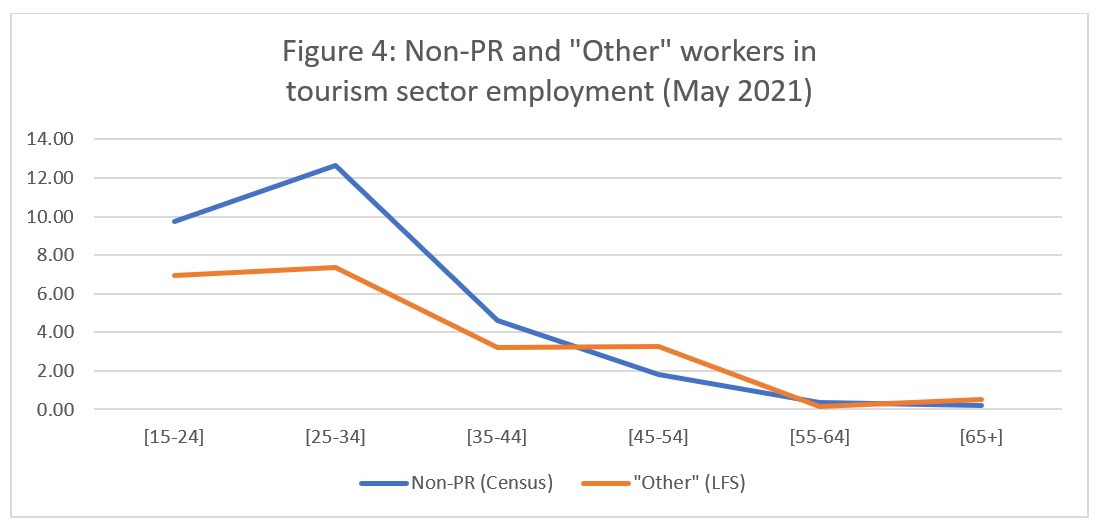
The census data should always be taken as more representative than the LFS (and therefore more accurate), but this matched-monthly comparison is only possible once every five years. In the absence of census-quality data, this comparison exercise does suggest that we can estimate temporary foreign workers from the LFS workers without too much concern that we are grossly misrepresenting the data.