
Tourism HR Canada periodically gauges traveller sentiment towards Canada as a tourism destination. This survey exercise was last carried out in late 2021, when the investigation focused mainly on perceptions of service delivery in the context of disruptions due to the COVID-19 pandemic. Since then, travel restrictions have all but disappeared, and most of us are ready for things to go back to normal. Of course, things are not back to normal, and the further we get from March 2019, the more it seems that things are settling into a new normal that isn’t quite the same as what we left behind.
As we learn to navigate this new normal, it’s a good time to recalibrate our estimates of service delivery expectations in the tourism sector. Our partner in this research, Skift Advisory, has had to delay the international portion of this survey, due to the anticipated skewing of traveller sentiments given recent and ongoing geopolitical instabilities. Skift was able to field the domestic portion, however, and in November and December 2023 surveyed an online panel of 2,500 domestic leisure travellers (Canadians travelling in Canada); they anticipate revisiting international markets in the next few months. Until both sets of data have been analyzed, we are holding off on publishing a detailed report, as the two markets are best understood in relation to each other. However, we are happy to share some observations from the domestic survey, with a particular focus on expectations of service quality.
Why Service Quality?
It’s difficult to directly measure people’s expectations of workforce skills, particularly in a sector as service-oriented and subjectively evaluative as tourism is. Setting aside the factor of personal preference (what one individual thinks is great service might be well below someone else’s expectations), there is an even thornier issue of whether or not people understand skills in the same way. One person might be frustrated by a service encounter that is hampered by technological problems and decide that the staff person was insufficiently skilled to do the job; someone else in the same situation might think that the staff person provided exceptional service in the face of a computer problem outside their control, because they stayed cheerful and friendly and sympathetic to the customer’s needs.
Jobs in tourism involve both technical and social skills, and the specifics of both of those sets of skills will vary enormously from one position to another, making it almost impossible to learn anything useful by surveying people directly about their perceptions, or expectations, of workplace skills in tourism.
Fortunately, there is an alternative: from a labour perspective, service quality can be seen as a proxy for workforce skills. Higher service standards demand either a higher level of skills attainment, or mastery of a different set of skills altogether. As a very coarse example, someone working at a fast-food counter needs a different skill set than someone waiting tables at a high-end restaurant: both are in the profession of delivering food to customers, but the two contexts are different enough that they constitute different occupations under the National Occupational Classification (NOC) system. But that contextual factor cuts both ways. It is not a matter that one is inherently better or worse than the other: five-star service in a fast-food venue would be just as inappropriate as fast-food service in a five-star venue.
Because this survey asked specifically about expectations of service quality, this allowed respondents to understand and interpret the relationship between skills and the performance of their jobs according to their own internal metric. Whether someone ranked social or technical proficiencies more highly was up to them, but expecting higher service quality does imply that, in one way or another, the respondents were expecting a more skilled workforce. We can’t fully disentangle different sets of skills from one another through this lens, but it does offer a solid starting point for making some generalized observations about the value that travellers place on a skilled workforce in tourism.
Overall Service Expectations
In the past two years, 62% of respondents had taken a domestic overnight holiday/vacation trip, and 80% had plans to do so in the next year. Appetite for travel remains strong, but people are slow in acting on the desire to travel. This is likely in part due to reductions in services following the pandemic, in part due to travel hesitancy while respiratory viruses are still so widely in circulation, and in part due to broad economic pressures facing Canadians over the past three years.
Overwhelmingly, Canadians expressed high expectations of service quality when travelling domestically. There was some minor regional variation, a very slight gender effect (women being marginally more likely than men to expect good service), and those expecting lower service quality skewed slightly younger than those expecting higher service quality. In the aggregate, however, 81% of respondents had expectations of good (46%) or very good (35%) service.
What is perhaps more interesting is to look at the consumer profiles of those who expect good or very good service (those who chose 4 or 5 on a 5-point scale from “very poor” to “very good”) and those who have lower expectations (choosing 1 to 3). We can build these profiles through a comparison of cost appetite, influential factors in travel decisions, and preference for self-reliance while travelling. Each of these is briefly discussed below [1] .
Cost Appetite
The first lens through which we can compare our two groups of travellers is cost appetite, which we can understand as interest in, and willingness to pay for, services that are increasingly being treated as premium or high-end by tourism businesses. The services presented in the survey were:
- A daily deep-cleaning of hotel rooms, as opposed to a daily light clean with deep-cleaning occurring less frequently during a multi-day stay.
- Extended hours of operation, including earlier opening and later closing hours, as well as operating every day of the week.
- The availability of ecologically sustainable or otherwise more environmentally friendly tourism products, such as low-emission options or offsets.
- Access to customized or personalized services, such as one-on-one guided tours, childcare services, or airport transfers.
Table 1 provides a summary of response rates across these four services for both groups of travellers.
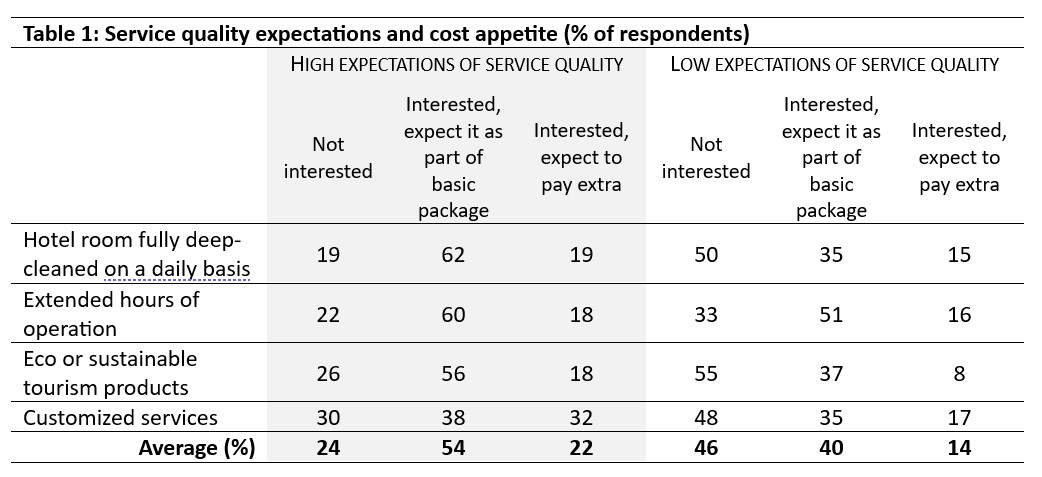
Travellers with high expectations of service quality were generally more willing to pay extra for services (an average of 22% compared to 14% for those with low expectations), but also had higher expectations that those services were included in a basic package. They were also the most willing (at 32%) to pay extra for customized services. Travellers with low expectations of service quality were generally less likely to be interested in any of the premium services (an average of 46% compared to 24% for those with high expectations). Extended hours of operation showed similar distributions between the two groups, with the majority of respondents in both groups expecting it to be included. The most pronounced difference was for eco or sustainable tourism products, with the majority of low-expectation travellers not interested (55%), but nearly one fifth of high-expectation travellers (18%) being willing to pay extra.
Factors Influencing Travel Decisions
Another perspective we can take is to look at different factors that influence travel decisions. Survey respondents were asked to rate five factors on a scale of 1 to 5, where 1 meant “not at all important” and 5 meant “very important”. The factors they were asked to rate were:
- The cost of travelling to their destination. Transportation is often one of the larger expense items when travelling, and may deter some travellers coming from or going to particular regions of Canada.
- The value for money (or cost of living) at their destination. This includes costs for accommodation, food and beverages, and activities, which can also show pronounced regional differences across the country.
- The availability of distinct local experiences. The uniqueness of a destination is often an important consideration in deciding where to travel.
- The ease of access to local transportation. This includes public transit options, taxis, ride-share availability, car rentals—once they have arrived, how easy is it to get around?
- Ease of access to high-quality medical services. Although no one hopes to get sick or become injured when travelling, knowing that care can be accessed if needed can influence travel decisions, particularly for those who are older or have underlying health conditions, and possibly also for those who pursue higher-risk activities.
Table 2 summarises the survey responses, with ratings of 1 to 3 combined into the category “Less important”, and 4 and 5 into “More important”.
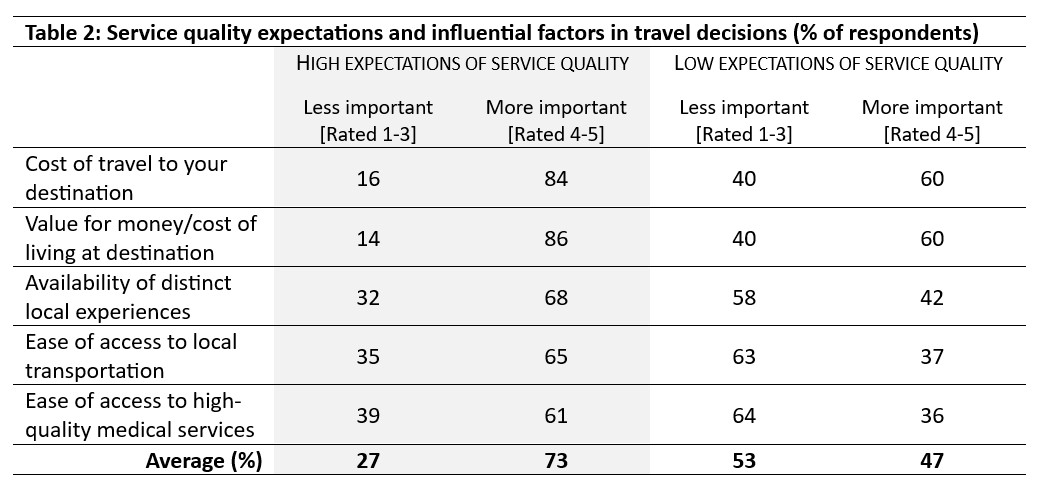
On average, travellers with high expectations of service quality rated these five factors as more important than those with low expectations of service quality. For both groups, the two factors relating directly to money (cost of travel and value for money) had higher response rates of “more important”, although the preference was more pronounced among those with high expectations. For the factors more related to local amenities (distinct experiences, transportation, and medical services), travellers with high expectations of service quality systematically rated those as more important, while those with low expectations rated them as less important.
Preference for Self-Reliance While Travelling
Finally, we can also look at responses between our two groups according to their preference for independence while travelling, versus expecting full service from tourism providers. Respondents rated four types of service on a scale of 1 to 5, where 1 corresponded to “I expect do it completely on my own”, and 5 corresponded to “I expect a member of staff to do all aspects for me”. The four services respondents were asked to rate were:
- Being guided through a cultural experience, such as at a museum or gallery, or in a cultural heritage centre or venue.
- Booking a service, such as making reservations or arranging a taxi.
- Organizing a visit to a local attraction, such as arranging transportation or advanced admission, or contacting tour providers.
- Deciding about menu options at a restaurant and placing an order, which can range from entirely self-service (e.g., through an app or a tablet at the table, or ordering through a kiosk) to full table service (e.g., with a waiter or sommelier to provide advice and take orders).
Table 3 provides the responses, with ratings of 1 to 3 interpreted as a preference to be “self-reliant” and 4 and 5 as a preference to “rely on others”.
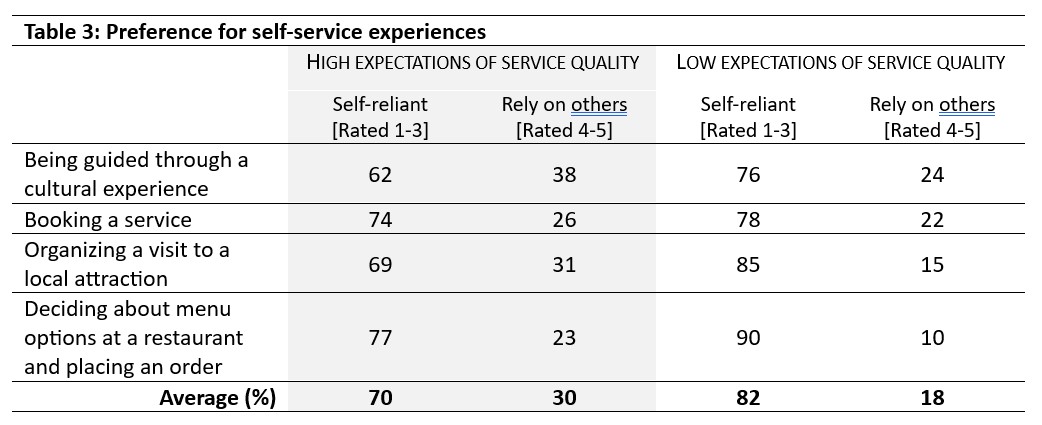
Both groups of travellers expressed a preference for self-reliance overall, although the effect was stronger among those with low expectations of service quality (average of 82% for low expectation travellers, compared to 70% for those with high expectations). The ratings for “booking a service” were comparable between the two groups (±4%), and were the most divergent for “organizing a visit to a local attraction” (±16%). The strongest overall preference for self-reliance in both groups was for “deciding about menu options at a restaurant”.
Service Quality and Skills Expectations
While all travellers are broadly interested in cost efficiencies while travelling domestically, there are some other differences between those who have high expectations when it comes to service quality, and those who have lower expectations. Our interest is in using service quality expectations as a tool for estimating expectations of workforce skills in the tourism sector, so it is worth taking a step back to consider what inferences we can draw from this sub-set of the survey data.
At a granular level, travellers with higher expectations of service quality place more value on the services and amenities that make a destination unique and accessible, implying that local knowledge is a distinct and important skill in tourism. Those with high expectations are also more willing to pay more for higher service quality, while those with low service expectations are more likely to try to avoid service interactions altogether, preferring self-service where possible. This tells us that travellers appreciate a skilled workforce while they are travelling, and where they do not expect to find such skilled workers, they prefer to look after their own needs.
On the whole, Canadians expect that they will receive good service, implying that they tend to see the workforce as adequately skilled; but where they perceive a lack of skills (and anticipate lower service quality), it can directly impact the decisions they make while travelling. Businesses with more highly trained staff, who can offer superior service standards, are able to set higher prices and stay within their customers’ value-to-cost comfort zone.
As the international data becomes available, it will be interesting to see how Canadian perceptions of tourism service quality compare to those of overseas visitors.
Be advised when the international data becomes available: subscribe to Tourism HR Insider.
[1] Note that all values provided in tables 1 to 3 are percentages of responses, not raw scores. In all tables, “High expectations of service quality” refers to people who selected 4 or 5 on the 5-point scale of service quality expectations, and “Low expectations of service quality” are those who selected 1-3.