New Year Off to a Slow Start
Overall, the tourism sector[1] in January saw a substantial slowdown over the previous month[2], with all industries other than transportation seeing contraction in both labour force and employment. The sector was in a slightly better position than it was in January 2023, but remained below 2019 levels.
At the industry group level, the profile overall was largely the same. Table 1 provides a snapshot of the industry groups’ performance across labour force, employment, and unemployment, as compared with December 2023 [MoM] and January 2023 [YoY], and with January 2019 as a pre-pandemic baseline. Small arrows represent changes of less than 1%.
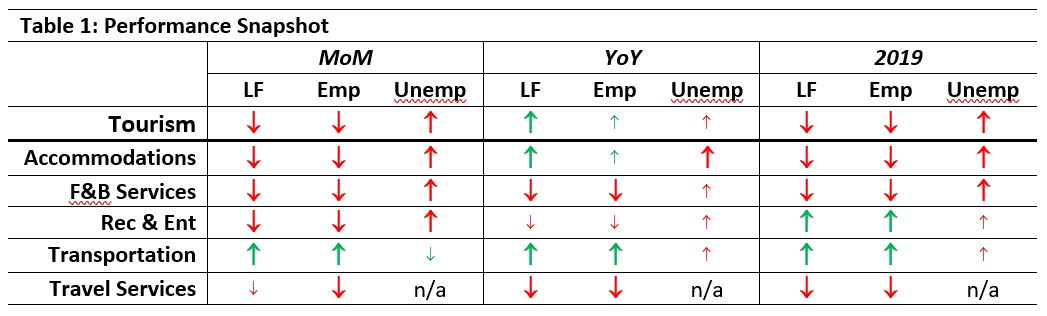
Transportation alone saw growth in both labour force (+2.2%) and employment (+2.5%) relative to last month, as well as the associated drop in unemployment. All other industry groups fell on both key indices, with accommodations being hit the hardest (-4.1% on labour force and -9.2% on employment).
Relative to last year, the tourism sector experienced an increase in labour force of +1.8%, which was carried by growth in accommodations (+8.1%) and transportation (+13.4%), offsetting losses in other industries.
Relative to 2019, recreation and entertainment and transportation continued their recent trend of outperforming their pre-pandemic baselines on both labour force and employment, but these gains were not enough to pull the sector on the whole into growth. Recreation and entertainment was operating at around 111% of its 2019 levels, and transportation around 104%. In contrast, the tourism sector overall was around 97% of where it was in January 2019.
Tourism Labour Force
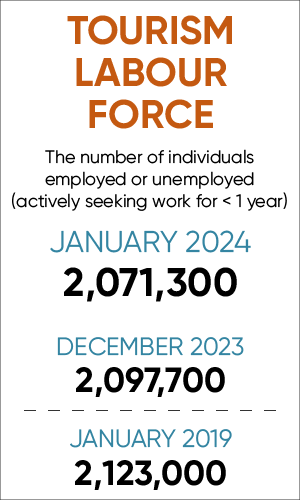
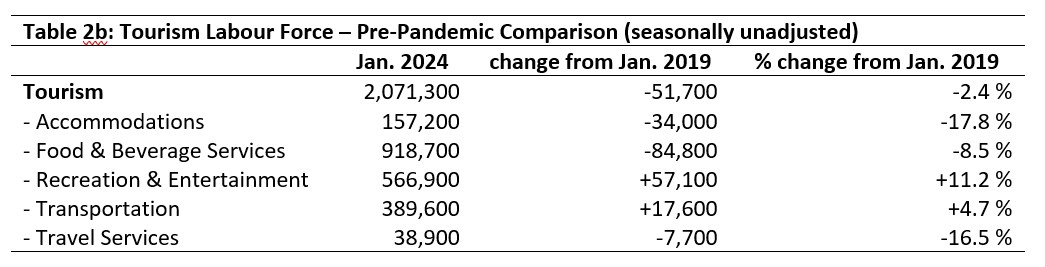
The tourism labour force[3] in January 2024 accounted for 9.7% of the total Canadian labour force, a slight drop from December 2023 (9.8%). It was also 0.1 percentage points lower than January 2023, and a full percentage point below January 2019 (10.7%). Tables 2a and 2b provide a summary of the tourism labour force as of January.
December 2023: Month-over-Month
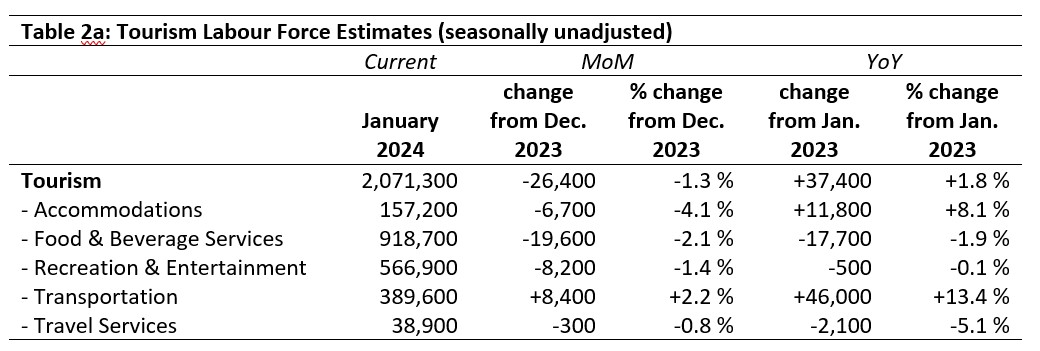
The tourism labour force contracted by about 26,400 people (-1.3%) from December. The only industry group to gain people was transportation, which has been growing slowly for several months; all other industries saw a drop in their respective labour forces. The largest absolute decrease was seen in food and beverage services, where the loss of 19,600 people accounted for a drop of 2.1%. The largest relative loss was in accommodations, which saw a decrease of 4.1%, representing around 6,700 people. Travel services saw only a very modest decline.
January 2023: Year-on-Year
Sector-level growth of 37,400 people (+1.8%) was carried by substantial gains in both accommodations (+11,800 people, +8.1%) and transportation (+46,600 people, +13.4%). Food and beverage services lost slightly less than 2% of its labour force. Travel services lost just over 2,000 people (-5.1%), while recreation and entertainment saw only a very slight decrease (-0.1%).
January 2019: Pre-pandemic Baseline
The sector-level labour force remained around 52,000 people below its 2019 levels, a figure which masks the magnitude of the contraction in food and beverage services (down nearly 85,000 people) and in accommodations (the loss of 34,000 representing almost one-fifth of its 2019 labour force). Travel services has also seen a substantial decline of 7,700 people. These losses have been offset by the continued strong performance of transportation (+4.7%) and recreation and entertainment (+11.2%), which together have brought nearly 75,000 people into the tourism labour force.
Tourism Employment
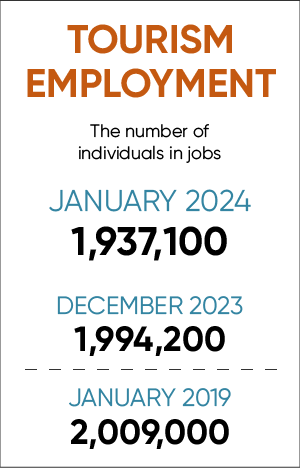
Tourism employment[4] in January 2024 accounted for 9.7% of all employment in Canada and represented a 9.1% share of the total Canadian labour force. Both figures were slightly lower than they were in December (around -0.2 percentage points), or in January 2023 (around -0.1 percentage points), and remained around 1 percentage point below where they were in January 2019.
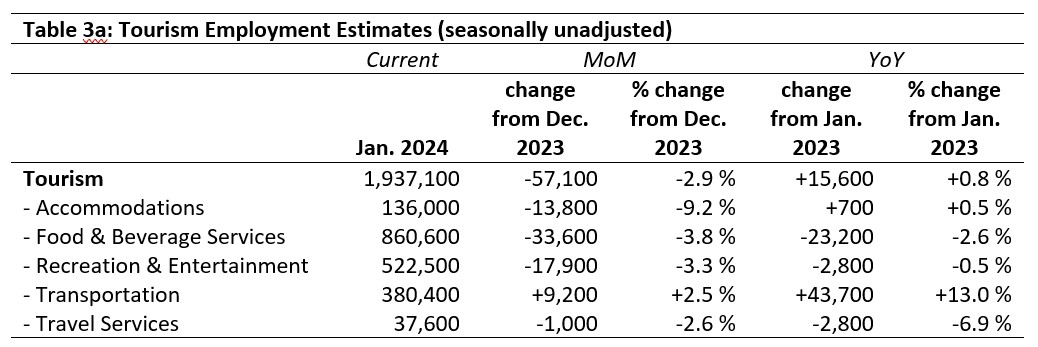
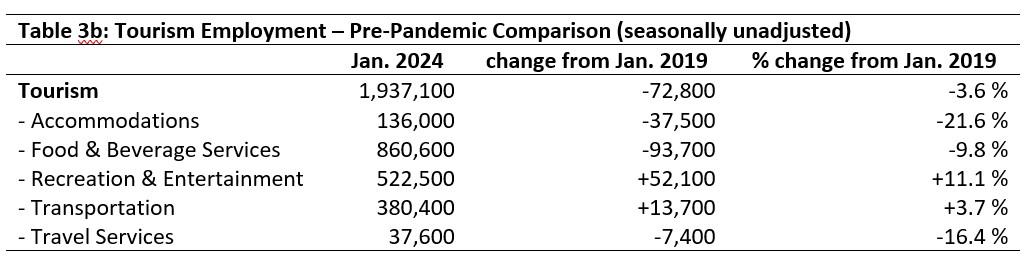
Tourism’s economic footprint has yet to regain the ground it lost during the pandemic, although the gap continues to narrow year-on-year. Tables 3a and 3b provide a summary of tourism employment as of January 2024.
December 2023: Month-over-Month
The sector saw a drop in employment of nearly 3%, with all industry groups except for transportation losing workers from December. This may reflect a seasonal dip, as non-winter businesses contract for their off-season and employment figures drop accordingly. The biggest losses were seen in accommodations (-9.2%) and in food and beverage services (-33,600 people), while transportation grew by over 9,000 people.
January 2023: Year-on-Year
Tourism employment in January 2024 was not substantially changed from one year previous, although this aggregate masks some variability at the industry group level. Transportation saw a substantial increase—both in absolute (+43,700 people) and relative (+13%) terms—while food and beverage services and travel services saw substantial losses. Recreation and entertainment and accommodations saw only slight changes year-on-year.
January 2019: Pre-pandemic Baseline
Employment across the sector remained 3.6% below where it was in 2019, representing an overall loss of nearly 73,000 people working in tourism. There was some variability between different industry groups, with recreation and entertainment showing the strongest growth by a wide margin. Transportation also gained on 2019 employment levels, showing that these two industry groups continue to lead the sector-wide recovery. In contrast, accommodations saw the largest relative decrease in employment (-21.6%), while food and beverage services saw the largest absolute drop (-93,700 people).
Part-time vs. Full-time Employment
The ratio of part-time to full-time workers, viewed across time, provides valuable insight into the stability of tourism employment. Different industries tend to rely on part-time labour to different degrees, and the consistency of these rates over time can show shifts in workplace and employment conditions.
Figure 1 provides an overview of the percentage of part-time employment across the industry groups as of January 2024. These figures use Statistics Canada’s definition of full-time employment as 30 hours a week or more, and part-time employment as fewer than 30 hours per week.
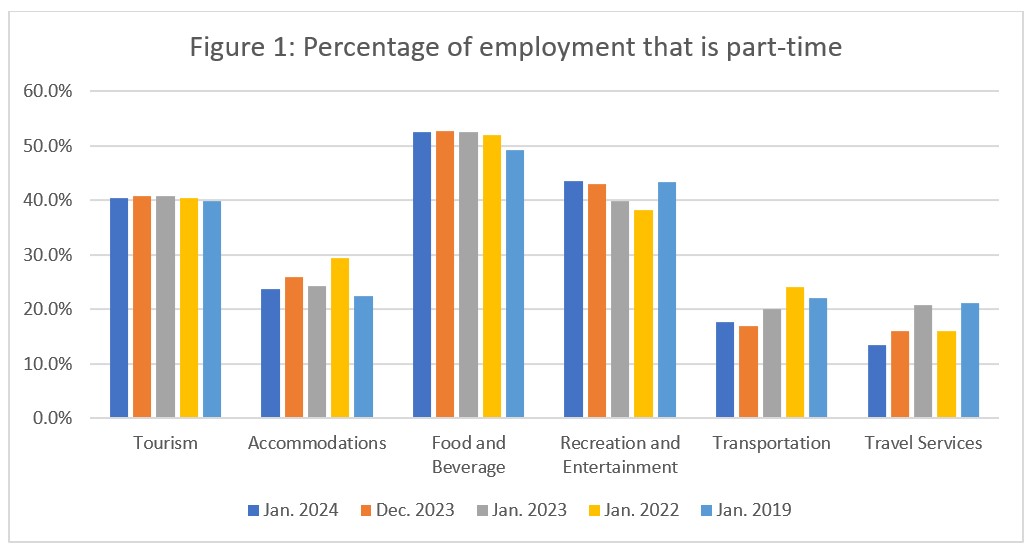
At the sector level, the rate of part-time employment shows remarkable stability at around 40%. There was a very slight decrease from December (orange bars) into January (dark blue bars), but the sector has held steady for several years across successive Januaries, including 2019. Part-time employment in accommodations fell from December, which may mean that as employment fell, those work-hours were absorbed by the remaining employees. Overall part-time employment remained higher than in 2019, although the rate is closer now than it has been since the pandemic. The reliance on part-time employment in food and beverage services has likewise increased since 2019, although it has held steady relative to January 2023, at around 53%. Recreation and entertainment has very nearly returned to 2019 levels of part-time employment after seeing a substantial drop during the pandemic; the steady growth in employment for this industry has likely been fueled by an increase in part-time workers.
In contrast, both transportation and travel services had much lower rates of part-time employment than they did in 2019: transportation rates fell by 4.5% and travel services by 7.8%. In transportation, this likely reflects the sharp increase in demand for transit drivers seen in many urban centres: in spite of increases in employment and labour force, the gap between supply and demand may be requiring more people to take on full-time hours. In travel services, this substantial shift away from part-time work (from one-in-five to one-in-eight) likely reflects a shift in the industry as employment falls in the light of diminishing demand, thanks to the ease of access of online self-service travel arrangements.
Hours worked
The total actual hours worked within the tourism sector is another useful metric by which to assess the health of the labour market (see Figure 2). For industries particularly reliant on part-time work, it is easy for businesses to lower the total hours worked without having to change the number of employees on staff, making this a more immediately responsive index than raw employment figures alone.
As January is the first month of the new year, there is not too much to say about the sector-level trends across the year to date. January’s estimate of total hours worked was only slightly below that seen in January 2023 (-0.9%), but around 3.2% lower than in December 2023, and around 6% below where it was in 2019. When compared with the employment rates discussed above, there are some minor differences at the sector level, but these reflect both differences between industry groups (see Figure 2, below), and the slight aggregate increase in full-time work hours (see Figure 1, above).
On the whole, this January is not far off where it was last year, although it remains to be seen how the protracted economic pressures will affect winter travel demand.
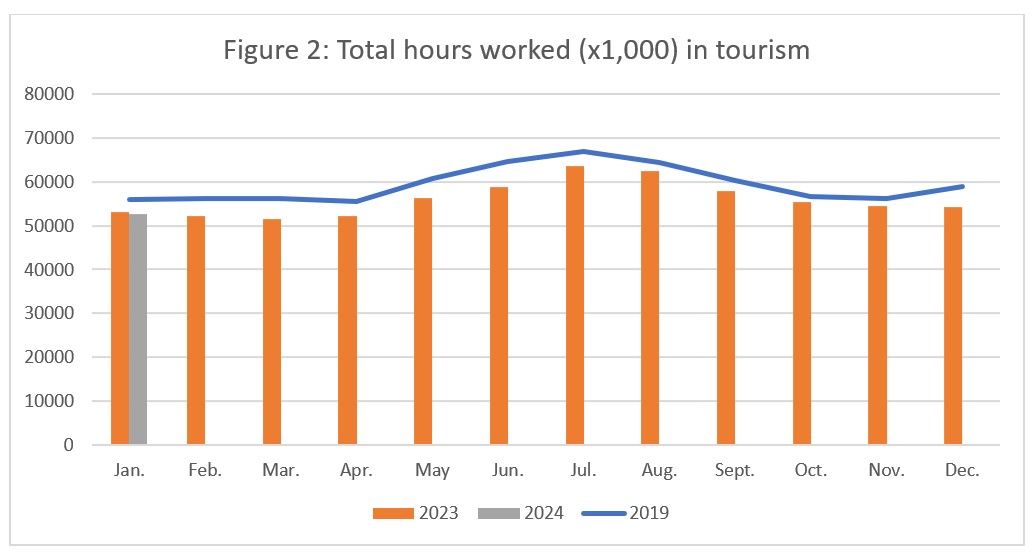
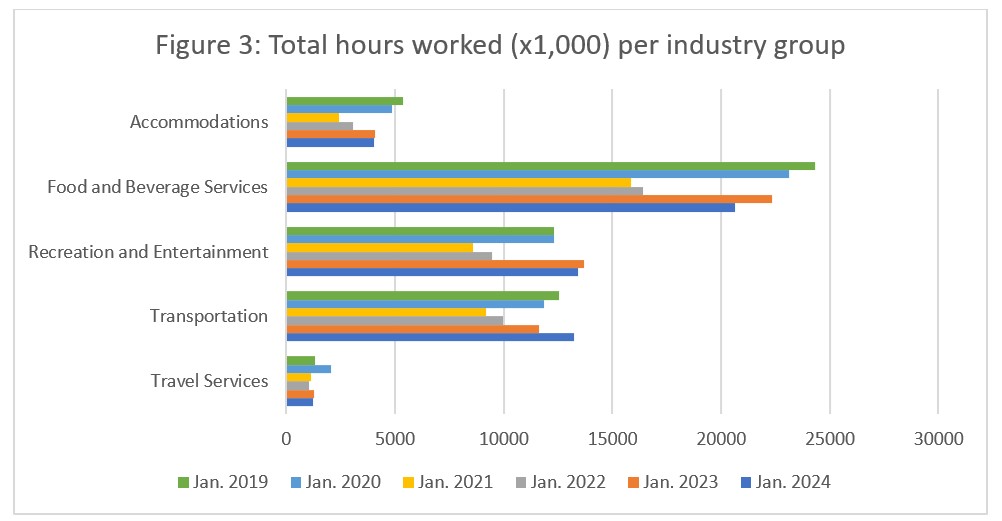
Figure 3 breaks down the sector total hours worked into industry groups, and presents a year-over-year comparison starting in 2019. As January 2020 pre-dated the effects of the COVID-19 pandemic, the green bars and the light blue bars show the trajectory of the sector before the disruption. Hours worked in accommodations, food and beverage services, and transportation declined from 2019 to 2020, suggesting that these industries were beginning to slow down on their own. In contrast, hours worked in travel services increased in 2020, but looking back over the previous six years, this increase looks like an aberration. In the other industries, there was a sharp decrease in hours worked from 2020 into 2021, reflecting the direct impact of the pandemic on the tourism sector.
Hours worked have generally been on the increase since then, although January 2024 was overall lower than January 2023. The drop was most pronounced in food and beverage services, but was also seen in accommodations, recreation and entertainment, and travel services. Only transportation saw a year-over-year increase in hours worked, which tallies with the previously observed increases in employment.
Unemployment
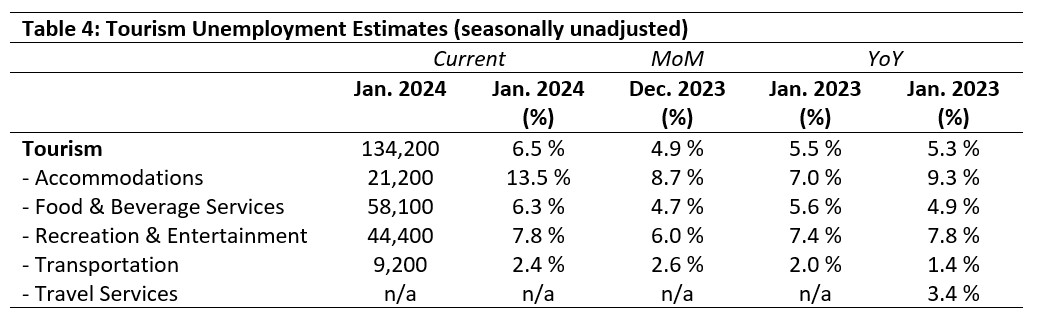
Unemployment[5] in the tourism sector in January 2024 was 6.5%, slightly higher than the economy-wide average of 6.1% (using seasonally unadjusted data). This was substantially higher than in December, in January 2023, or in January 2019. Table 4 provides a summary of tourism unemployment in January.
December 2023: Month-over-Month
Unemployment rose across the sector as a whole from December, with the strongest increase seen in accommodations (+4.8%). Unemployment dropped slightly in transportation, as expected given the greater increase in employment than in the labour force noted earlier.
January 2023 and 2019: Year-on-Year
Tourism unemployment overall was higher in January 2024 than either the previous year or 2019, which likely reflects the general economic landscape and government efforts to control inflation. Unemployment in accommodations in particular was substantially elevated, suggesting this industry group is struggling more with retention now than it had been previously. Unemployment rates in recreation and entertainment and in food and beverage services were not particularly far off either previous January measure, and the increase in transportation was moderate.
Provincial Tourism Unemployment
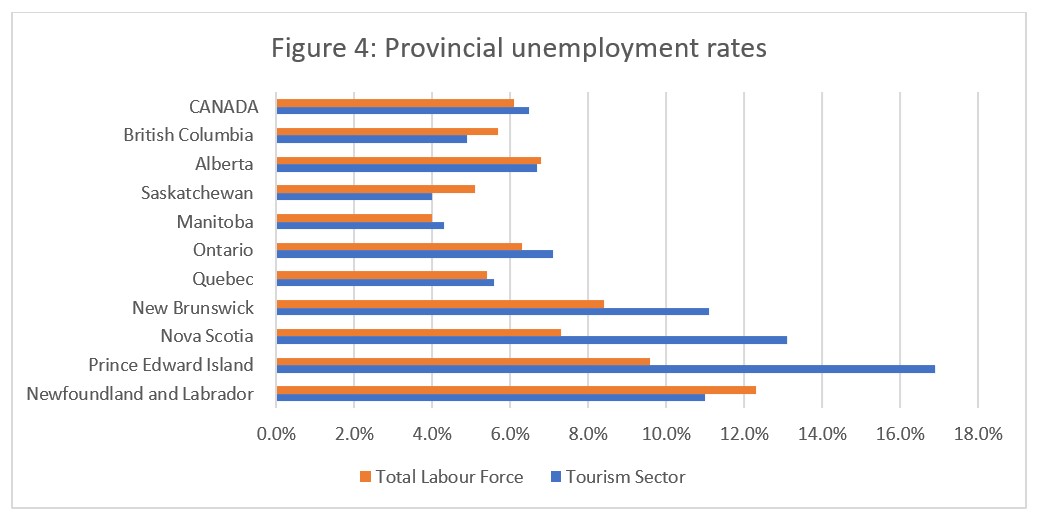
At the aggregate national level, unemployment in tourism was slightly higher than across the wider economy (see Figure 4). Tourism unemployment rates in the Maritime provinces far outstripped those of their broader provincial economies, while tourism unemployment was lower than that of the broader economy in Newfoundland and Labrador, Saskatchewan, British Columbia, and Alberta. Tourism unemployment was highest in Prince Edward Island (16.9%) and Nova Scotia (13.1%), and lowest in Manitoba (4.3%) and Saskatchewan (4.0%).
View more employment charts and analysis on our Tourism Employment Tracker.
[1] As defined by the Canadian Tourism Satellite Account. The NAICS industries included in the tourism sector those that would cease to exist or would operate at a significantly reduced level of activity as a direct result of an absence of tourism.
[2] SOURCE: Statistics Canada Labour Force Survey, customized tabulations. Based on seasonally unadjusted data collected for the period of January 14 to 20, 2024.
[3] The labour force comprises the total number of individuals who reported being employed or unemployed (but actively looking for work). The total Canadian labour force includes all sectors in the Canadian economy, while the tourism labour force only considers those working in, or looking for work in, the tourism sector.
[4] Employment refers to the total number of people currently in jobs. Tourism employment is restricted to the tourism sector, while employment in Canada comprises all sectors and industries.
[5] Unemployment is calculated as the difference between the seasonally unadjusted labour force and seasonally unadjusted employment estimates. The percentage value is calculated against the labour force.