Seasonal Sector Slowdown
Overall, the tourism sector[1] in November saw a contraction over the previous month[2], with drops in both labour force and employment for most industry groups. In the aggregate, unemployment fell slightly, but there was variability across the different industries. The sector was generally in a stronger position than last year, with labour force up by 5.1% and employment up by 4.7%. On both indices, however, the sector remained below 2019 levels.
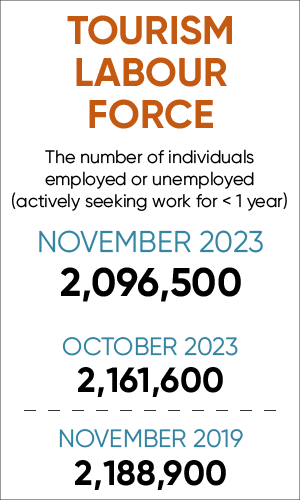
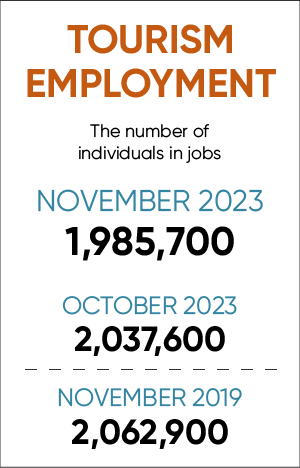
Table 1 provides a snapshot of the industry groups’ performance across labour force, employment, and unemployment, as compared with October 2023 [MoM] and November 2022 [YoY], and with November 2019 as a pre-pandemic baseline. Small arrows represent changes of less than 1%.
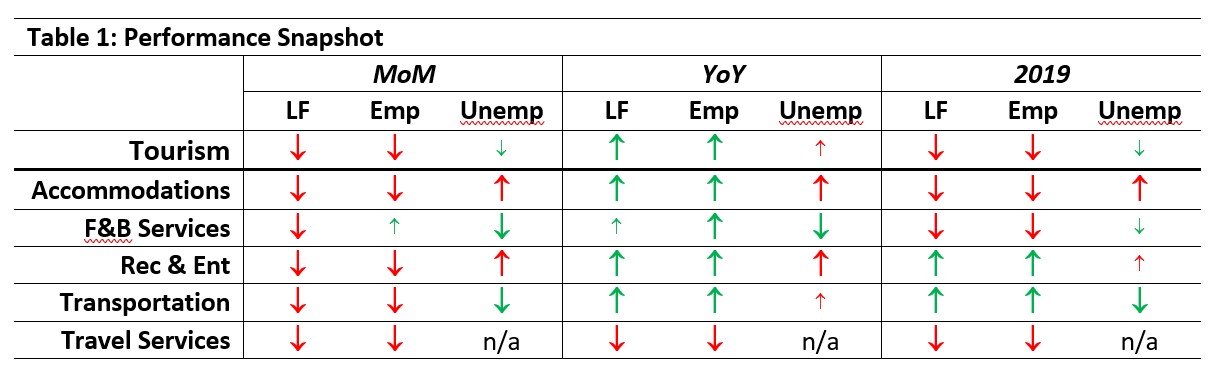
Food and beverage services alone saw a negligible growth in employment over October (+0.5%, essentially holding steady while other industries saw a decrease). Unemployment showed a greater range of different trajectories, with food and beverage services posting the largest drop (-1.7%) and accommodations posting the largest increase (+2.0%). Relative to last year, all industries were in a stronger position on labour force and employment, with the exception of travel services, which remained substantially below November 2022 (-12.5%) on both indices. Compared to pre-pandemic levels, the sector overall remained depressed, but recreation and entertainment and transportation have seen growth in labour force and employment over the past three years.
Tourism Labour Force
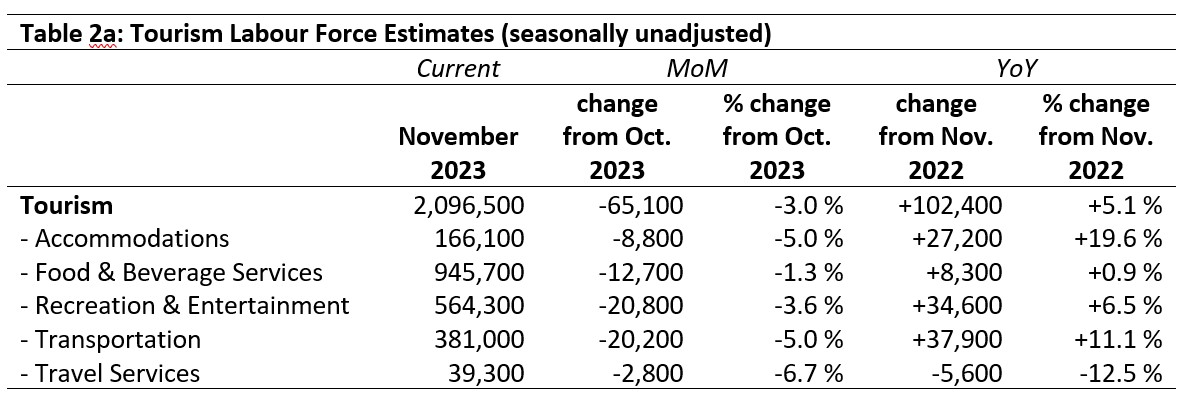
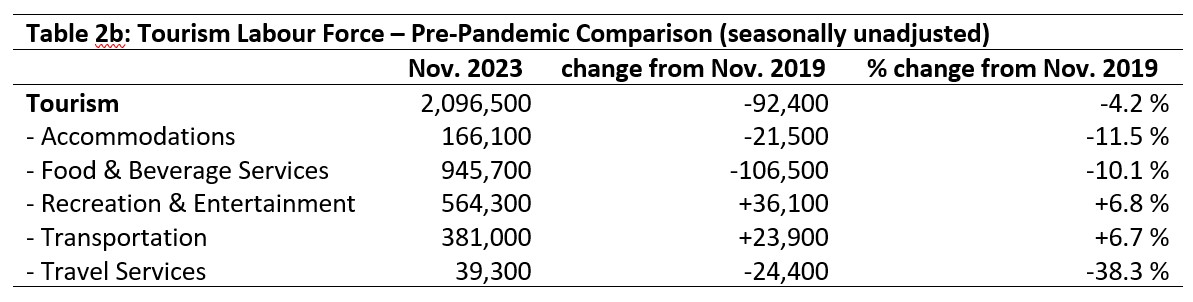
The tourism labour force[3] in November 2023 accounted for 9.8% of the total Canadian labour force, which marked a slight drop from October (-0.3%) and was a full percentage point below its 2019 share (10.8%). Tables 2a and 2b provide a summary of the tourism labour force as of November.
October 2023: Month-over-Month
The tourism labour force lost over 65,000 people relative to October, representing an overall decrease of 3.0%; all industry groups saw a decrease in the past month. The largest absolute losses were seen in recreation and entertainment (-20,800) and transportation (-20,200), and the largest relative losses were seen in travel services (-6.7%), and accommodations and transportation (both -5.0%). The high relative drop in travel services may in part be due to unexpectedly high estimates last month, where we reported an increase of nearly 5,000 people (+13%) in this industry’s labour force; this month’s survey estimate brings numbers more into line with previous trends, suggesting that the October LFS estimates were an aberration.
November 2022: Year-on-Year
With the exception of travel services, the various industry groups that comprise tourism had larger labour pools than last year. Overall, there were 102,400 more people available for tourism jobs (+5.1%). The largest absolute gains were seen in transportation (+37,900) and recreation and entertainment (+34,600), while the largest relative growth was in accommodations (+19.6%). Travel services lost a net 5,600 people from its labour force over the past year, a drop of 12.5%.
November 2019: Pre-pandemic Baseline
The sector as a whole was still 92,400 people shy of where it was in November 2019, a loss of 4.2%. The bulk of this loss was seen in food and beverage services, which remained over 100,000 people below its pre-pandemic labour force size. Accommodations and travel services were also depressed, with the largest relative losses seen in travel services (-38.3%). On the other hand, recreation and entertainment (+36,100; +6.8%) and transportation (+23,900; +6.7%) continued to post higher labour force estimates than pre-pandemic baselines, although the rate of growth has slowed compared to October when both industries posted increases of around 10% over October 2019.
Tourism Employment
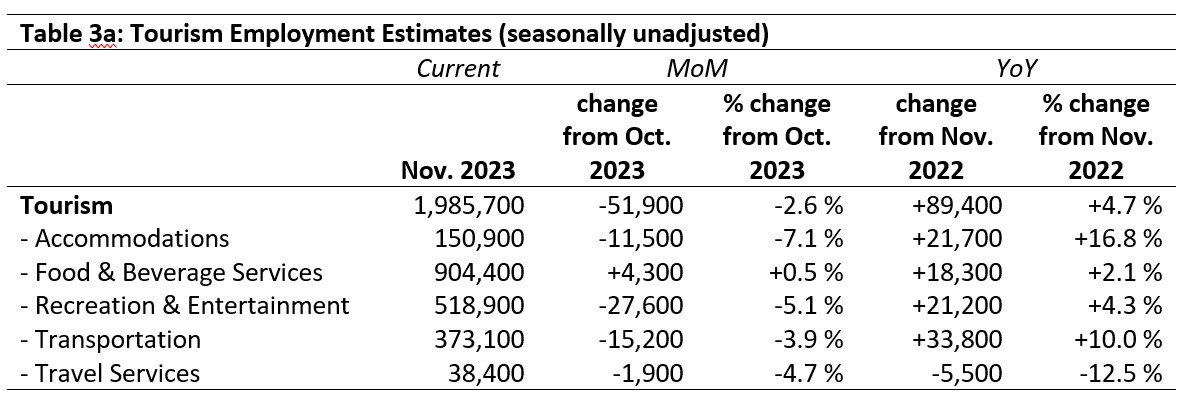
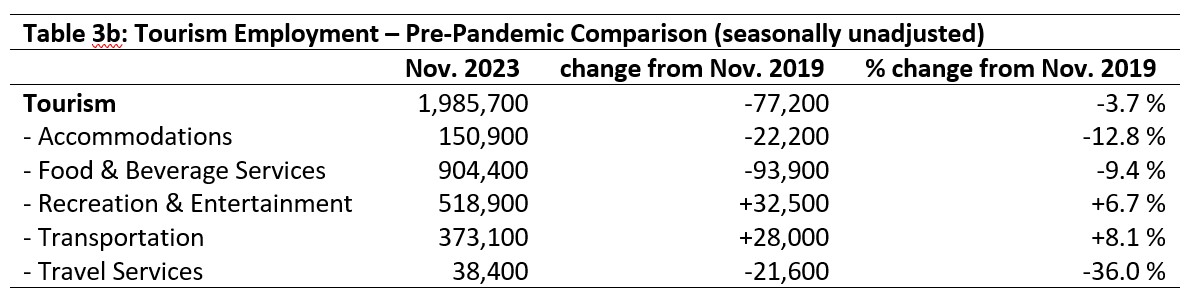
Tourism employment[4] accounted for 9.8% of all employment in Canada, employing 9.3% of the total Canadian labour force. These figures are both below where they were in October, and only slightly higher than they were in 2022, suggesting that the tourism sector is slowing in its trajectory of recovery, although this may be partly seasonal contraction as the sector is between the summer and winter surges in demand. Both estimates remain around one percentage point below 2019 rates. Employment in November 2023 was 96.3% of what it was in 2019. Tables 3a and 3b provide a summary of tourism employment as of November 2023.
October 2023: Month-over-Month
Employment across the overall sector decreased by nearly 52,000 people since October, a change of 2.6%. Food and beverage services gained 4,300 people, representing a very slight growth of 0.5% (meaning that the industry stayed more or less static). All other industries saw decreases, with the largest absolute decrease seen in recreation and entertainment (-27,600), and the largest relative decrease in accommodations (-7.1%).
November 2022: Year-on-Year
For the most part, the industry groups comprising tourism had higher employment than in November 2022. Travel services had lost a net 5,500 people in the past year, a drop of 12.5%. The largest absolute growth was seen in transportation (+33,800), and the largest relative increase in accommodations (+16.8%). These trends broadly parallel what was seen in the year-over-year labour force estimates, with some industry-group variation that is noted in the unemployment discussion below.
November 2019: Pre-pandemic Baseline
At the aggregate level, employment in tourism was around 3.7% below where it was in November 2019, although this figure masks considerable variation at the industry level. Employment in food and beverage services saw the largest absolute difference (-93,900), while travel services saw the largest relative decline (-36%). On the other hand, both recreation and entertainment and transportation saw growth, in line with the figures noted in the labour force discussion above.
Part-time vs. Full-time Employment
The ratio of part-time to full-time work is a good indicator of the stability of the sector, where during the peak of the pandemic there was a substantial swing towards part-time work, and where the early recovery period was characterised by some dynamic shifts in this metric. Figure 1 provides an overview of the percentage of part-time employment across the industry groups as of November 2023, using the Statistics Canada cut-off for full-time work of 30 hours per week (or higher); part-time work is therefore fewer than 30 hours per week.
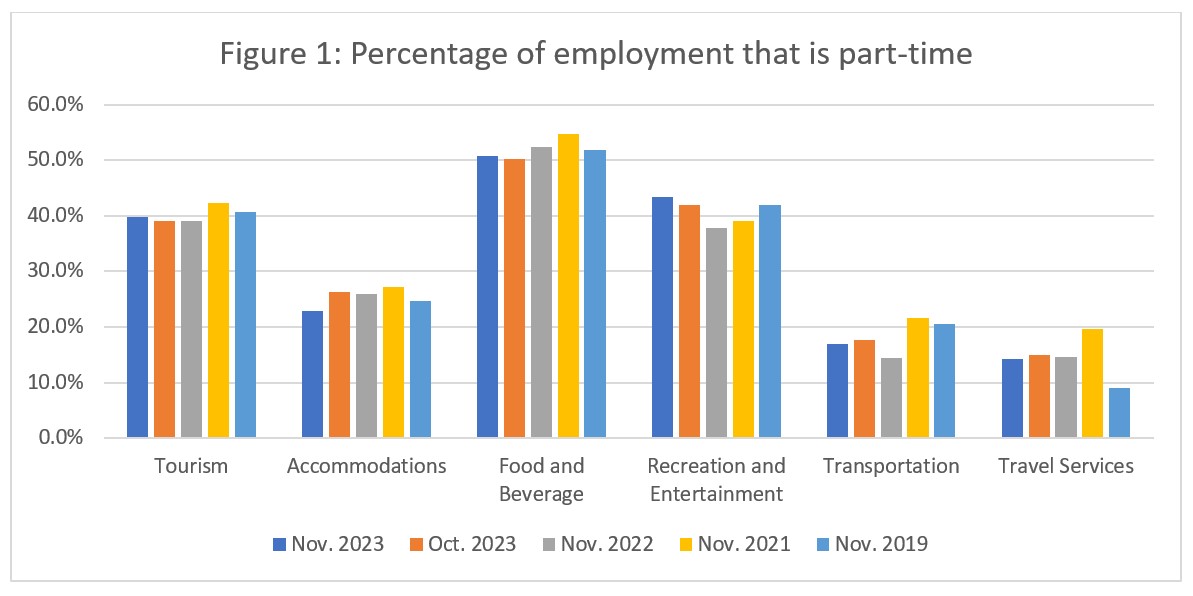
As November is often a relatively quiet season from a tourism demand perspective—it falls between peak summer and winter seasons, and in the run-up to the December holiday season, demand is likely decreased in most areas—it is unsurprising that we see relative stability across the sector and its groups. The overall part-time percentage in tourism was around 40%, which has stayed fairly consistent over last month, and previous years. Accommodations saw a slight drop (-3.4%) in the part-time ratio of employment from October, and remained slightly more dependent on full-time workers than in November 2019. Food and beverage services saw a slight increase in part-time work from October, but remained slightly below where it was in 2019. Similarly, recreation and entertainment saw a slight increase on October, but also a more substantial increase (+5.5%) on November 2022; the ratio of part-time work in this industry is slightly above what it was in 2019. The ratio of part-time work fell slightly from October in transportation, and was 3.5% lower than in 2019. Travel services remained relatively steady from both October and last year, but the ratio of part-time work was 5.3% higher than in 2019.
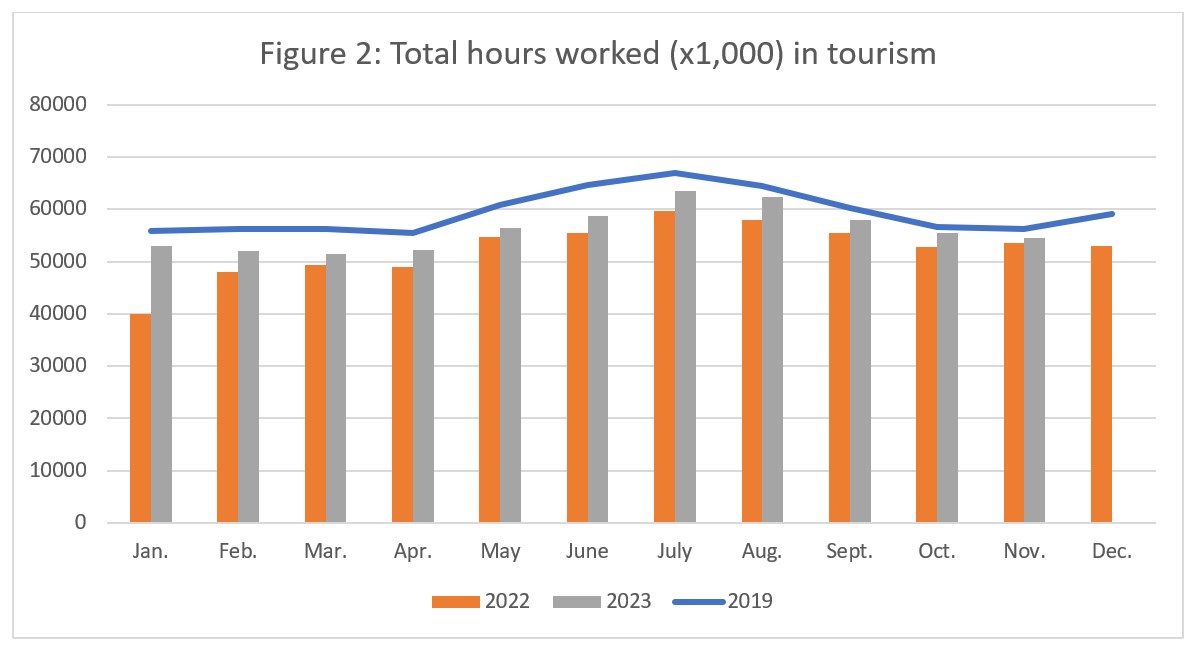
Hours worked
The total actual hours worked within the tourism sector is another useful metric by which to assess the health of the labour market (see Figure 2). The trend throughout 2023 of generally narrowing the gap with 2019 has broadly held steady, with each month to date posting more hours worked in 2023 than in 2022. While this was true in November, it is worth noting that the increase over 2022 was the smallest seen thus far in 2023. It remains to be seen how the 2023 holiday season will impact the December estimates, given the tight economic conditions and other pressures that may constrain the beginning of the winter surge in demand.
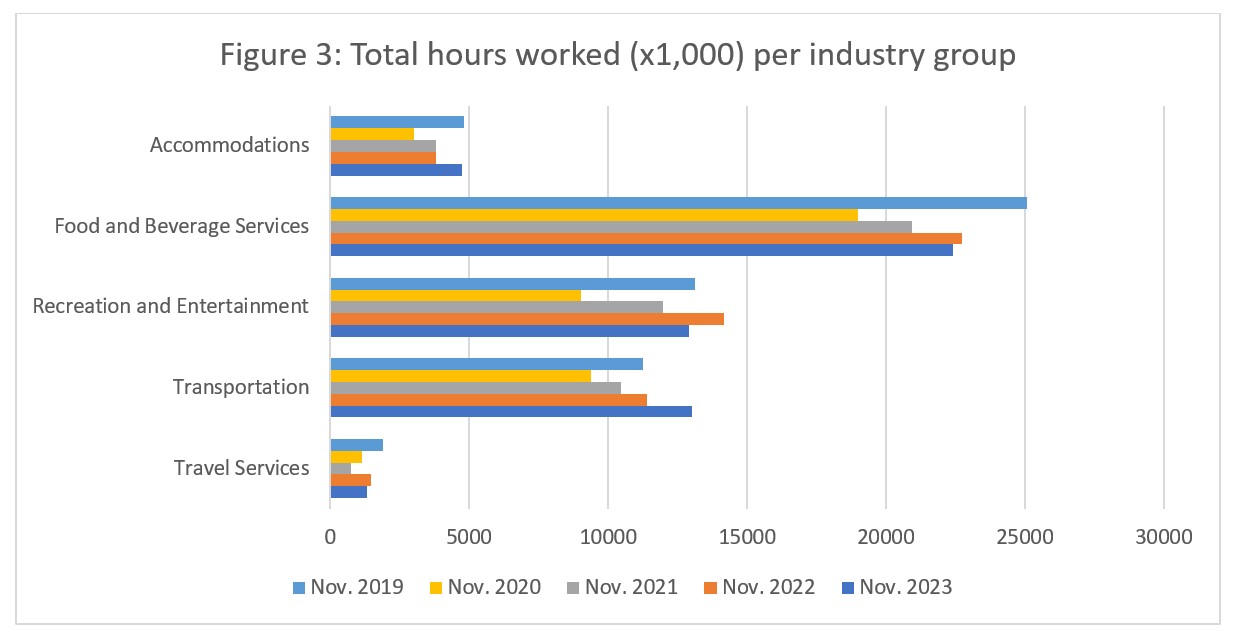
When the sector totals are disaggregated into industry groups (see Figure 3), most industries have seen relatively stable year-on-year growth in the total hours worked. Food and beverage services in November 2023 was substantially below its total hours worked in 2019, and 2023 also saw a slight drop from 2022. Recreation and entertainment was slightly below its posted hours worked in 2019, and saw a more substantial drop from last year. Transportation, on the other hand, saw not only an increase on last year, but the total hours worked in this industry has already surpassed pre-pandemic levels. It is interesting to compare these trends with those noted above in terms of overall employment and the ratio of part-time to full-time work: these trends indicate that recreation and entertainment has seen a net increase in part-time employees, while transportation has seen a net increase in full-time employees. Accommodations has nearly reached its 2019 total hours worked, while travel services remained below 2019.
Unemployment
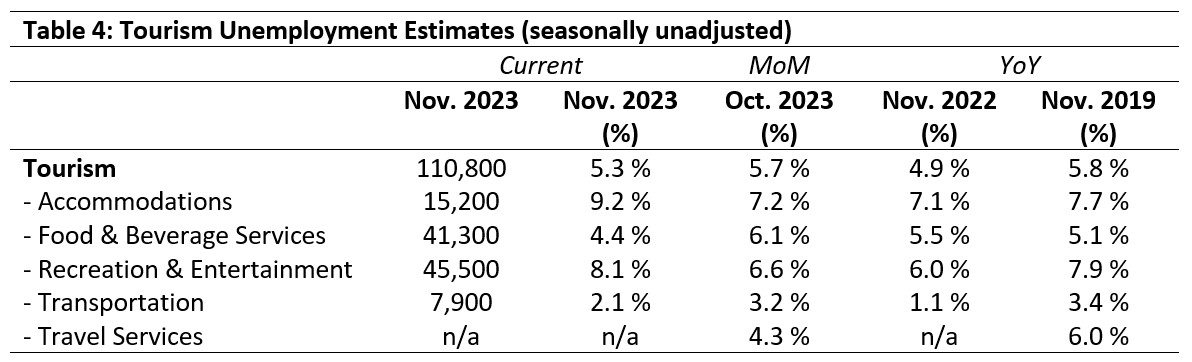
Unemployment[5] in the tourism sector in November 2023 was 5.3%, equal to that seen in the broader Canadian economy (using seasonally unadjusted data). This marked a slight drop from October (-0.4%), and equal increase from last year (+0.4%). Table 4 provides a summary of tourism unemployment as of November.
October 2023: Month-over-Month
The direction of change in unemployment rates varied from industry to industry relative to October. Unemployment rates increased in accommodations and recreation and entertainment (+2.0% and +1.5%, respectively), while unemployment rates fell for both food and beverage services and transportation (-1.7% and -1.1, respectively). No information was available for November on unemployment in travel services, but based on the estimates provided for labour force and employment, we can infer that unemployment is relatively low for this industry.
November 2022 and 2019: Year-on-Year
For the most part, unemployment rates in November 2023 were broadly comparable with those of previous years, which is perhaps not surprising given the overall slowness of the season for the sector. The sector-wide average was slightly below 2019 levels. In transportation, fluctuations year-on-year have been staying below 2019 levels; the ongoing tightness of the market in this industry is likely to continue if employment growth stays strong. The somewhat higher rate in accommodations may similarly ease some of the hiring pressures facing the industry. It will be interesting to see what happens in December and into the new year.
Provincial Tourism Unemployment
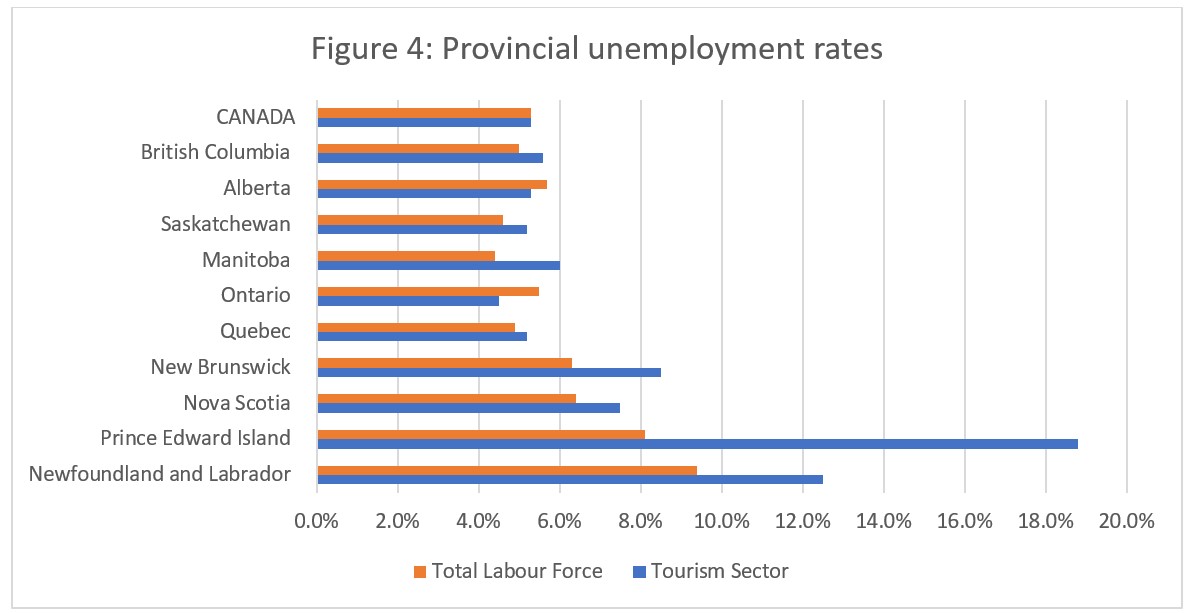
At the national level, unemployment in tourism was on par with that of the wider economy (see Figure 4). At the provincial level, tourism unemployment was lower than that of the broader provincial economy only in Alberta and Ontario. The Atlantic provinces posted the highest tourism unemployment rates, which included 18.8% in Prince Edward Island and 12.5% in Newfoundland and Labrador. Tourism unemployment was lowest in Ontario (4.5%) and in Quebec and Saskatchewan (both 5.2%).
Snapshot on Recreation and Entertainment
Over the past several months, transportation and recreation and entertainment have shown consistently higher numbers in both labour force and employment than in 2019. The August LFS report presented a snapshot of the transportation industry group, looking across different occupations and presenting some broad trends in which occupations had shown growth, and which—in spite of the industry-level trajectory—had shrunk. This month, we take a brief look at recreation and entertainment, to understand the reported growth in more depth.
This survey of recreation and entertainment necessarily differs from that of transportation, as it is not possible with this industry group to provide a coherent view through an occupational lens. Partly this is because of the different structures and roles of the two systems that are used to collect data. The North American Industry Classification System (NAICS) is designed to separate the different industries that comprise the overall economy. The National Occupational Classification system (NOC) is designed to classify employment by skill, training, responsibility, and broad description of a given job. However, because of the way that tourism as a sector is structured, there is not always a clear one-to-one relationship between an occupation and an industry. For instance, if an amusement park includes a restaurant or café, the people who work in that establishment would have a food-related NOC, but their NAICS would not be that of a restaurant, but rather of amusement parks and arcades.
The data that we purchase from Statistics Canada on employment by NOC and by NAICS cannot be easily cross-tabulated: that is to say, we can examine the data by NOC or by NAICS, but we cannot look at the distribution of a particular occupation (NOC) across different industries (NAICS) where they might be employed. This complicates the data reporting for an industry group as diverse as recreation and entertainment, where the sheer variety of businesses and organizations makes it impossible to include all of the possible occupations that might be found within it, without massively over-counting the occurrences of those occupations in other industry groups. A quick count of only those occupations that unambiguously belong in the recreation and entertainment industry group accounted for only a fraction of the total jobs in that group, and—more importantly—did not show the patterns of growth that the overall industry-level data clearly shows.
With this group, then, the most productive approach is to look at it through a NAICS lens. Tourism HR Canada generally reports industry group information aggregated by related NAICS codes into the groups that we recognize as the discrete components of the tourism sector: accommodations, food and beverage services, recreation and entertainment, transportation, and travel services. However, it is possible to disaggregate those industry groups into the four-digit NAICS codes that are used to define specific industries: recreation and entertainment is defined in the Canadian Tourism Satellite Account (the economic grouping of industries that comprise tourism) as including nine distinct industries (see Table 5), although one is very loosely defined (“Other amusement and recreation industries”). Note that the most current data available is from October 2023, so Table 5 presents year-over-year changes in employment from October 2020 (the earliest data we have available).
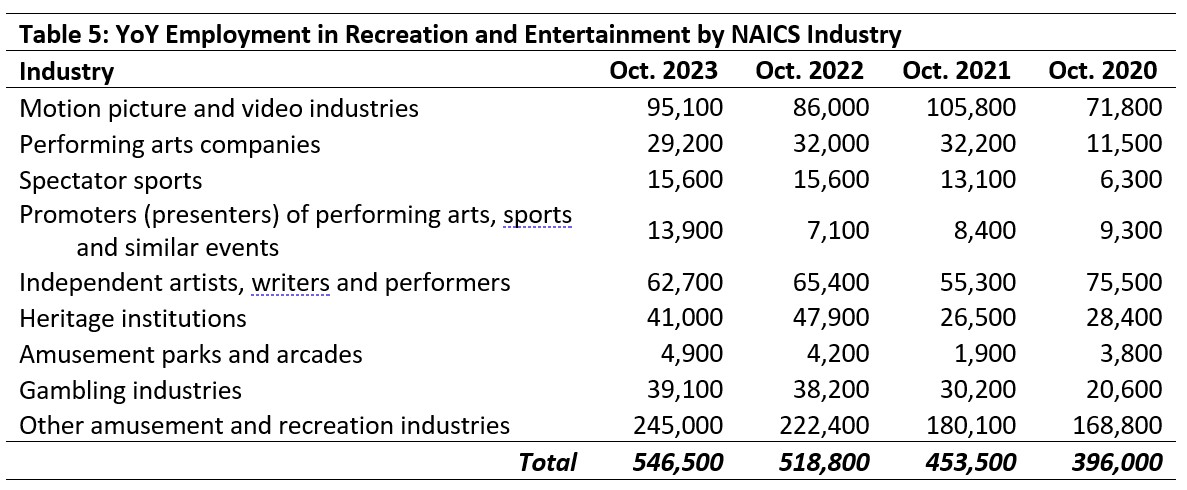
The annual growth is clearly evident in the employment total row at the bottom of the table. It is unfortunate that comparison data for 2019 is not available, but even without this pre-pandemic benchmark, it is nevertheless interesting to look at the distribution of employment across these different industries.
Motion picture and video industries had higher employment in 2023 than in 2020, although it peaked in 2021—this likely coincides with the reopening of movie theatres and other related venues in many jurisdictions across the country. Performing arts companies likewise had higher employment in 2023 than in 2020, with a peak in 2021-2022. Spectator sports saw employment increase through to 2022, then hold steady. Employment in the promotions industry fell from 2020 through to 2022, then rebounded substantially in 2023. Employment as independent artists fell from 2020, with a modest rebound in 2022 but it has since fallen slightly. Heritage institution employment rose dramatically from 2020 to 2022, and has fallen somewhat in 2023. Amusement parks and arcades have gained around 1,000 employees since 2020, and gambling industries have almost doubled. By far the biggest absolute increase in employment has been in the catch-all category “Other amusement and recreation industries”, but it is difficult to comment on this growth because it represents such a wide range of operations, businesses, and other organizations.
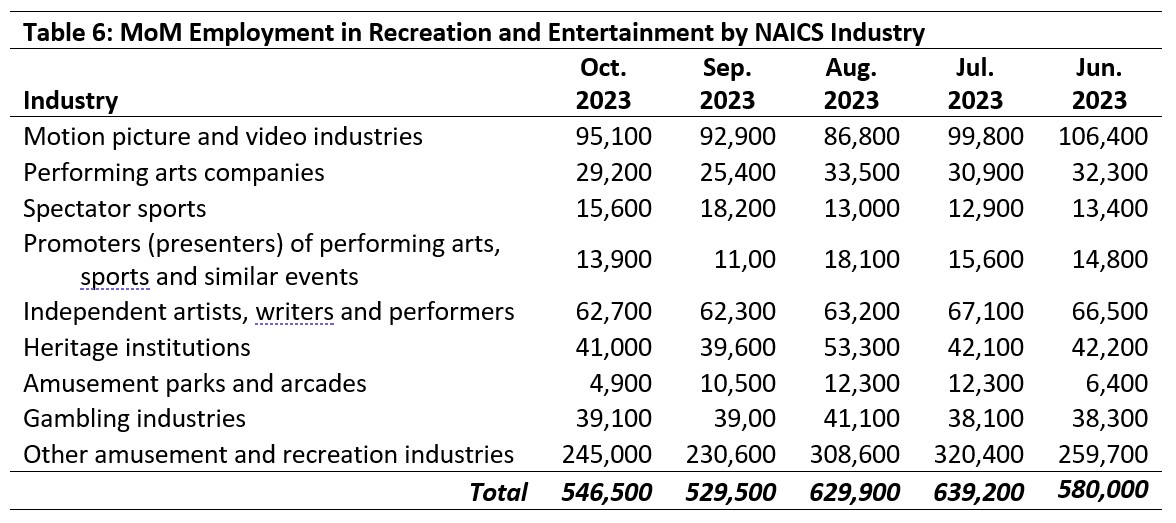
We can also consider the employment gains in this industry group month-over-month (see Table 6), where the summer peak and subsequent fall in employment into autumn can be seen in more detail. August 2023 marked peak employment for several industry groups, although the effect was stronger in some industries than in others. Employment in amusement parks and arcades has fallen by more than 50% since its summer peak. Gambling industries have maintained fairly consistent employment levels, indicating a degree of immunity to seasonal peaks and troughs for businesses in this industry. Spectator sports had a higher employment rate in October than in June, likely due to the alignment of seasons for many professional sports associations.
View more employment charts and analysis on our Tourism Employment Tracker.
[1] As defined by the Canadian Tourism Satellite Account. The NAICS industries included in the tourism sector those that would cease to exist or would operate at a significantly reduced level of activity as a direct result of an absence of tourism.
[2] SOURCE: Statistics Canada Labour Force Survey, customized tabulations. Based on seasonally unadjusted data collected for the period of November 12 to 21, 2023.
[3] The labour force comprises the total number of individuals who reported being employed or unemployed (but actively looking for work). The total Canadian labour force includes all sectors in the Canadian economy, while the tourism labour force only considers those working in, or looking for work in, the tourism sector.
[4] Employment refers to the total number of people currently in jobs. Tourism employment is restricted to the tourism sector, while employment in Canada comprises all sectors and industries.
[5] Unemployment is calculated as the difference between the seasonally unadjusted labour force and seasonally unadjusted employment estimates. The percentage value is calculated against the labour force.