Sector Stability Masks Industry Variability
Overall, the tourism sector[1] in October saw little change over the previous month[2], with slight increases in labour force and unemployment, and a slight fall in employment, although this generalization masks variability at the industry group level. Relative to last year, the sector was in a considerably stronger position across both labour force and employment, although unemployment was also up. However, the sector remained below 2019 levels for both labour force and employment.
At the industry group level, the profile overall is more mixed. Table 1 provides a snapshot of the industry groups’ performance across labour force, employment, and unemployment, as compared with September 2023 [MoM] and October 2022 [YoY], and with October 2019 as a pre-pandemic baseline. Small arrows represent changes of less than 1%.
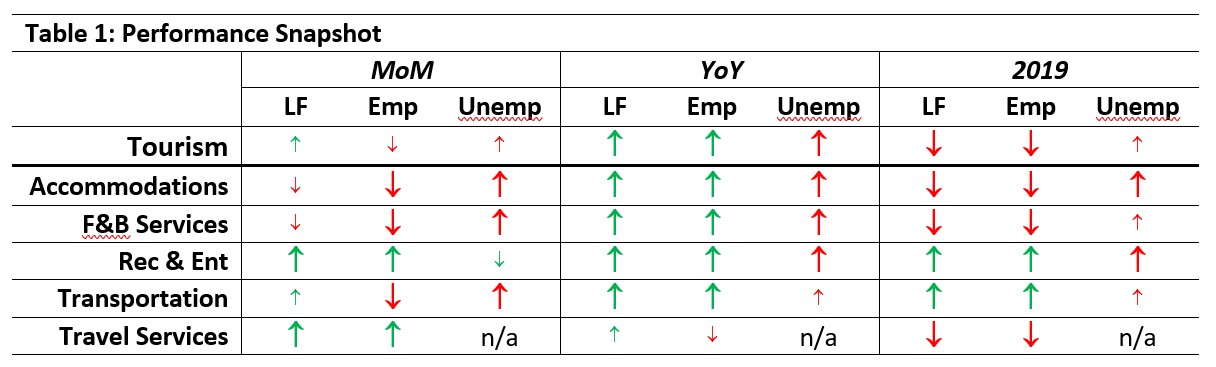
Both accommodations and food and beverage services saw declines in labour force and employment since September, and an increase in unemployment. Recreation and entertainment and travel services saw increases across labour force and employment, while transportation saw a slight increase in labour force but a drop in employment. Relative to last year, all industry groups other than travel services were in a stronger workforce position, although unemployment was also higher. Compared to 2019, most industry groups were still below the pre-pandemic baselines for labour force and employment, and had higher unemployment; recreation and entertainment and transportation were in a stronger position than in 2019.
Tourism Labour Force
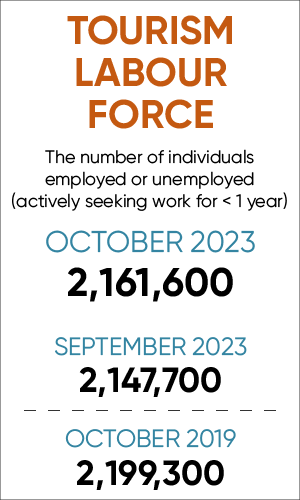
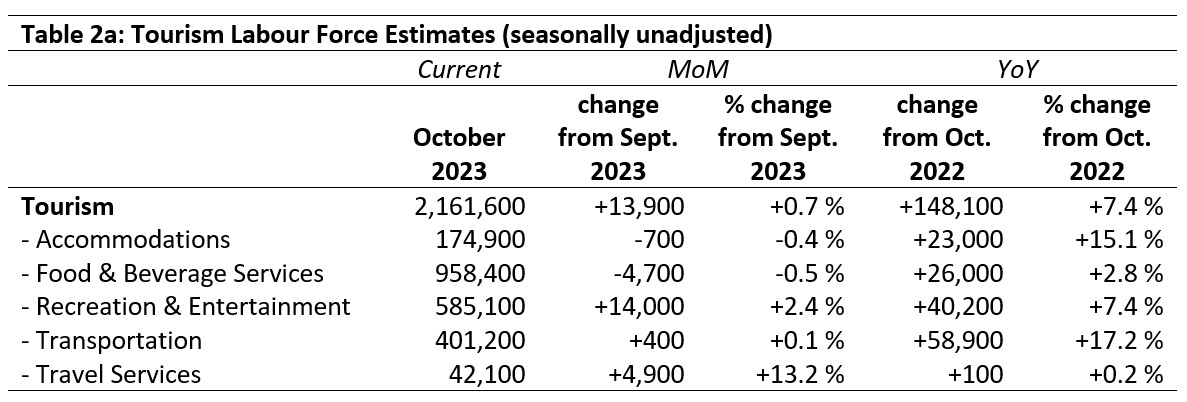
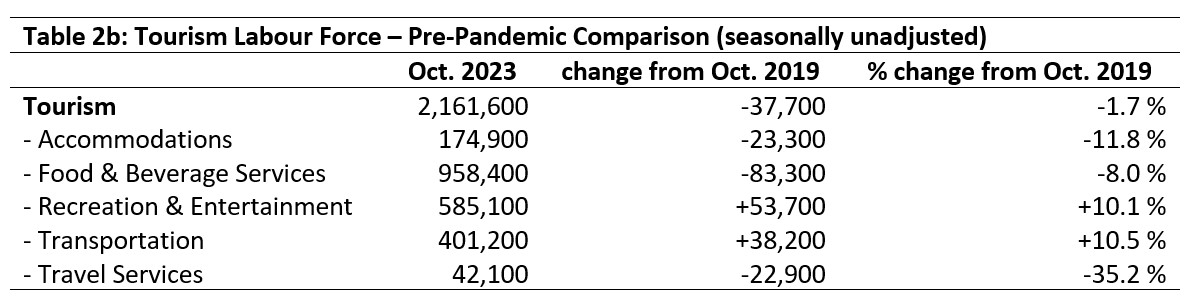
The tourism labour force[3] in October 2023 accounted for 10.1% of the total Canadian labour force, which was on par with September (10.0 %), and higher than October 2021, but below the pre-pandemic ratio (10.8%). Tables 2a and 2b provide a summary of the tourism labour force as of October 2023.
September 2023: Month-over-Month
The sector as a whole saw a very modest increase of just under 14,000 people in the tourism labour force, representing an increase of less than 1%. This sector-level increase was due to an increase of 2.4% in recreation and entertainment (+14,000) and 13.2% in travel services (+4,900), but offset by a slight drop in food and beverage services (-0.5%, representing 4,700 people). Transportation and accommodations stayed very near September figures. The increase in travel services is unexpected, given the trends over the previous several months, and it is not clear at this point whether this signals a change in the industry, or if this is a momentary aberration in the data. Future LFS data will help answer this question.
October 2022: Year-on-Year
The sector, as well as its constituent industry groups, was in a much stronger position this year than in October 2022. The labour force overall was up by nearly 150,000 people, and no industry group saw any losses. Travel services was essentially stable, having gained only 100 people (+0.2%), but the relative increases were substantially higher in accommodations and transportation in particular. Food and beverage services and recreation and entertainment saw large absolute gains, but these translated to smaller relative gains due to the size of those industry groups as sub-sets of the tourism sector more broadly.
October 2019: Pre-pandemic Baseline
For the most part, the tourism labour force remained below pre-pandemic levels, although the sector-level gap was less than 2%. At the industry level, however, that gap was considerably wider for accommodations, travel services, and food and beverage services. In contrast, both recreation and entertainment and transportation were 10% up on 2019 levels. As noted in the August LFS report, aggregate figures for transportation are a bit misleading, as most of the increases noted here are linked to taxi and limousine drivers, which in the National Occupational Classification (NOC) system includes Uber and other ride-share drivers, while other high-demand occupations (particularly around the aviation industry) remain significantly depressed.
Tourism Employment
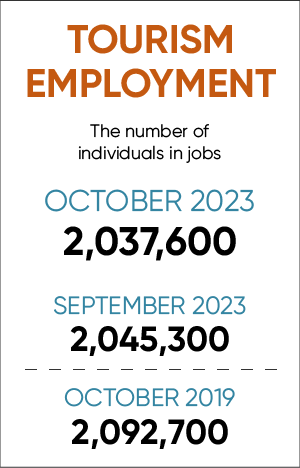
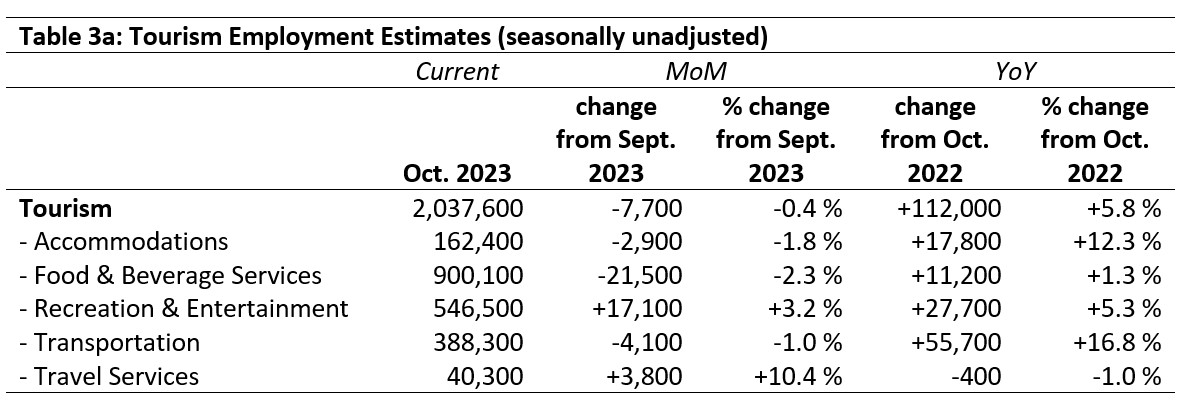
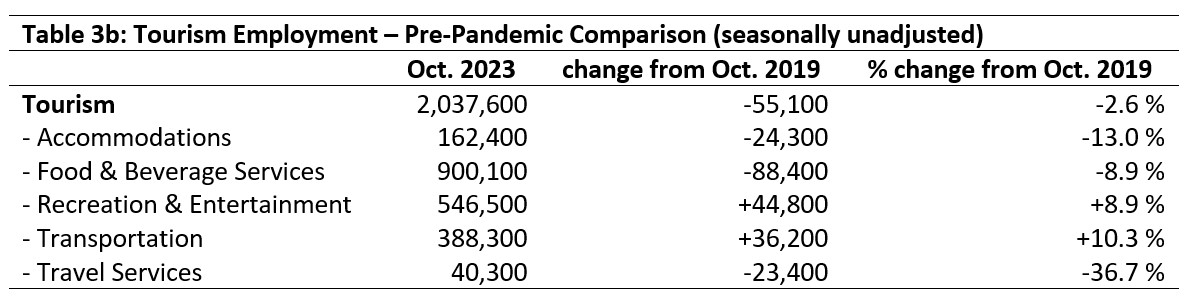
Tourism employment[4] accounted for 10.0% of all employment in Canada in October, which represented 9.5% of the total Canadian labour force. These figures are comparable to September 2023 (10.1% and 9.6%, respectively), higher than they were last year, but still below October 2019 ratios. Tables 3a and 3b provide a summary of tourism employment as of October 2023.
September 2023: Month-over-Month
The sector saw an aggregate decrease of less than half a percentage point from September, although there was more variability across the different industry groups. The largest absolute losses were seen in food and beverage services, which lost over 20,000 people in employment (-2.3%). The largest absolute gains were in recreation and entertainment, which grew by over 17,000 workers (+3.2%), and the largest relative gains were seen in travel services, whose addition of 3,800 people represented an increase of over 10%. As noted in the labour force section above, it is not clear why this industry has jumped so much in the last month, and will need to be looked at closely over the coming months. Accommodations and transportation saw modest losses.
October 2022: Year-on-Year
Tourism employment was in a stronger position this October than it was one year previously, showing an overall gain of more than 110,000 people (+5.8%). All industry groups except travel services had some growth, ranging from +1.3% in accommodations (nearly 18,000 additional people) to +16.8% in transportation (over 55,000 people). Travel services saw a drop of 1%, which accounted for 400 people.
October 2019: Pre-pandemic Baseline
As with labour force numbers, the sector as a whole had lower employment than before the pandemic, with substantial drops for accommodations, food and beverage services, and travel services being countered by sizeable increases in recreation and entertainment and transportation.
Part-time vs. Full-time Employment
The ratio of part-time to full-time work is a good indicator of the stability of the sector, as over the course of the pandemic disruptions there were substantial swings as businesses reduced hours to avoid laying staff off, and then saw an increase in average hours worked as demand returned ahead of staffing increases. Figure 1 provides an overview of the percentage of part-time employment across the industry groups as of October 2023.
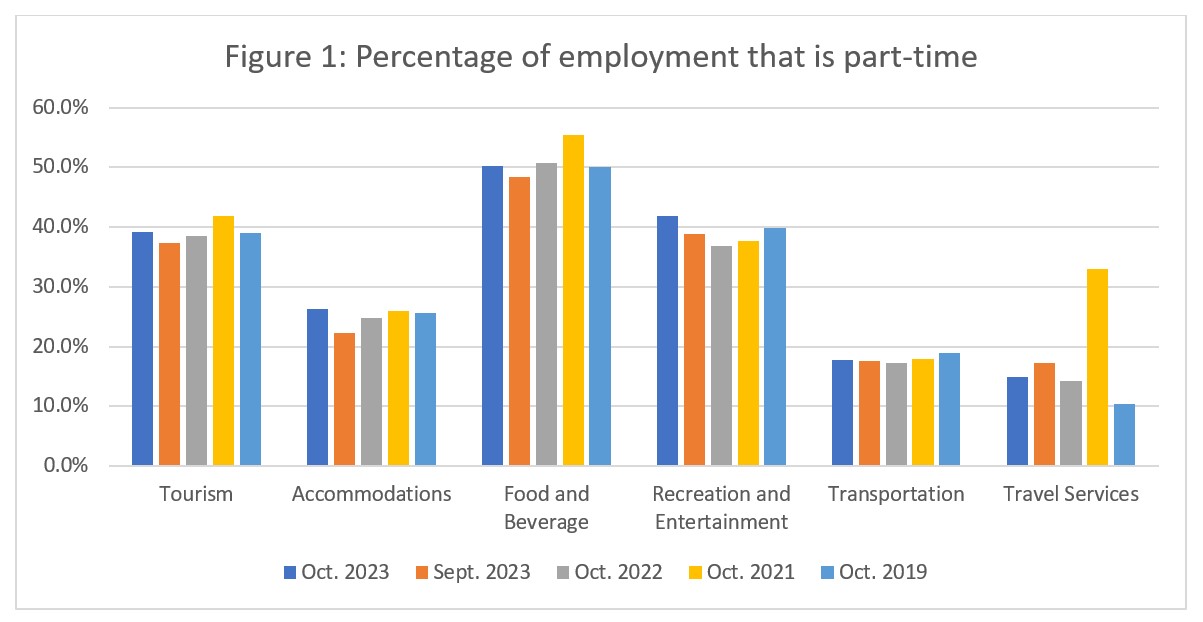
By and large, industries have returned to patterns quite similar to pre-pandemic ratios, although part-time work was elevated in recreation and entertainment and in travel services. For most industries, there was a slight increase in part-time work from September, which is unsurprising as university and college students—who are often seasonal, full-time through the summer—were likely scaling back their hours as the academic year settled into a more intensive routine. Travel services saw a drop from September, but as noted previously, the changes in this industry group in October will require a deeper time lens to contextualise and understand. It may be that this industry is suddenly returning to something closer to pre-pandemic employment levels and patterns—or the October data may be complicated by external factors that are not visible in this data set.
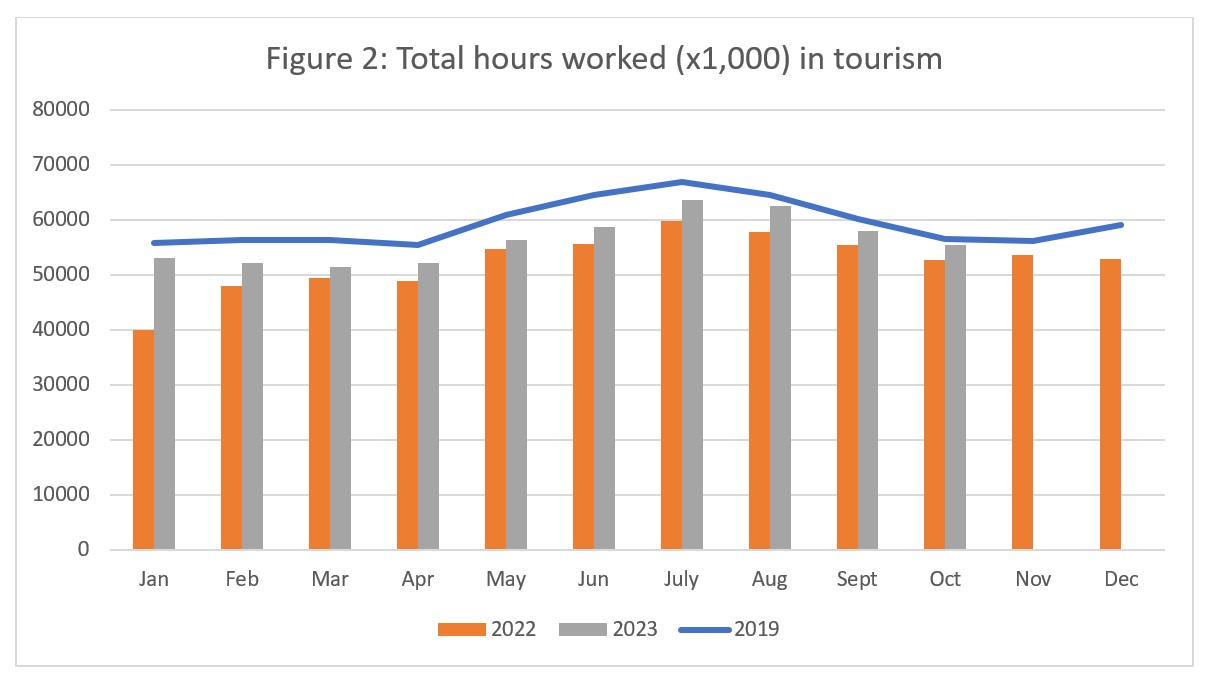
Hours worked
The total actual hours worked within the tourism sector is another useful metric by which to assess the health of the labour market (see Figure 2). In October 2023, the total hours worked was 97.9% of the total in October 2019, which aligns closely with the sector’s employment data for the same time (with October 2023 employment at 97.4% of 2019 levels). Over the course of the summer, the gap between 2019 and 2023 narrowed, and it has continued to do so. The hours worked in 2023 have consistently been higher than in 2022, and October was no exception.
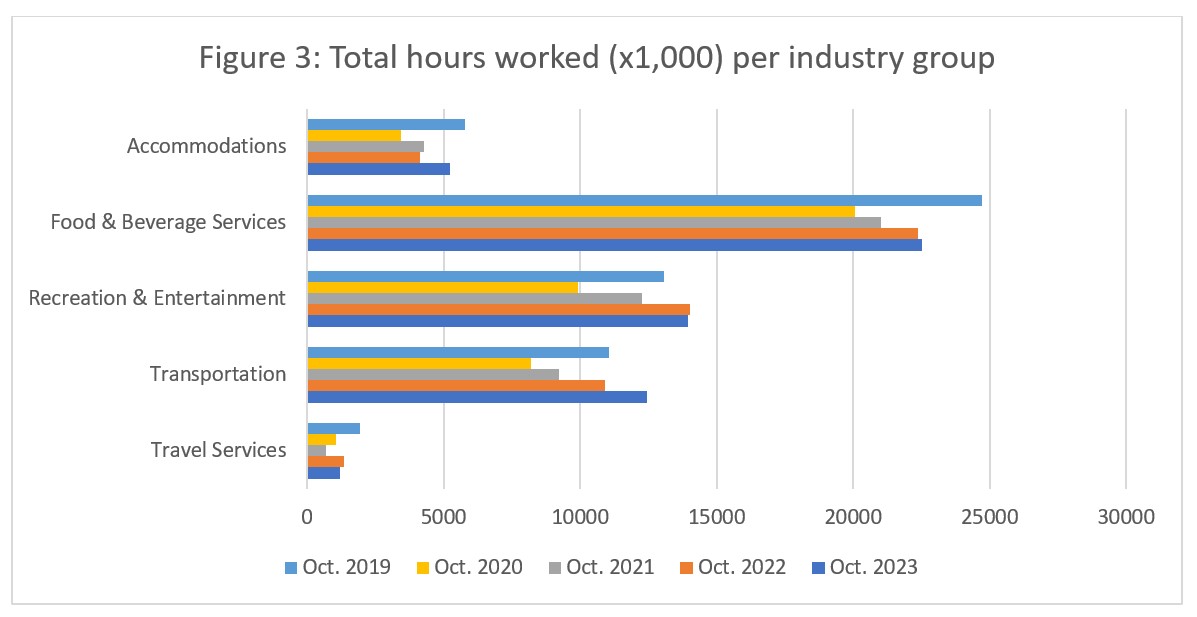
When the sector totals are broken down into industry groups (see Figure 3), most industries have seen year-on-year increases since 2019. The picture is somewhat more complicated in accommodations (which saw a slight dip in 2022) and travel services (where the lowest ebb was in 2021 rather than in 2020). Total hours worked in accommodations remained below 2019 levels, as they did in food and beverage services and travel services (which further complicates the uptick in labour force and employment noted earlier—the slight increase in part-time work does not fully account for these patterns), while recreation and entertainment and transportation were unsurprisingly higher, given the growth noted previously.
Unemployment
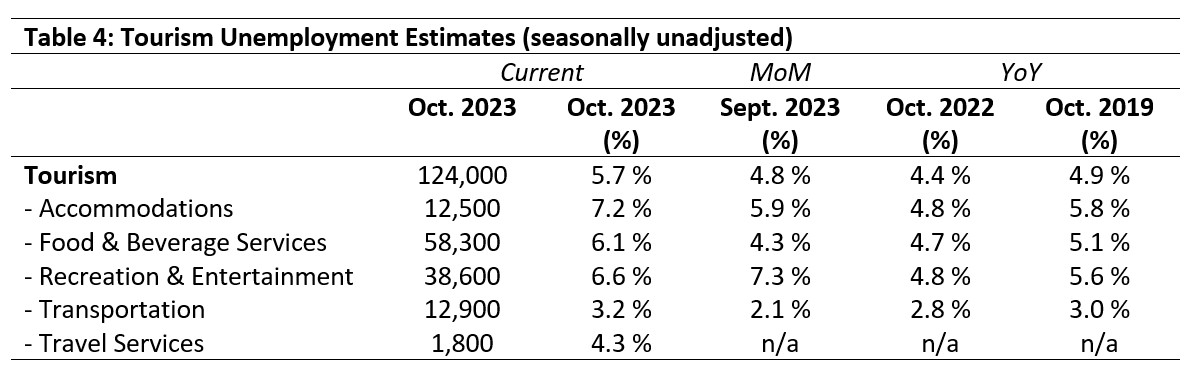
Unemployment[5] in the tourism sector in October 2023 was 5.7%, which was slightly higher than that of the total Canadian economy (5.3%, using seasonally unadjusted data). It was also higher than last month or October 2022 and 2019, which hopefully signals a slight easing of the labour tightness. Table 4 provides a summary of tourism unemployment in October.
September 2023: Month-over-Month
Unemployment was higher across most industry groups compared to September. The sector as a whole saw an increase of just under 1%, and the largest increase was seen in food and beverage services (+1.8%). Recreation and entertainment alone saw a drop in unemployment of 0.7%. Although unemployment data was available for the month of October, no comparable rate was available for September, so it is not possible to provide a month-over-month estimate.
October 2022 and 2019: Year-on-Year
Relative to last year, unemployment was similarly elevated across the industry groups for which data was available. The sector saw an average increase of 1.3%. The highest year-on-year increase was noted in accommodations (+2.4%), and the smallest in transportation (+0.4%). Given the YoY changes in labour force and employment, these unemployment increases are not unexpected.
Provincial Tourism Unemployment
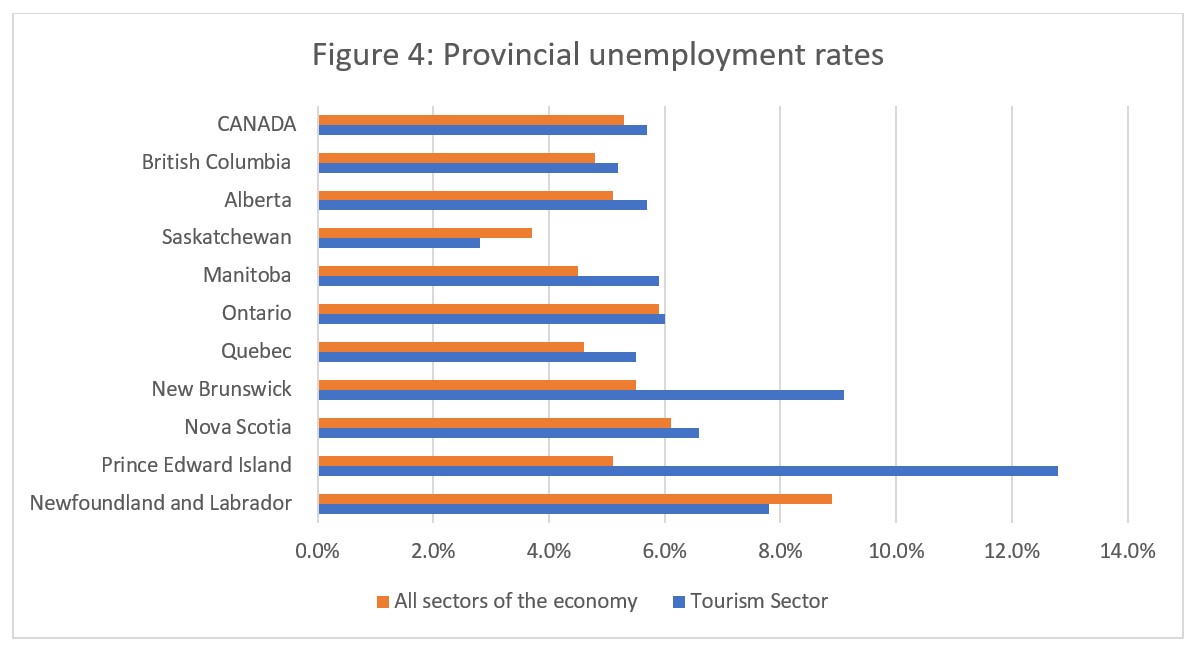
At the aggregate national level, unemployment in tourism slightly higher than that of the broader economy (see Figure 4). At the provincial level, unemployment was also higher in tourism than in the larger provincial economies for most provinces, except for Saskatchewan (tourism unemployment 2.8%, economy-wide 3.7%) and Newfoundland and Labrador (tourism unemployment 7.8%, economy-wide 8.9%). Tourism unemployment was highest in Prince Edward Island (12.8%) and New Brunswick (9.1%), and lowest in Saskatchewan (2.8%).
View more employment charts and analysis on our Tourism Employment Tracker.
[1] As defined by the Canadian Tourism Satellite Account. The NAICS industries included in the tourism sector those that would cease to exist or would operate at a significantly reduced level of activity as a direct result of an absence of tourism.
[2] SOURCE: Statistics Canada Labour Force Survey, customized tabulations. Based on seasonally unadjusted data collected for the period of October 15 to 24, 2023.
[3] The labour force comprises the total number of individuals who reported being employed or unemployed (but actively looking for work). The total Canadian labour force includes all sectors in the Canadian economy, while the tourism labour force only considers those working in, or looking for work in, the tourism sector.
[4] Employment refers to the total number of people currently in jobs. Tourism employment is restricted to the tourism sector, while employment in Canada comprises all sectors and industries.
[5] Unemployment is calculated as the difference between the seasonally unadjusted labour force and seasonally unadjusted employment estimates. The percentage value is calculated against the labour force.