End-of-Summer Drop in Tourism Employment and Labour Force
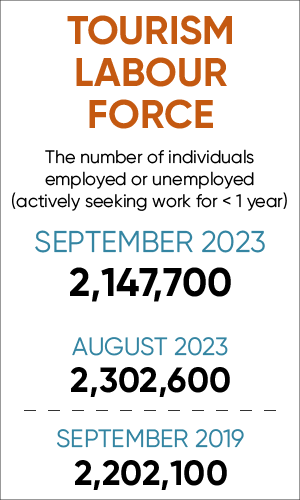
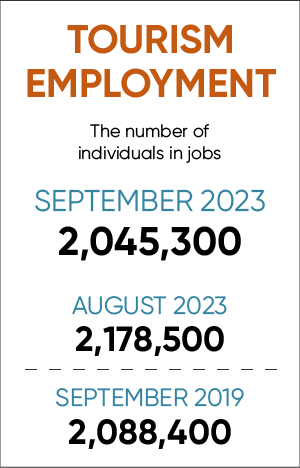
Overall, the tourism sector[1] in September saw a contraction over the previous month[2], with both labour force and employment falling by over 5%. This is not surprising given the summer peak had ended and much of the seasonal workforce had left the sector, including students returning to school. Compared to last year, the sector was in a stronger position in both labour force and employment, although numbers remained below their pre-pandemic levels of September 2019.
At the industry group level, the profile overall was generally quite stable this month, and almost entirely in a more depressed position than in August. Table 1 provides a snapshot of the industry groups’ performance across labour force, employment, and unemployment, as compared with August 2023 [MoM], September 2022 [YoY], and with September 2019 as a pre-pandemic baseline. Small arrows represent changes of less than 1%.
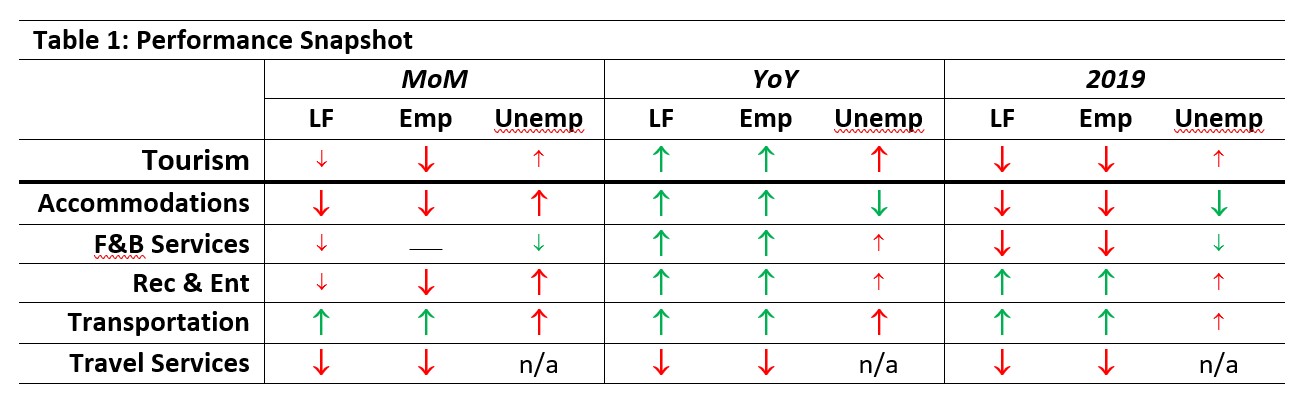
Transportation alone saw a month-over-month increase in employment, although the labour force fell slightly below August levels. Unemployment levels were increased in accommodations and recreation and entertainment, but they dropped in both food and beverage services and transportation. Compared to September 2022, most industries were in a substantially stronger position, except for travel services. As we get further removed from 2019, more industries begin to post better performances: both recreation and entertainment and transportation were stronger in labour force and employment, although these industries also saw increased unemployment relative to pre-pandemic levels.
Tourism Labour Force
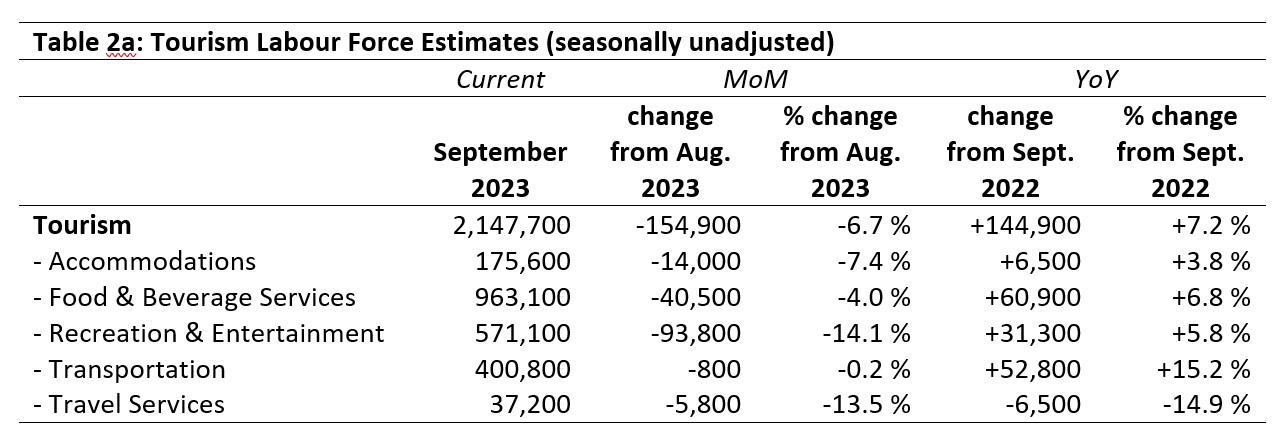
The tourism labour force[3] in September 2023 accounted for 10.4% of the total Canadian labour force, a drop from August but higher than in September 2022. Tables 2a and 2b provide a summary of the tourism labour force as of September.
August 2023: Month-over-Month
The sector lost nearly 155,000 people from its labour force from August. With the exception of transportation, which saw only a very modest change in labour force, all industry groups lost a substantial number of people from their respective labour pools. The bulk of the labour force losses came from recreation and entertainment (-14.1%) and food and beverage services (-4%). Travel services lost 13.5% from its labour force, and accommodations lost 7.4%. Much of this is no doubt due to the end of summer shift in seasonal employment, tempered by longer-standing labour conditions across the industry groups.
September 2022: Year-on-Year
Relative to one year ago, the tourism sector was in a much stronger position this September. Travel services saw a decline in labour force of nearly 15% over last September, which amounted to 6,500 fewer people in the labour pool, a general continuation of the trend observed over the past several months. In contrast, all other industry groups gained people in their respective labour forces. The smallest gain—both relatively and in absolute numbers—was in accommodations, while the largest relative gain was in transportation and the largest absolute gain was in food and beverage services.
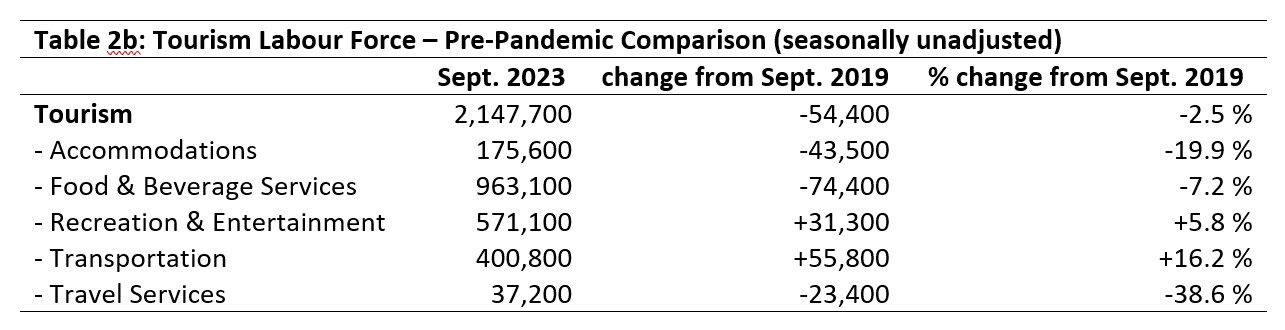
September 2019: Pre-pandemic Baseline
On the whole, the tourism labour force remained 2.5% below where it was in September 2019, although this relatively small gap masked more substantial differences at the industry level. Recreation and entertainment and transportation were both substantially above their pre-pandemic labour force figures, with transportation in particular in a much stronger position (+16.2%, representing nearly 56,000 additional people). On the other hand, travel services was nearly 39% below where it was pre-pandemic, with accommodations (just shy of 20% below 2019 levels) and food and beverage services (-7.2%) also lagging far behind. This lopsidedness between industry groups reflects larger staffing issues across the sector as a whole, likely due in part to shifting prestige and perceptions associated with different industries.
Tourism Employment
Tourism employment[4] represented 10.1% of all employment in Canada, which accounted for 9.6% of the Canadian labour force overall. These rates were slightly lower than in August, but higher than the previous two years. They remained below 2019 pre-pandemic levels, but this gap has been narrowing annually. Tables 3a and 3b provide a summary of tourism employment as of September 2023.
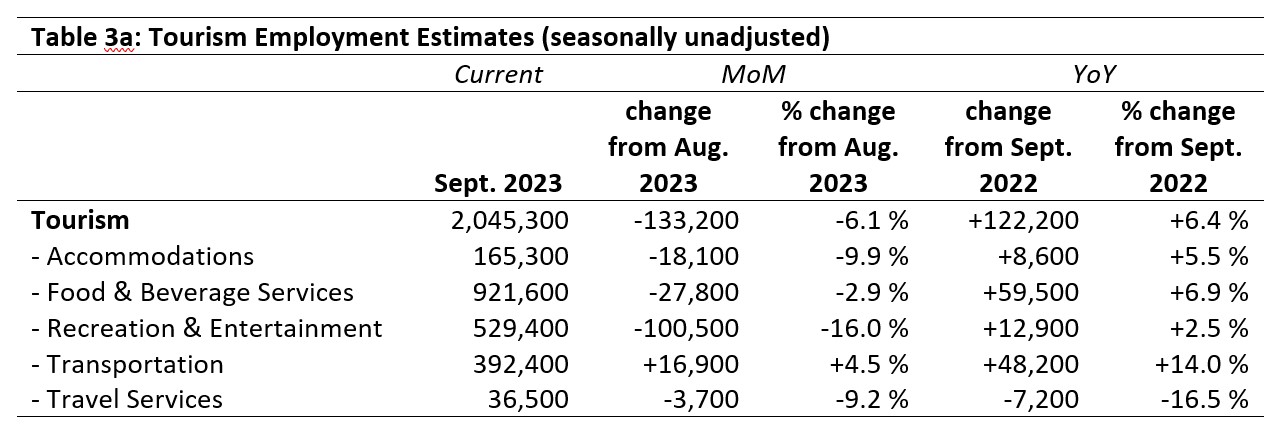
August 2023: Month-over-Month
The sector as a whole was around 6% lower in employment overall, although as always this masked variability at the level of the industries. Transportation grew by 4.5% from August, which may reflect the return of school bus employment, as well as an increase in gig-economy drivers (such as Uber and Lyft, as discussed in last month’s report). The largest loss in employment, both in absolute and relative terms, was in recreation and entertainment, followed by a drop of nearly 10% in accommodations and just over 9% in travel services. Although food and beverage services saw a substantial drop in absolute numbers, this was only 3% of its workforce.
September 2022: Year-on-Year
Employment across the sector was on average up by 6.4% on September 2022, reflecting an increase of over 120,000 people working in tourism. Most industries saw growth, with rates of increase ranging from 2.5% in recreation and entertainment to 14% in transportation. Travel services alone saw a decline in employment, losing over 7,000 workers (-16.5%) from last year. It is unclear whether this industry group is recovering more slowly than the others but will eventually return to pre-pandemic levels, or whether the recent increase in online products and services that consumers can self-manage means that the industry group is undergoing a permanent decrease.
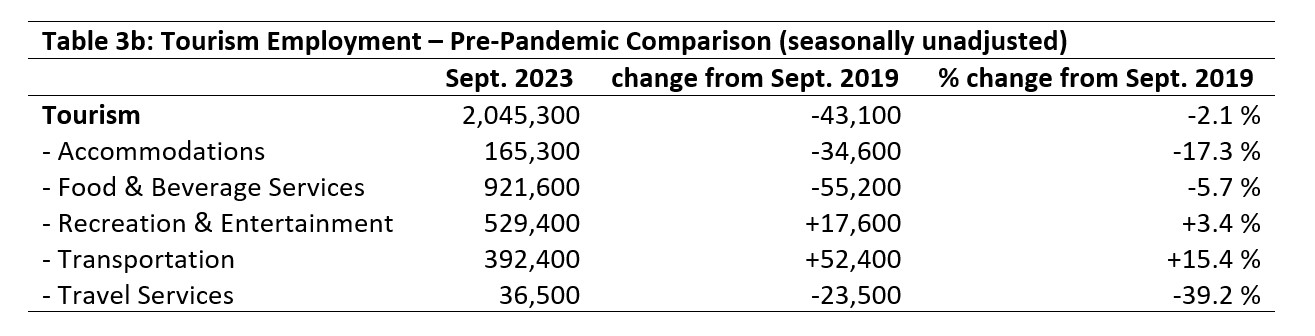
September 2019: Pre-pandemic Baseline
Except for recreation and entertainment and transportation, tourism industries remained below pre-pandemic employment levels. The aggregate average for the sector was -2.1% lower than in September 2019, which amounted to around 43,000 fewer people in employment. The employment gap relative to September 2019 was lower than the labour force gap, meaning fewer unemployed people at the sector level. The largest relative losses in employment compared to pre-pandemic levels were observed in travel services (-39%) and accommodations (-17%), and the biggest absolute loss was seen in food and beverage services (-55,200 people).
Part-time vs. Full-time Employment
Given the shift in employment patterns from August to September, it’s interesting to look at the rate of part-time versus full-time employment. As students transition back into their studies, their work habits may also shift towards part-time work, or even drop off entirely. Figure 1 provides an overview of the percentage of part-time employment across the industry groups, using Statistics Canada’s threshold of 30 hours per week as the definition of full-time employment.
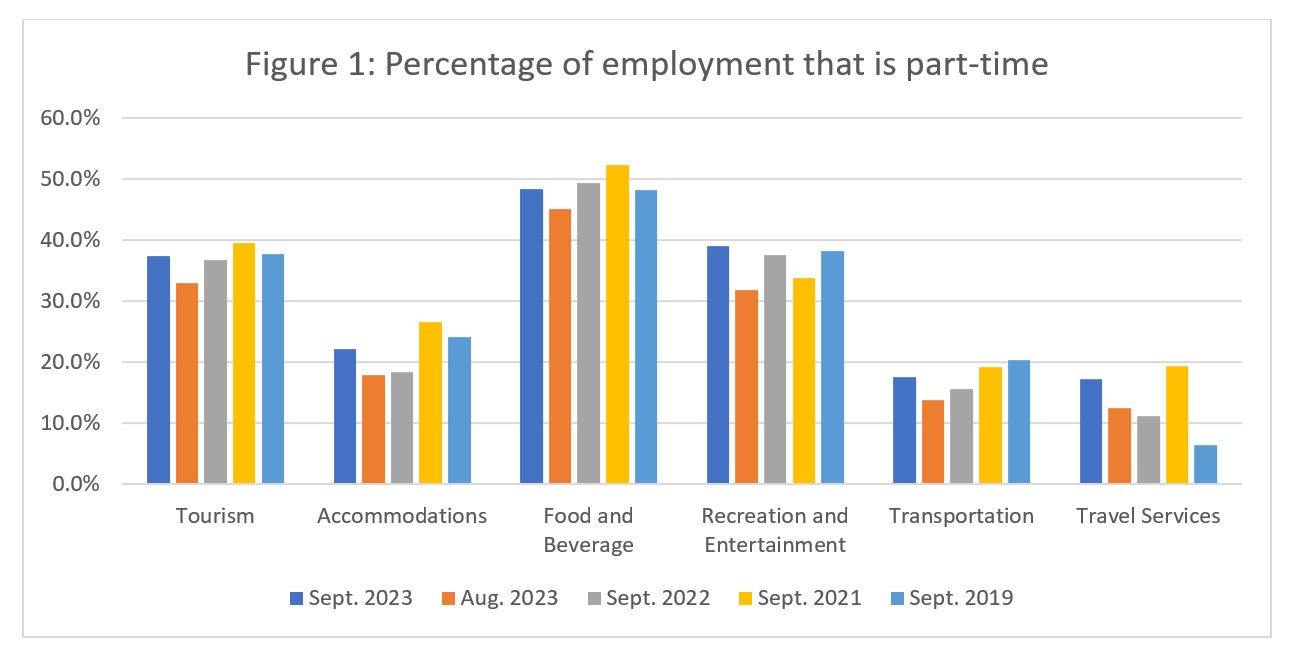
As expected, there was an across-the-board increase from August (in orange) to September (dark blue) in the percentage of work that was part-time. The sector average increased by just over 4%, and the most pronounced increase was in recreation and entertainment, at just over 7%. Most industries have returned to part-time ratios quite close to what they had in September 2019, with the exception of travel services, which has historically had very low part-time employment (6.5%), but this September was at 17.3% part-time employment.
Hours worked
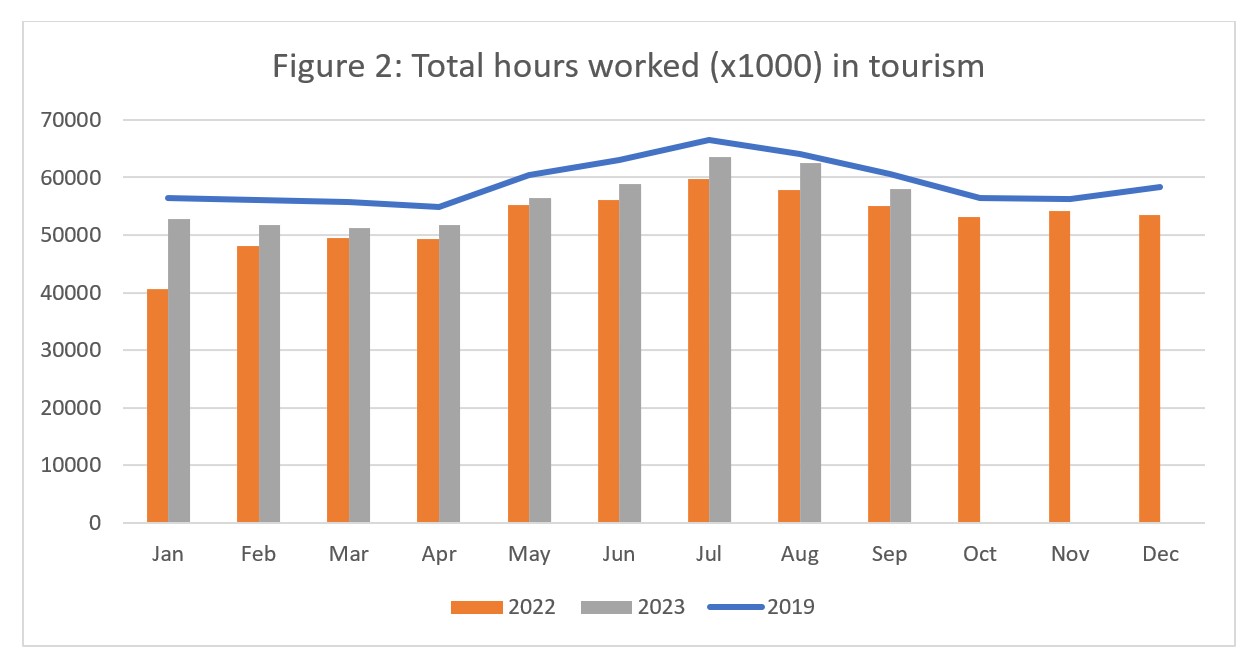
The total actual hours worked within the tourism sector is another useful metric by which to assess the health of the labour market (see Figure 2). The generally pattern for 2023 continued in September to closely parallel that of 2019 without quite reaching the same levels, and the number of hours worked remained higher in 2023 than in 2022. September saw a drop-off from August, but that is unsurprising given the decrease in employment and the shift towards more part-time work.
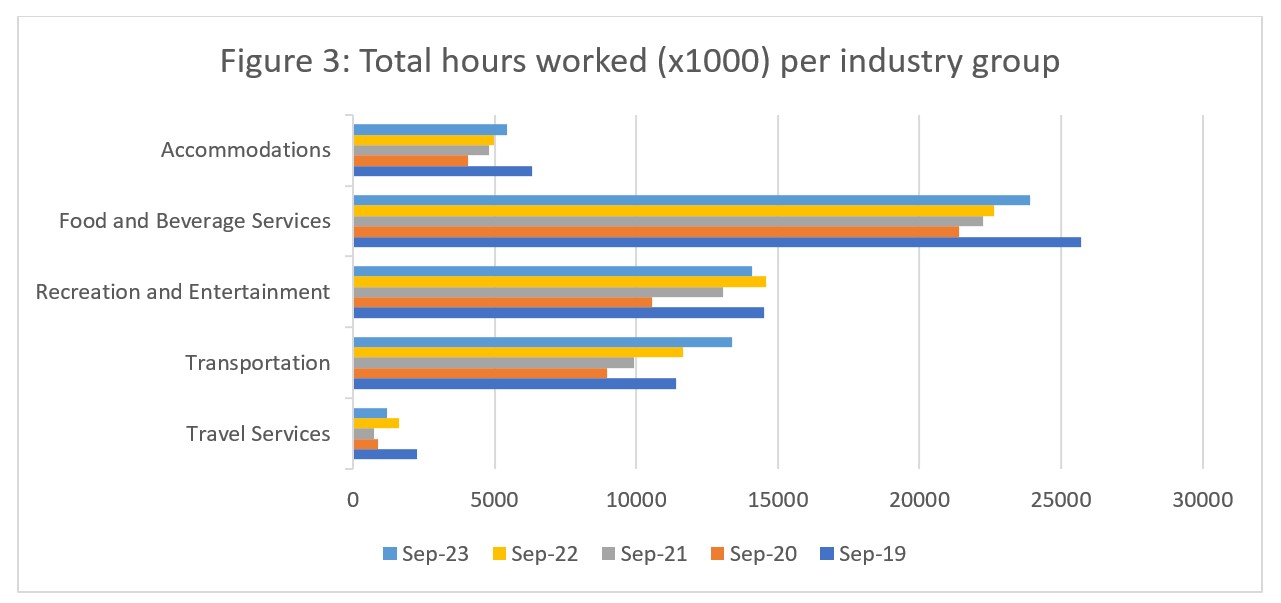
When looked at across the different industry groups that comprise tourism, most industries remained below September 2019 in terms of hours worked. Transportation alone surpassed it, and by nearly 15%, which is in line with previous observations (Table 3b) about growth in employment. Figure 3 includes year-over-year comparisons from 2019 to 2023, and shows that overall, industries have seen their work-hours grow as the sector struggles through the difficult post-pandemic recovery. However, hours worked were higher in September 2022 than in 2023 for both recreation and entertainment and travel services.
Unemployment
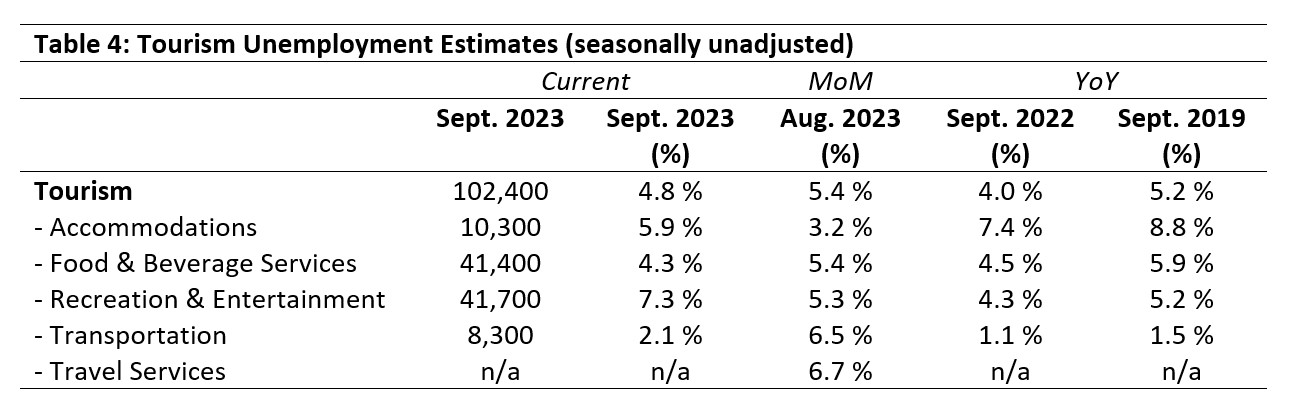
Unemployment[5] in the tourism sector in September 2023 was 4.8%, slightly lower than the national economy-wide average of 5.2% (using seasonally unadjusted data). This was lower than in August 2023 or September 2019, but higher than September 2022. Table 4 provides a summary of tourism unemployment as of September.
August 2023: Month-over-Month
Both labour force and employment fell from August, with losses in labour force being larger than those in employment, so it is not surprising to see that unemployment has fallen as well. More people left the sector than became unemployed in it. Unemployment was highest in recreation and entertainment and lowest in transportation, while the difference across the industry groups was bigger in September than it was in August. Unemployment increased in September in accommodations (+2.7%) and in recreation and entertainment (+2%), and fell in food and beverage services (-1.1%) and transportation (-4.4%). No data was available for travel services, but given the estimates for labour force and employment noted previously (Tables 2a and 3a), and the generally diminished workforce in this industry group, unemployment in travel services is likely quite low.
September 2022 and 2019: Year-on-Year
Tourism unemployment in September 2023 was not wildly out of step with either 2022 or 2019, suggesting the tourism sector labour landscape as a whole is stabilizing, albeit at lower numbers than pre-pandemic rates. The unemployment rate in accommodations was lower this September than in either of the two earlier years, while in recreation and entertainment it was higher. Food and beverage services had a lower unemployment rate than in 2019, but it was largely on par with 2022, and transportation’s rate was slightly higher but still much lower than those of the other industries.
Provincial Tourism Unemployment
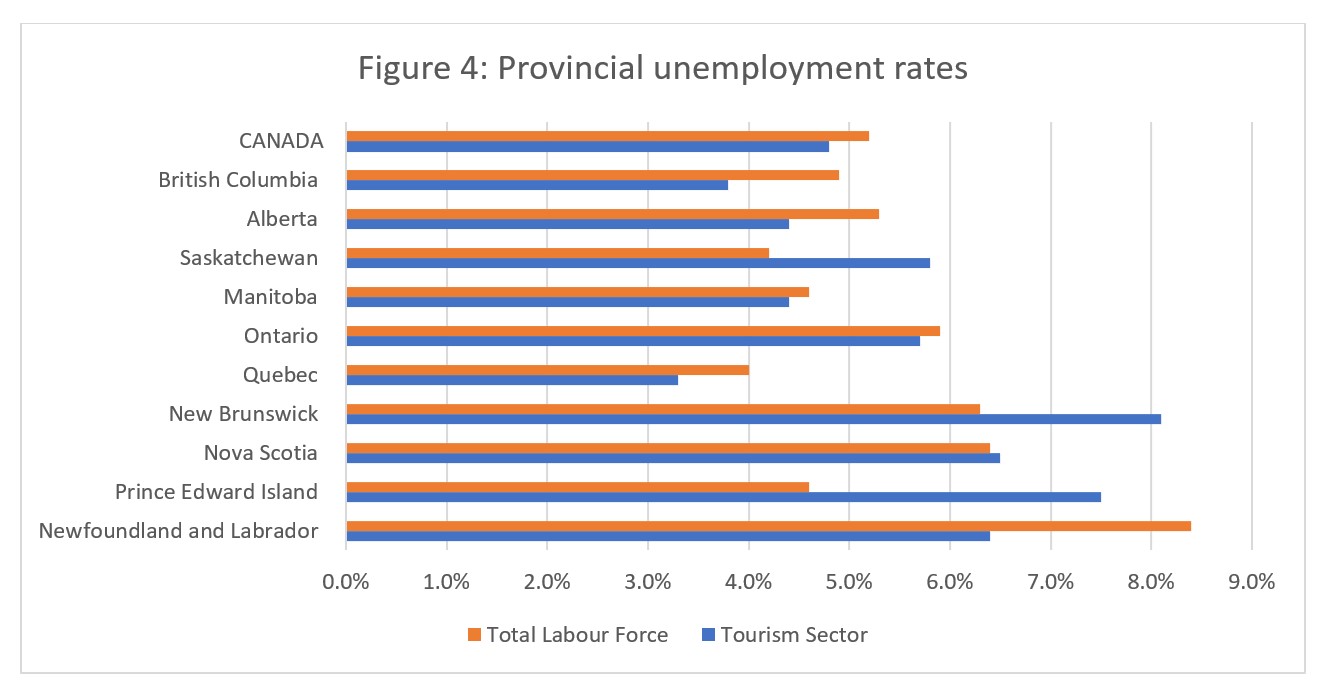
At the aggregate national level, unemployment in tourism was slightly lower than that across the broader national economy (see Figure 4), a pattern which held true for most of the provinces as well. In Saskatchewan, New Brunswick, and Prince Edward Island, tourism unemployment was substantially higher than that of the overall provincial economy. Tourism unemployment was highest in New Brunswick (8.1%) and in Prince Edward Island (7.5%), and lowest in Québec (3.3%) and British Columbia (3.8%).
View more employment charts and analysis on our Tourism Employment Tracker.
[1] As defined by the Canadian Tourism Satellite Account. The NAICS industries included in the tourism sector those that would cease to exist or would operate at a significantly reduced level of activity as a direct result of an absence of tourism.
[2] SOURCE: Statistics Canada Labour Force Survey, customized tabulations. Based on seasonally unadjusted data collected for the period of September 10 to 16, 2023.
[3] The labour force comprises the total number of individuals who reported being employed or unemployed (but actively looking for work). The total Canadian labour force includes all sectors in the Canadian economy, while the tourism labour force only considers those working in, or looking for work in, the tourism sector.
[4] Employment refers to the total number of people currently in jobs. Tourism employment is restricted to the tourism sector, while employment in Canada comprises all sectors and industries.
[5] Unemployment is calculated as the difference between the seasonally unadjusted labour force and seasonally unadjusted employment estimates. The percentage value is calculated against the labour force.