Tourism sector contracts from January, but unemployment sees a slight drop
Overall, the tourism sector[1] in February 2023 saw a small contraction from the previous month[2]. Unemployment also saw a slight drop (from 5.5% to 5.2%), which is commensurate with the tight labour market more generally, and marginally lower than in the economy more broadly (5.3%, using seasonally unadjusted data). Compared to last year, the tourism sector was much improved, with growth across all key indices, although in general the sector remained below its performance in February 2019.
At the industry group level, the profile overall is comparable to the aggregate: most groups saw a drop from January, although food and beverage services had very slight increases in both labour force and employment.
Table 1 provides a snapshot of the industry groups’ performance across labour force, employment, and unemployment, as compared with January 2023 [MoM], February 2022 [YoY], and with February 2019 as a pre-pandemic baseline. Small arrows represent changes of less than 1%.
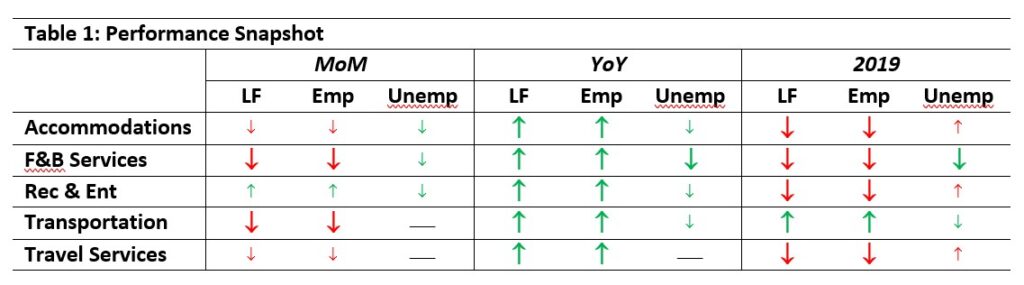
Food and beverage services alone saw any growth of labour force or employment over January, with the other industry groups shrinking—accommodations and recreation and entertainment saw drops of between 1% and 2%, while travel services took a much harder hit. All industry groups were in a stronger position than this time last year. Compared to 2019, unemployment in accommodations was lower, and recreation and entertainment was performing at around 107% of its pre-pandemic state.
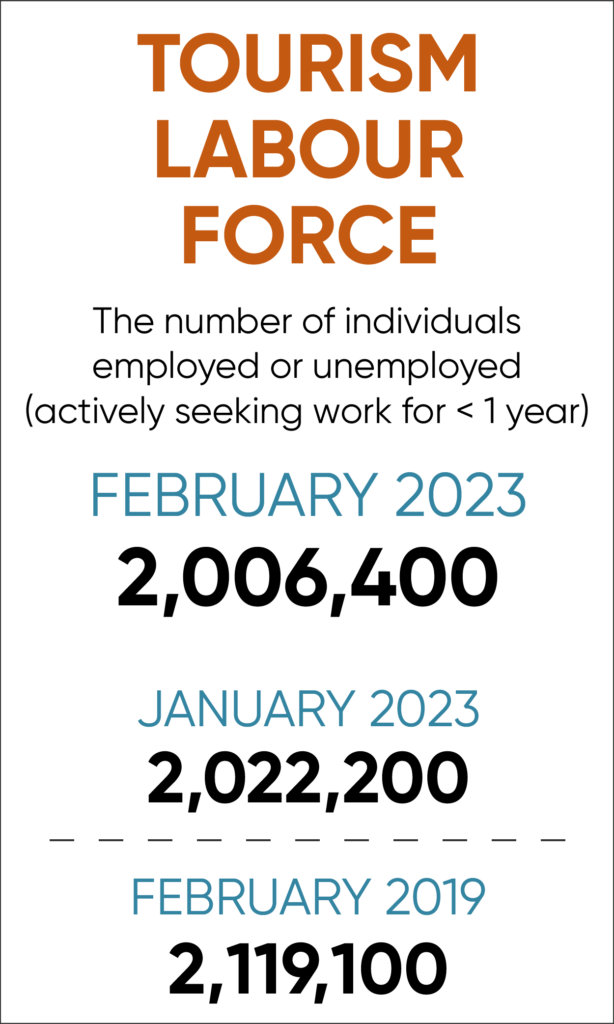
Tourism Labour Force
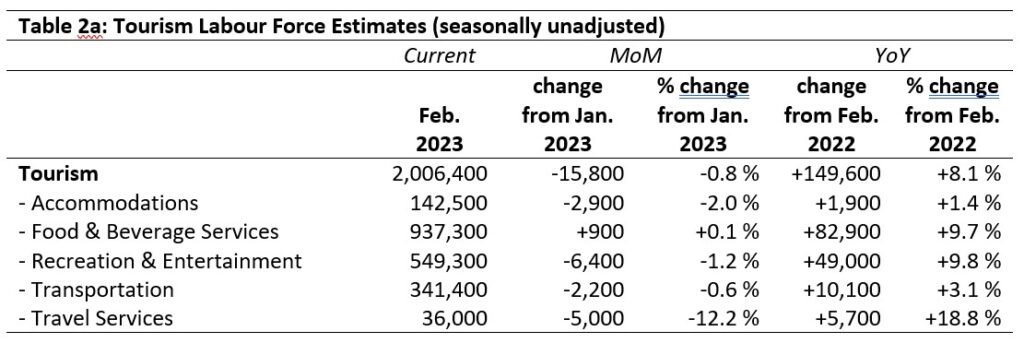
The tourism labour force[3] in February 2023 accounted for 9.6% of the total Canadian labour force, which was down marginally from 9.7% in January but up on 9.1% last year. It remained below its February 2019 share of 10.7%. Tables 2a and 2b provide a summary of the tourism labour force as of February 2023.
February: Month-over-Month
The sector as a whole lost nearly 16,000 people from the labour force, with the largest numbers disappearing from recreation and entertainment (a loss of 6,400) and travel services (a loss of 5,000). Percentage-wise, travel services (-12.2%) and accommodations (-2%) were hardest hit. Food and beverage services saw a very slight increase.
February: Year-on-Year
The situation in February 2023 was much improved on February 2022: there was an overall growth in the labour force of 8.1%, representing nearly 150,000 people. Food and beverage services and recreation and entertainment saw the largest absolute gains, together accounting for nearly 132,000 new entrants to the tourism labour market. Accommodations grew only slightly, both in absolute numbers and as a proportion of the existing labour force.
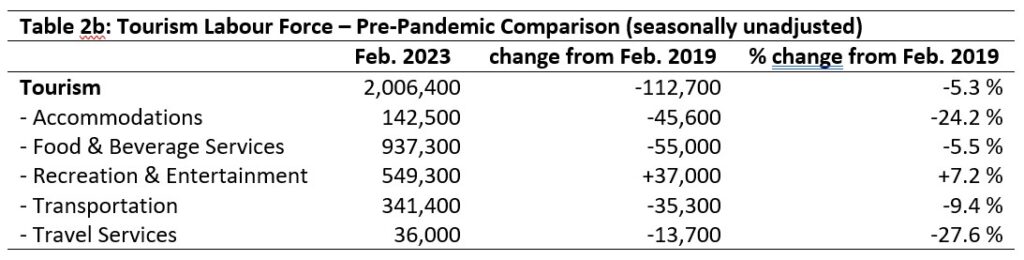
February: Pre-pandemic Baseline
The tourism labour force had returned to 94.7% of its pre-pandemic size, which still represents a drop of over 112,000 workers. Accommodations and travel services were by far the hardest hit (-24.2% and -27.6%, respectively), while recreation and entertainment saw substantial growth (+7.2%).
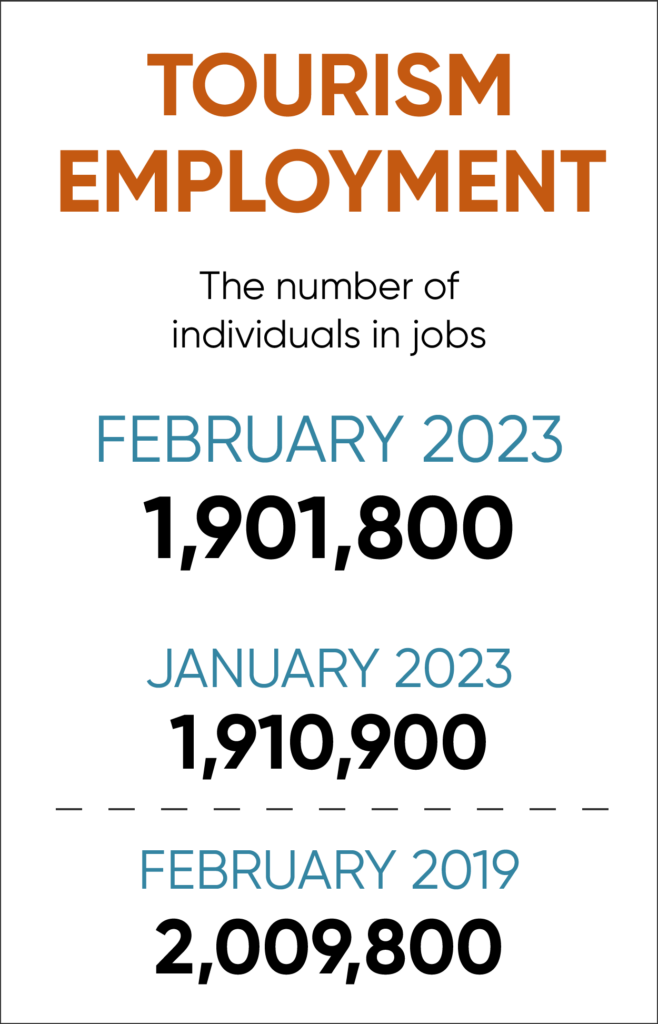
Tourism Employment
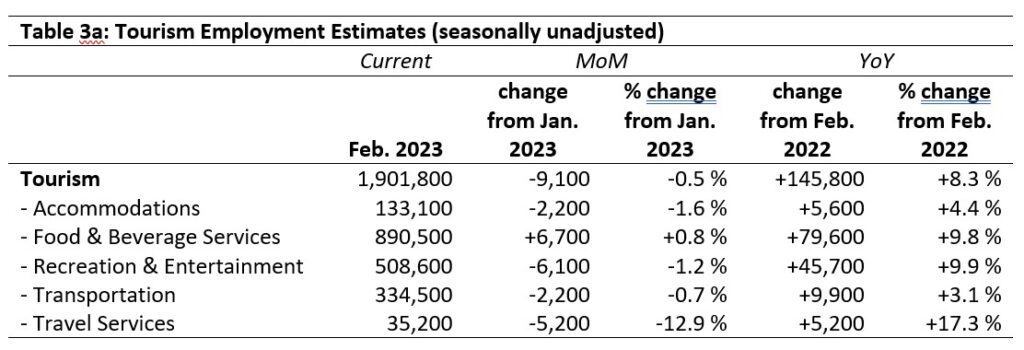
Tourism employment[4] accounted for 9.6% of all employment in Canada, which was not substantially changed from January (9.7%) but was an improvement on February 2022 (9.1%). It remained well below the rate of 10.8% in February 2019. When comparing tourism employment to the labour force across the entire economy, people working in tourism represented 9.1% of the total labour force, which was only slightly lower than in January but still well below what it was in February 2019 (10.2%). Tables 3a and 3b provide a summary of tourism employment as of February 2023.
February: Month-over-Month
With a loss of only 0.5%, employment in tourism was on the whole relatively stable since January, although there were differences at the industry group level. Food and beverage services gained 6,700 employes while recreation and entertainment lost 6,100; as these are both large groups, the percentage decrease was not substantial for either one. Travel services lost 5,200 employees, representing a drop of almost 13%, and accommodations likewise lost 2,200 employees (-1.6%).
February: Year-on-Year
As with the labour force, employment was generally improved on February 2022. The sector as a whole grew by 8.3%, and the industry groups ranged from 3.1% growth in transportation to 17.3% in travel services. Food and beverage services saw the greatest increase, followed by recreation and entertainment.
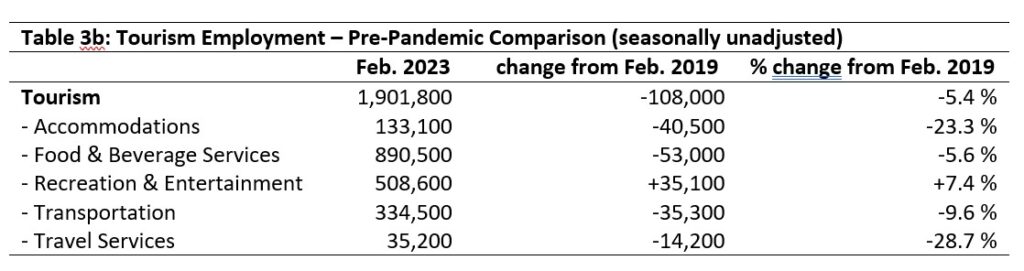
February: Pre-pandemic Baseline
Only recreation and entertainment showed an improvement over pre-pandemic employment levels, with all other industry groups (and the sector overall) showing substantial depression.
Part-time vs. Full-time Employment
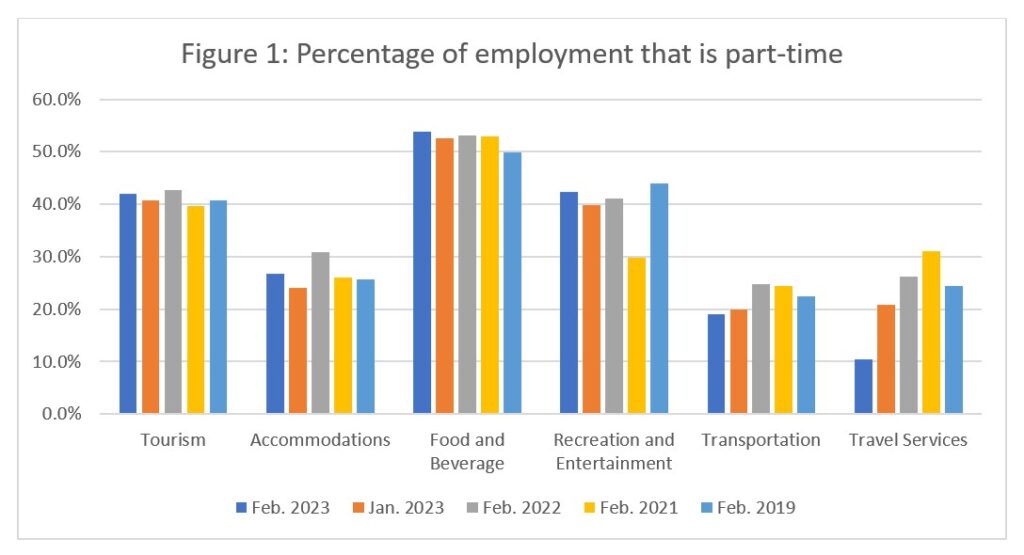
The ratio of full-time to part-time workers can provide an interesting perspective on the overall health of employment in the tourism sector: while some industries and businesses will always rely on part-time work to meet a significant portion of their staffing needs, changes over time may reflect strategies taken by businesses to retain workers through tough patches or changes in the makeup of the workforce in a given industry. Figure 1 provides an overview of the percentage of part-time employment across the industry groups.
The tourism sector stayed relatively stable, with around 40% of the workforce being part-time. At the industry-group level, however, there was some variability. Food and beverage services and recreation and entertainment tended to rely more heavily on part-time workers than had accommodations, transportation, or travel services. Recreation and entertainment saw a sharp drop in part-time workers in February 2021, which likely represented a scaling back of the overall number of employees during particularly tough times. Accommodations has seen some fluctuation, but had largely returned to pre-pandemic levels by February 2023. Transportation has seen a reduction of around 3% in part-time employment since 2019, while travel services saw a 14% decrease in the same period. Both industry groups have lost a number of workers since 2019, and as user demand continued to increase against a diminished work force, it is likely that more employees were working longer hours, tipping them over the 30 hours per week threshold used by Statistics Canada to determine full-time or part-time status.
Hours worked
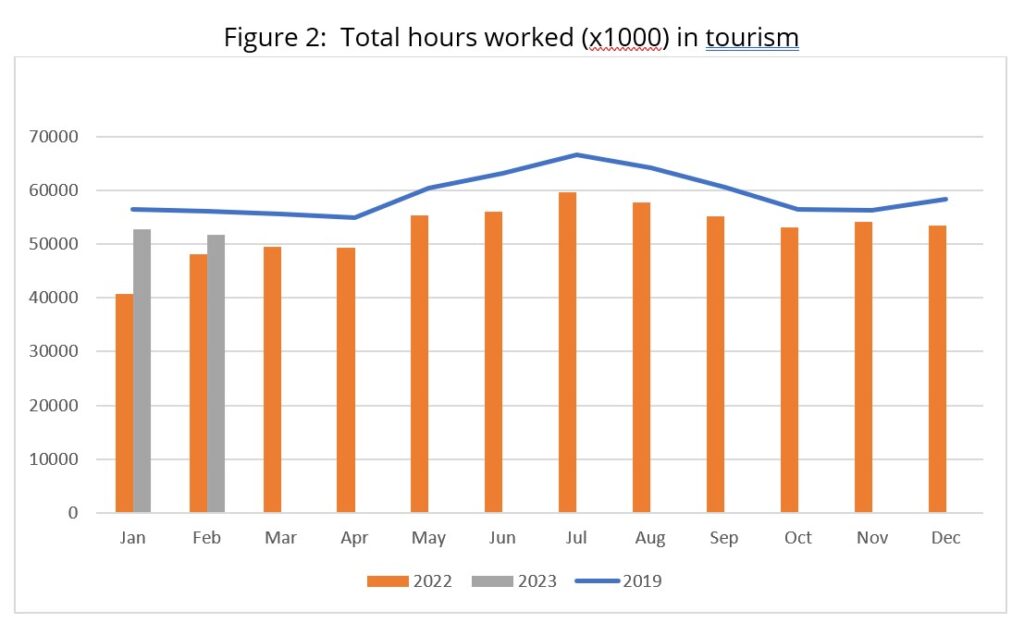
The total actual hours worked within the tourism sector is another useful metric by which to assess the health of the labour market (see Figure 2). Total hours worked for January and February 2023 continued to be below the 2019 comparison benchmark, which is unsurprising given the reduced labour force and employment figures. So far, 2023 has paralleled the pre-pandemic numbers, so it will be interesting to see over the next few months if that continues, or if the gap narrows further between 2023 and 2019.
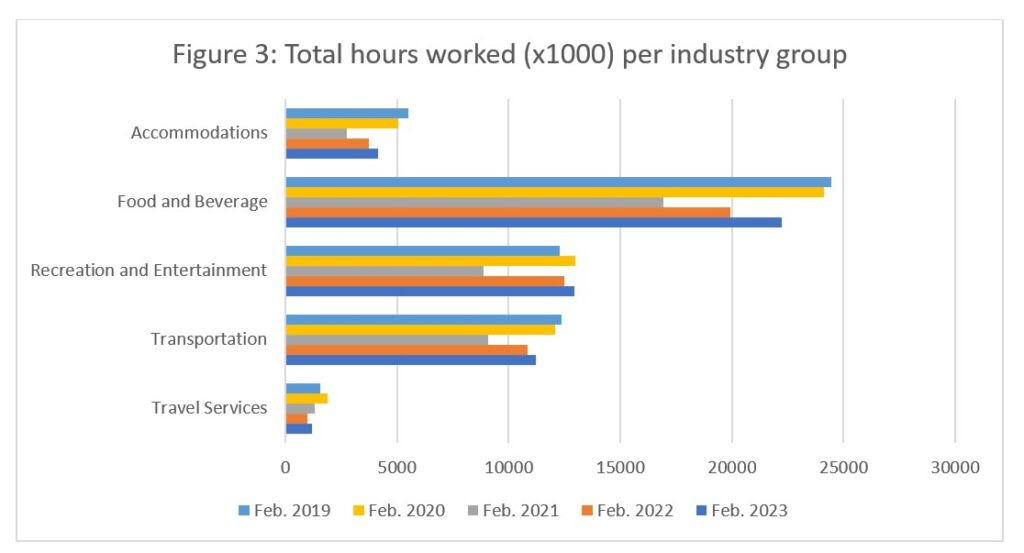
When looking at total hours worked across the different industry groups across different years (Figure 3), we see a sharp drop from 2020 to 2021, and then a generally consistent increase year on year. Travel services had been shrinking until 2023, when it began to rebound. As with the sector-level trends, it will be interesting to see if travel services is able to return to previous levels against a backdrop of changing demand and a reduced workforce.
Unemployment
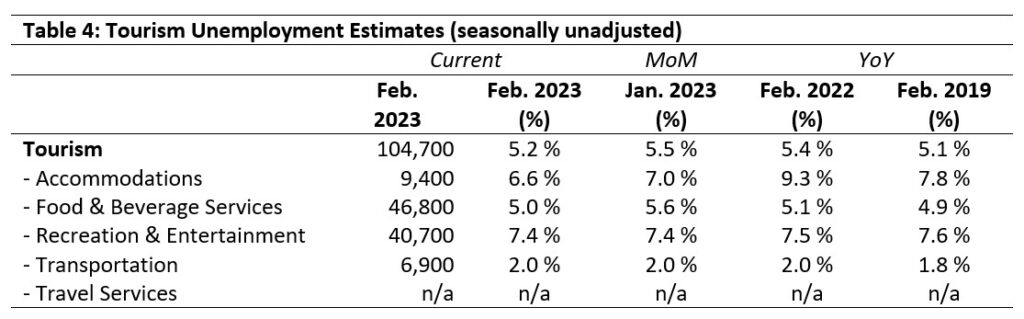
Unemployment[5] in the tourism sector in February was 5.2%, marginally lower than the national economy-wide rate of 5.3% (using seasonally unadjusted data), and slightly lower than in tourism in January 2023. Table 4 provides a summary of tourism unemployment as of February 2023.
Table 4 provides a summary of tourism unemployment in January 2023. Unemployment data for travel services was unavailable for January 2023.
February: Month-over-Month
Unemployment has not changed much since January: recreation and entertainment and transportation were static, and accommodations and food and beverage services saw slight drops. These likely reflect both the increased demand for workers in these sectors, as well as the shrinking labour force—that is to say, there were fewer people available to fill vacant positions, so unemployment figures were pulled lower because they were calculated against a smaller denominator (i.e., the labour force).
February: Year-on-Year
At the sector level, unemployment has been relatively stable over successive pandemic-era Februaries, fluctuating between 5.1% and 5.5%, and although there has been some variability in the industry groups individually, the general proportions have not changed substantially. Accommodations has seen the largest fluctuations, rising to 9.3% in 2022 and falling back to 6.6.% in 2023.
Provincial Tourism Unemployment
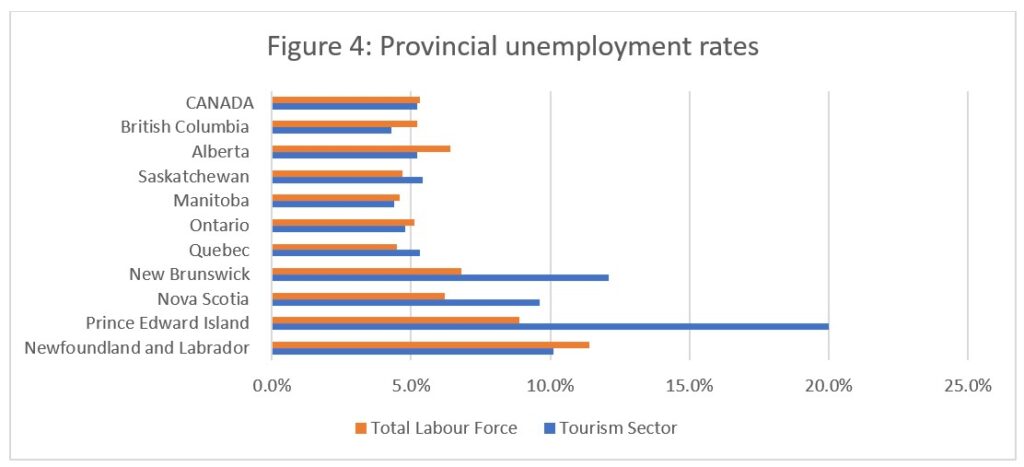
At the aggregate national level, unemployment in tourism was slightly lower than across the wider economy (5.2% vs. 5.3%—see Figure 4). For the non-Atlantic provinces, this was broadly comparable with provincial rates. Alberta’s total unemployment rate was higher than the national average, while in Saskatchewan and Quebec, tourism unemployment was higher than that of the general provincial economy. Unemployment generally remained higher in the Atlantic provinces than elsewhere in the country, with tourism unemployment far outstripping the economy-wide rates in New Brunswick, Nova Scotia, and Prince Edward Island. Provincial tourism unemployment was overall highest in Prince Edward Island (20%) and New Brunswick (12.1%), and lowest in British Columbia (4.3%) and Manitoba (4.4%).
Immigrant Status of the Tourism Labour Force
Immigration is currently a very timely topic in the labour market, especially for the tourism sector as business operators may be struggling to meet their staffing needs in anticipation of summer 2023. With recent temporary changes announced to various immigration programs, intended to help address this short-term need, there is a renewed interest in temporary immigration programs, such as the Temporary Foreign Worker (TFW) Program and the International Mobility Program (IMP), to name two.
The labour force survey from Statistics Canada provides some limited information about respondent demographics, including age, sex, and immigrant status. In particular, it includes estimates for two groups of people by immigrant status:
- Landed Immigrants = non-Canadian citizens with permanent leave to remain and work in Canada
- Canadian citizens born in Canada
However, the sum of these two categories does not equal the total population estimates for the survey—there is an arithmetically-recoverable “other” category, which is not formally reported because it does not constitute a coherent group in any meaningful sense:
- Other = naturalized Canadians, Canadian citizens born outside of Canada, refugees and displaced persons in Canada, and anyone else with the legal right to work in Canada who is neither Canadian citizen nor Landed Immigrant (i.e., those with temporary work permits)
Because of how this data is collected and reported, it is not possible to separate out the different categories of immigrant status within this “other” category—it is impossible, for example, to estimate numbers of TFWs or IMPs within this broad grouping. Nevertheless, even at this very granular level, it can be useful to have an estimate of labour force and employment rates by immigrant status within the tourism sector.
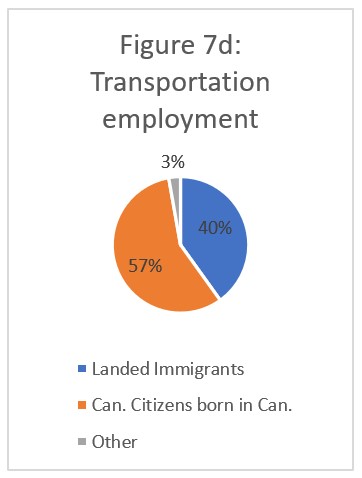
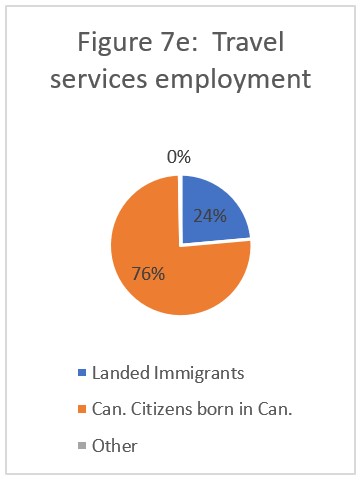
The values given here are ceiling estimates only: the “other” category represents an estimate of the maximum number of temporary workers in a given context, not an estimate of the actual number of such workers. Figures 5, 6, and 7 present a snapshot of these estimates from the month of February 2023.
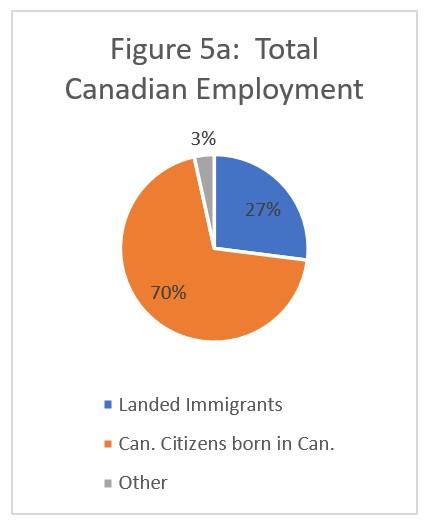
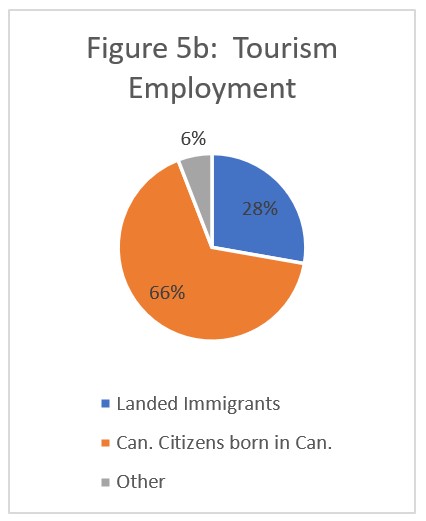
Comparing employment across the entire Canadian economy (Figure 5a) with that of the tourism sector (Figure 5b), we see that the proportions were very similar, although tourism included a slightly higher percentage of people classed as “other” (6% vs 3%). Landed immigrants (corresponding approximately to ‘new Canadians’) constituted slightly less than a third of the workforce in tourism as well as in the broader economy.
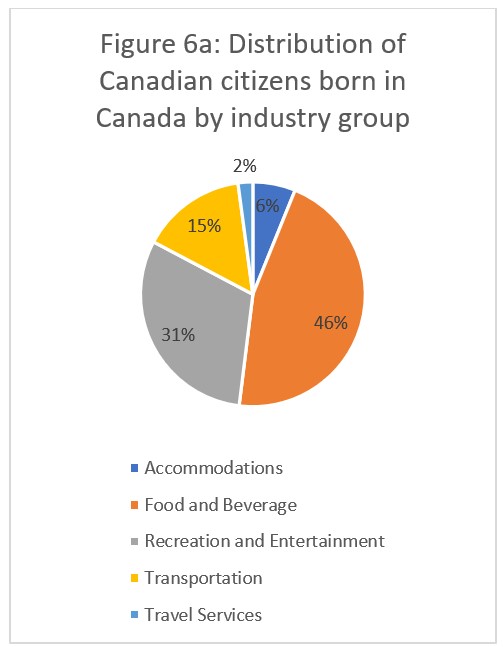
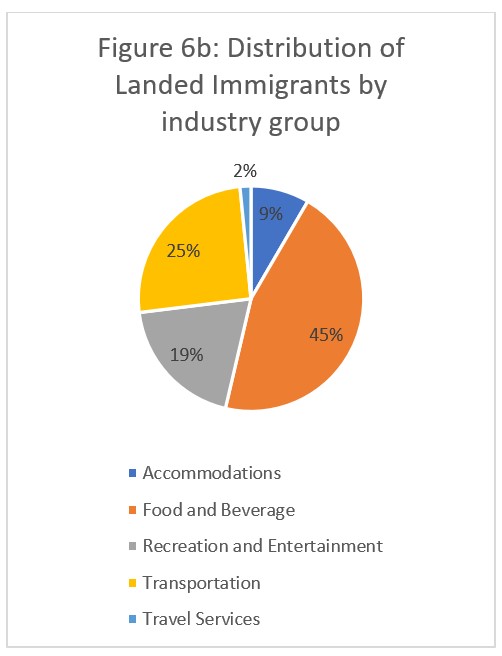
Figures 6a-c show the share of workers in the each of the immigrant categories that worked in the various industry groups that make up tourism. The distributional profile of Canadian citizens born in Canada (CCBCs) and Landed Immigrants were quite similar, although more CCBCs worked in recreation and entertainment (31%) and more Landed Immigrants work in transportation (25%). For both of these groups, food and beverage services employes the largest percentage of workers, but not the majority.
In contrast, workers in the “other” category were overwhelmingly employed in food and beverage services (66%), with the next largest employer industry being recreation and entertainment, at only 16%. This may reflect both the location of food and beverage service jobs (often in cities or other urban centres), and the relative ease of entry into many of these occupations. What is more striking than the specifics of the distribution of “other” workers (6c) is the difference in distribution for these workers than for CCBCs (6a) and Landed Immigrants (6b).
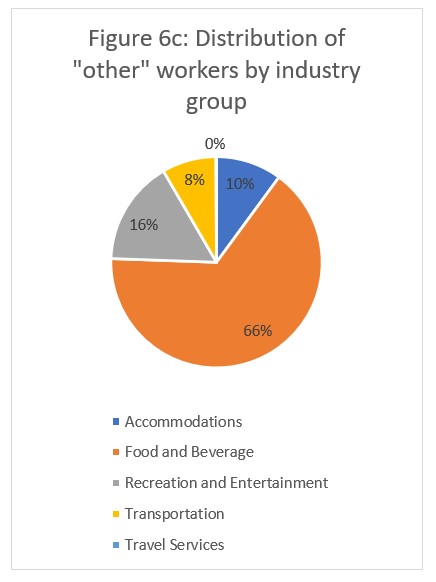
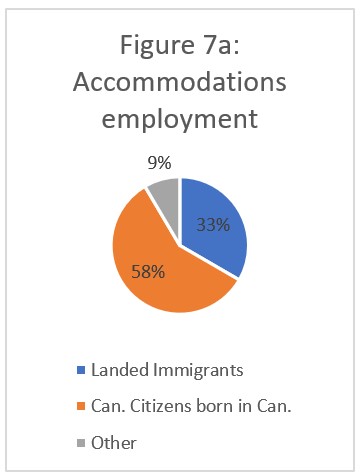
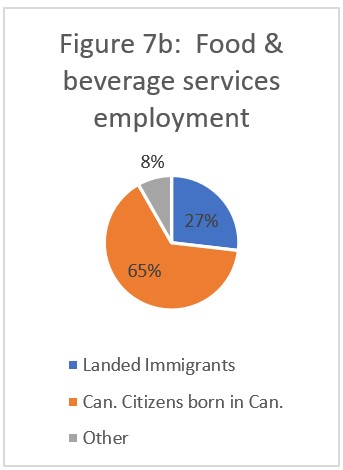
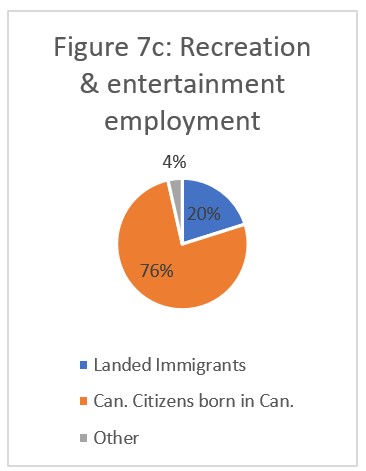
When we consider the distribution across the five main industry groups that make up tourism (Figures 7a through 7e), we find that, in February 2023, the industry groups with the highest number of people classed as “other” were accommodations (9%) and food and beverage services (8%). In contrast, travel services employed no one in that category, which may reflect both the small numbers of people working in that industry overall, and the training and qualifications needed for entry into travel services occupations (a college degree is often required), making them less accessible to some of the more vulnerable people who fall into this category. It is also interesting to note that Landed Immigrants were most represented in transportation and accommodations (making up 40% and 33% and of the respective workforces), while CCBC were most represented in recreation and entertainment and travel services (76% for both).
Interestingly, when we cross-compare the two different perspectives of the data—the distribution of “other” workers by industry group, and the immigrant status makeup of industry-level workforces—some interesting trends emerge. Although 66% of “other” workers are employed in food and beverage services, these workers only constitute 8% of the food and beverage workforce. In contrast, only 10% of “other” workers are employed in accommodations, but they make up 9% of the overall accommodations workforce. This is partly a reflection of the different scales of the two industries, but it also aligns with previous findings in labour market research (particularly perception studies of the tourism sector as a place of employment), suggesting that this rough approximation is not wildly out of step with reality.
The data being discussed here is not detailed enough to state with certainty what the employment situation is for particular profiles of non-permanent residents, but neither was it collected or compiled to support such a claim. The “other” category is a catch-all that has no inherent internal coherence. Nevertheless, certain observations possible with this data suggest that even this very coarse-grained classification of workers provides useful insight into the demographic makeup of the workforce.
More detailed data collection is needed to confirm this, but very few of the points noted in this brief analysis are likely to seem markedly out of touch with the actual labour situation in the sector. This is not a measure of immigration, but it is likely not far off from what such a measure would show.
View more employment charts and analysis on our Tourism Employment Tracker.
[1] As defined by the Canadian Tourism Satellite Account. The NAICS industries included in the tourism sector those that would cease to exist or would operate at a significantly reduced level of activity as a direct result of an absence of tourism.
[2] SOURCE: Statistics Canada Labour Force Survey, customized tabulations. Based on seasonally unadjusted data collected for the period of February 12 to 18, 2023.
[3] The labour force comprises the total number of individuals who reported being employed or unemployed (but actively looking for work). The total Canadian labour force includes all sectors in the Canadian economy, while the tourism labour force only considers those working in, or looking for work in, the tourism sector.
[4] Employment refers to the total number of people currently in jobs. Tourism employment is restricted to the tourism sector, while employment in Canada comprises all sectors and industries.
[5] Unemployment is calculated as the difference between the seasonally unadjusted labour force and seasonally unadjusted employment estimates. The percentage value is calculated against the labour force.