Accommodations and transportation lead sector to higher ground, but travel services takes a hit
Overall, the tourism sector[1] in April saw moderate improvement over the previous month[2], with employment up 1.1%. The sector was in a stronger position than it was last year in terms of labour force and employment, although unemployment was also slightly higher. The sector remained below its pre-pandemic baseline of April 2019.
At the industry group level, the profile is more mixed. Table 1 provides a snapshot of each industry group’s performance across labour force, employment, and unemployment, as compared with March 2023 [MoM], April 2022 [YoY], and April 2019 as a pre-pandemic baseline. Small arrows represent changes of less than 1%.
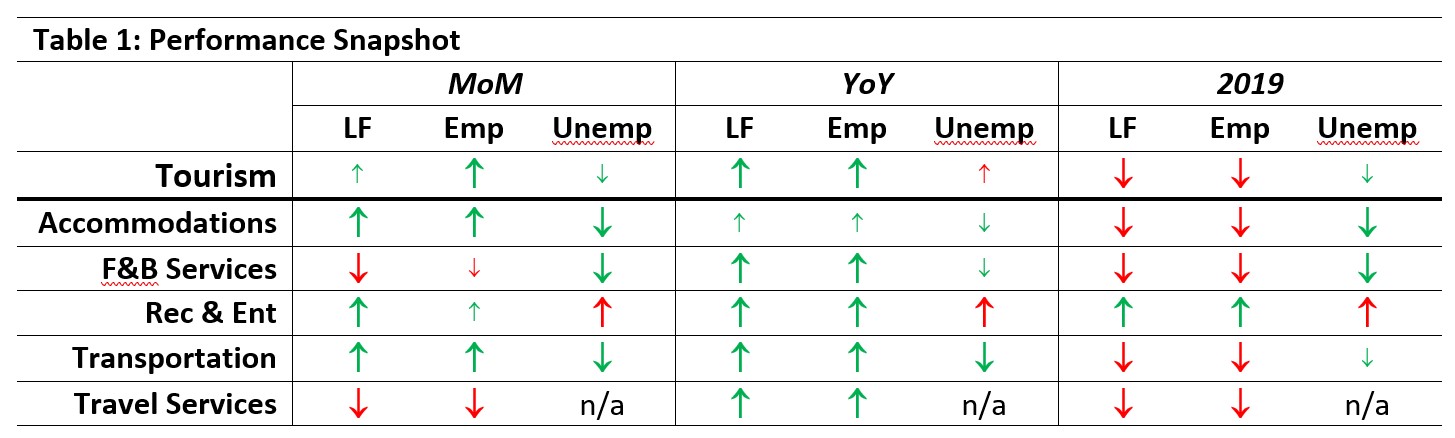
Accommodations and transportation showed the strongest general performance relative to last month, with growth in both labour force and employment coupled with a drop in unemployment. In contrast, travel services saw substantial drops in both labour force and employment, with food and beverage services doing only marginally better. Recreation and entertainment saw an increase in unemployment, alongside a comparable increase in the labour force.
Compared to April 2022, all industry groups saw improvement across labour force and employment numbers. All industry groups other than recreation and entertainment were below their figures from 2019, with recreation and entertainment showing higher labour force, employment, and unemployment relative to the pre-pandemic baseline. Travel services fared particularly badly relative to 2019, with labour force only at 65.5% of 2019 levels and employment 65.6%.
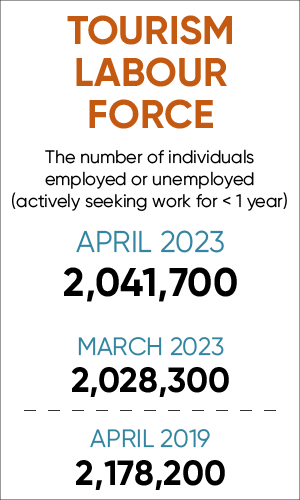
Tourism Labour Force
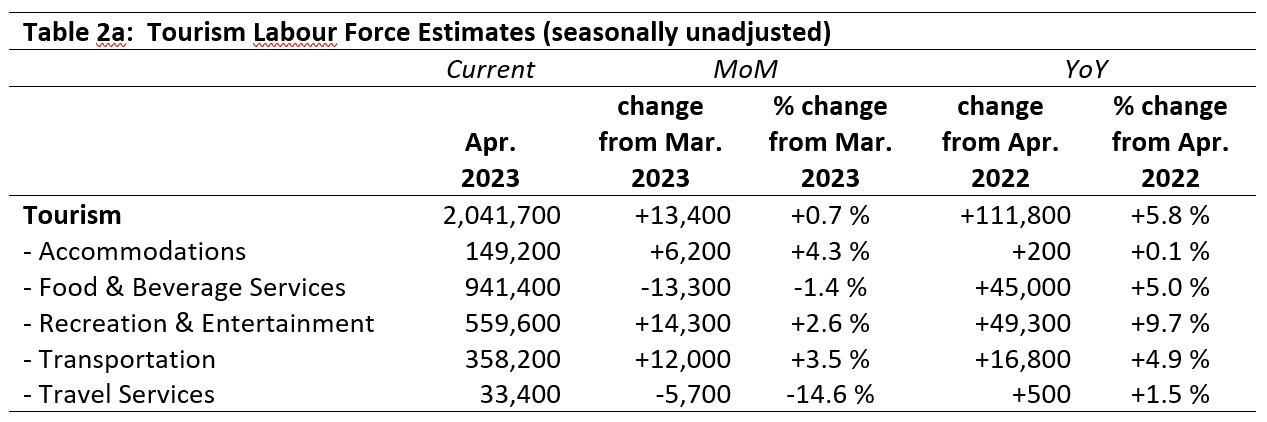
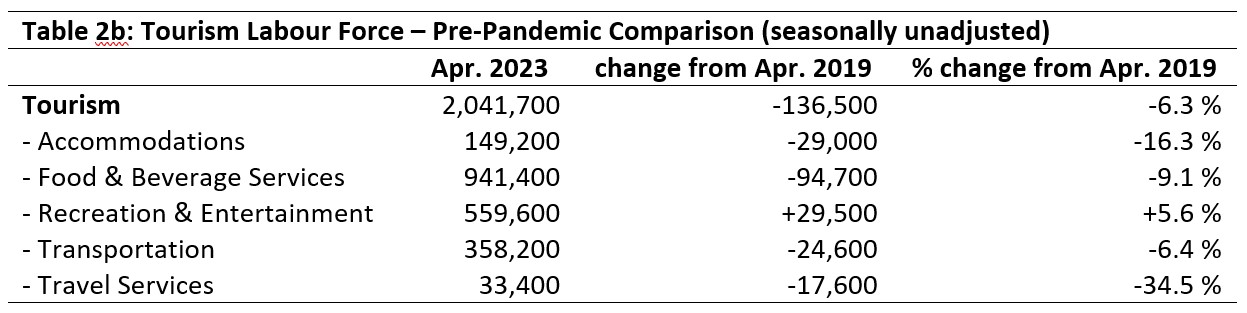
The tourism labour force[3] in April accounted for 9.7% of the total Canadian labour force, unchanged from March but below the pre-pandemic share of 10.8% in April 2019. However, it has grown from 9.4% in April 2022, and 8.4% in April 2021, so the sector is continuing to regain ground, year on year. Tables 2a and 2b provide a summary of the tourism labour force as of April 2023.
April: Month-over-Month
The tourism sector as a whole gained just over 13,000 people since March (+0.7%), but this modest increase masks some larger fluctuations across the industry groups. Travel services lost 14.6% of its labour force, and food and beverage services also saw a modest contraction. In contrast, accommodations gained 4.3% (adding 6,200 people to its labour force), with transportation (+3.5%) and recreation and entertainment (+2.6%) not far behind. The growth in accommodations is good news for an industry that has been struggling for the past several months, but the sharp decline in travel services is a worrying development as the sector begins the build-up into the peak of the summer season.
April: Year-on-Year
Compared to last year, the tourism labour force was in a much stronger position, having gained over 111,000 people (an increase of 5.8%). This trend of growth was constant across the industry groups, with all industries showing at least modest growth. Accommodations had the lowest gains, essentially remaining unchanged (+0.1%), while recreation and entertainment had the strongest growth, both in absolute terms (+49,300 people) and in relative terms (+9.7%). These changes likely reflect the gradual return to normal social and travel habits, or at least stabilizing at a new normal.
April: Pre-pandemic Baseline
The sector overall, and all industry groups except recreation and entertainment, remained below pre-pandemic levels. Travel services and accommodations were the most depressed relative to April 2019 in relative terms (-34.5% and -16.3%, respectively), although in absolute terms, food and beverage services—being a substantially larger share of the sector overall—saw the largest losses, with a shortfall just shy of 95,000 people. The labour force in recreation and entertainment was at 105.6% of its 2019 size.
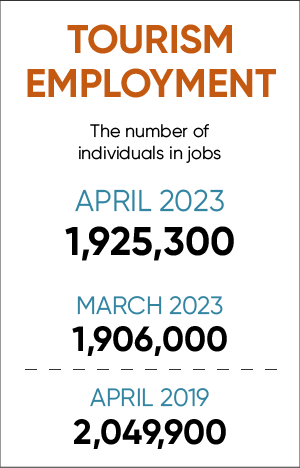
Tourism Employment
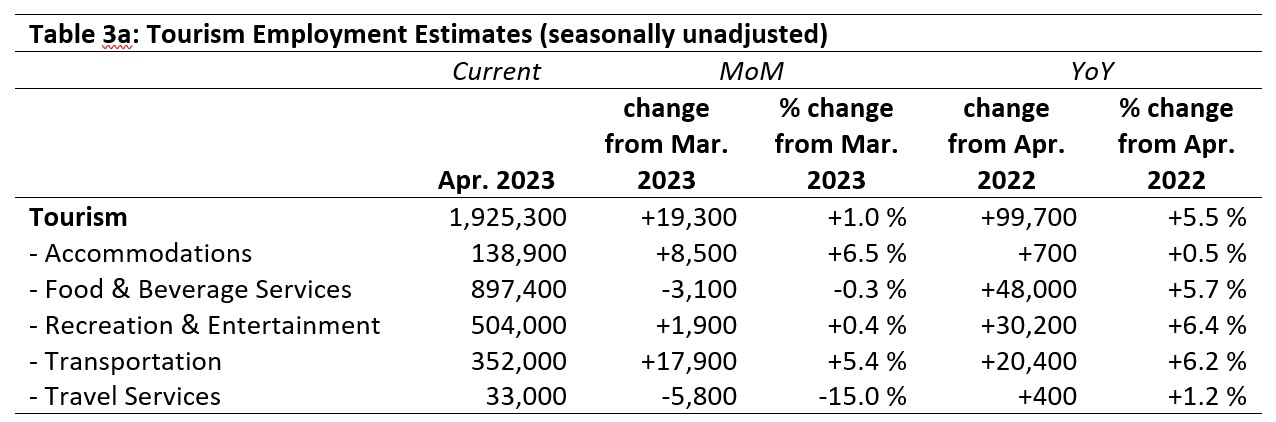
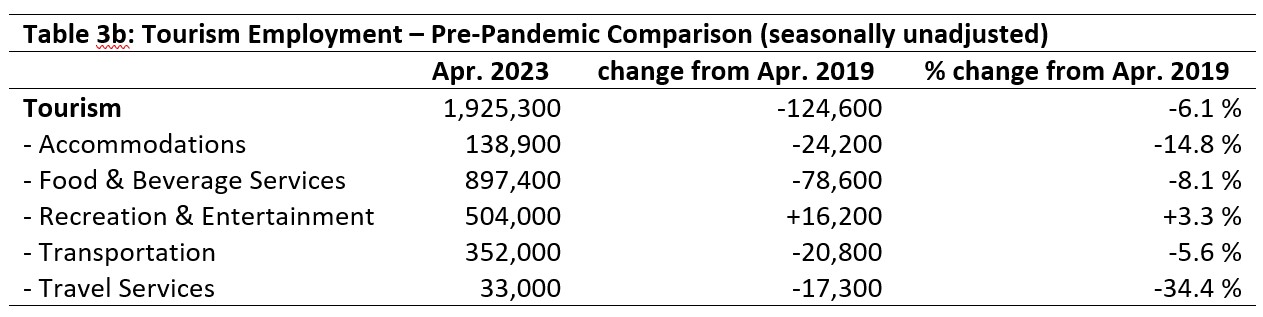
Tourism employment[4] accounted for 9.7% of all employment in Canada in April and employed 9.2% of the available labour force across the country. Both figures are comparable to what was seen in March (9.6% of all employment, 9.1% of the Canadian labour force), and are an improvement over last year, but the sector is still below its April 2019 share. Tables 3a and 3b provide a summary of tourism employment as of April 2023.
April: Month-over-Month
As with the labour force, the overall employment gains at the sector level (+1.0%) masked volatility at the industry group level. Accommodations showed a substantial increase (+6.5%, accounting for 8,500 new workers) as did transportation (+5.4%, 17,900), while travel services saw a drop of 15% (a loss of 5,800 workers). Recreation and entertainment and food and beverage services saw only modest employment changes.
April: Year-on-Year
Employment in April 2023 was much stronger than in April 2022, with a gain of almost 100,000 workers. Accommodations and travel services had the smallest increases (0.5% and 1.2%, respectively), while the other industries showed substantial gains.
April: Pre-pandemic Baseline
At the aggregate level, employment in the tourism sector was still 6.1% below where it was in April 2019. Accommodations and travel services were the most depressed industries, although all groups were below pre-pandemic levels—except for recreation and entertainment, which was operating at 103.3% of its 2019 employment levels.
Part-time vs. Full-time Employment
The tourism sector employs a range of work types, from full-time through part-time to casual or gig employment. While data is not available that captures gig work as a distinct type of engagement, we can look at part-time vs. full-time to get a sense of the general distribution of employment. Figure 1 provides an overview of the percentage of part-time employment across the sector and its industry groups.
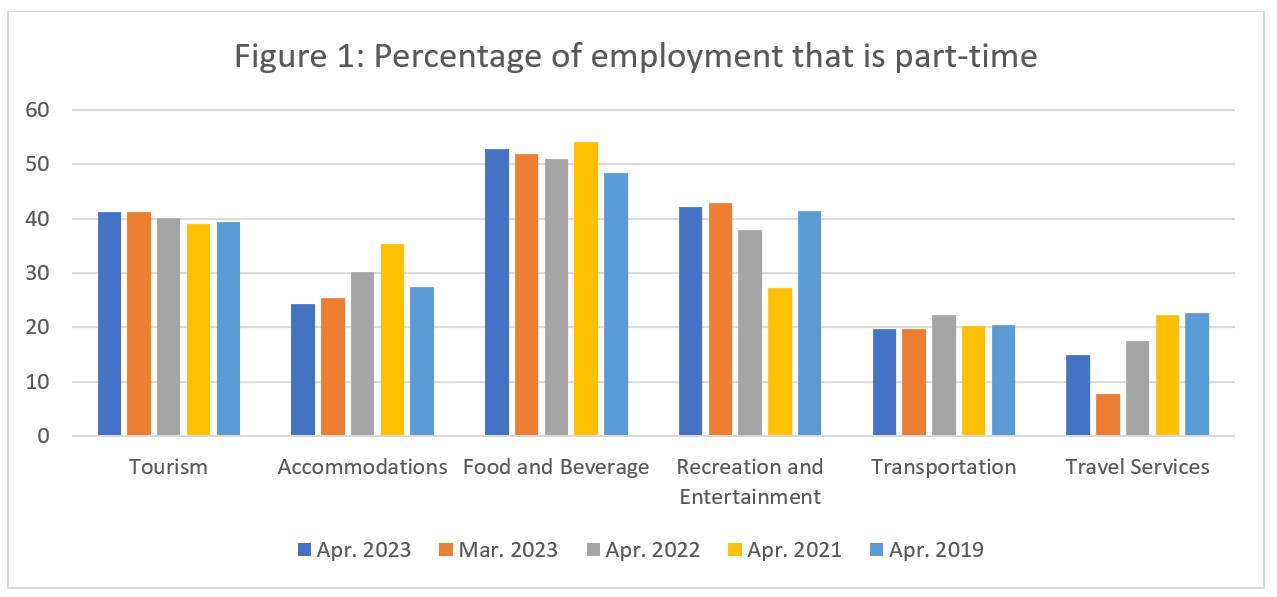
On the whole, the sector has seen a slight increase since 2019 in part-time employment, although it has remained steady at around 40% across successive Aprils. Different industries have had different trajectories: transportation has been relatively stable at around 20%, while food and beverage services and recreation and entertainment have seen some fluctuations over the past few years, with slight gains in part-time employment relative to full-time employment. However, these two industry groups have generally tended towards high rates of part-time employment anyway, with food and beverage services usually around 50% and recreation and entertainment around 40% (with a marked drop in April 2021, which is unsurprising given the social conditions and pandemic restrictions at the time). Accommodations and travel services have both seen a decrease in the ratio of part-time workers since 2019, but with different shifts over time. Part-time employment in accommodations spiked to over 30% in April 2021, and has been falling since: there was a slight drop from March to April this year, settling at 24%. In contrast, the part-time participation in travel services has been falling since 2019, hitting a local low in March 2023 of 7.7%, but climbing back to a more typical value of 14.8%. Although this remains below historical levels, the shifts noted in the labour force and employment data suggest broader challenges in travel services, so the current state of part-time work in this industry may not be a reliable indicator of the workforce in a general sense.
Hours worked
The total actual hours worked within the tourism sector is another useful metric by which to assess the health of the labour market (see Figure 2). The hours worked in April 2023 continued the trend of paralleling but staying below 2019 levels. There was a slight increase (+1.1%) from March, and to date 2023 has remained consistently higher than 2022. As the sector heads into summer, it will be interesting to track how the total hours worked reflects shifting operational practices if businesses are forced to work with fewer staff overall.
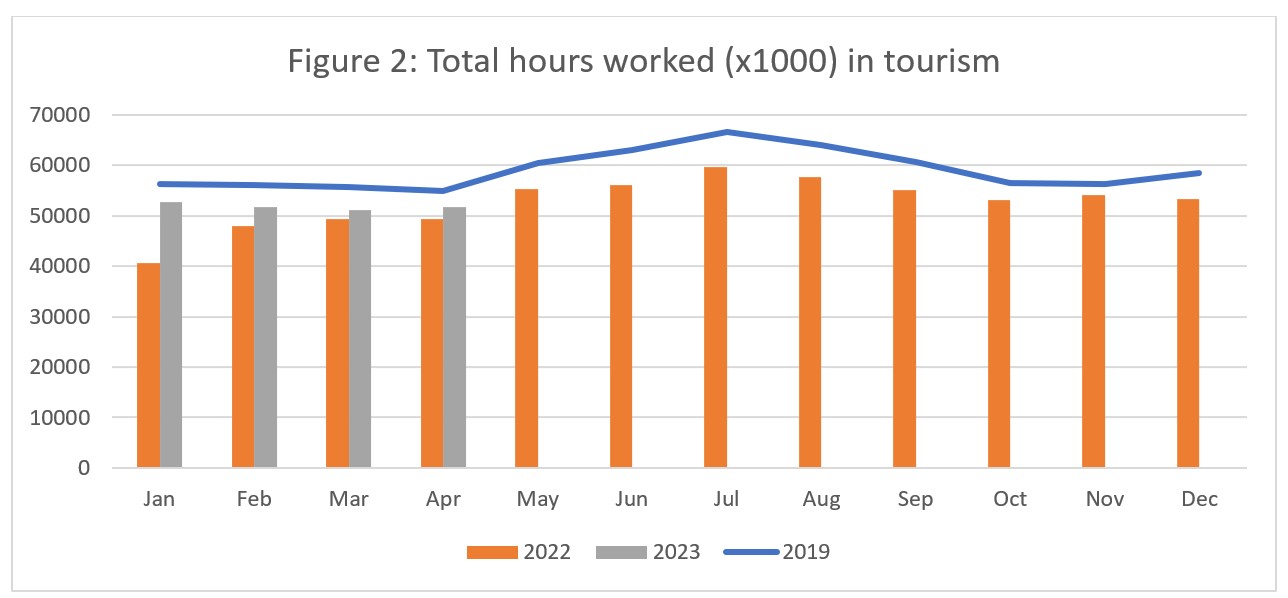
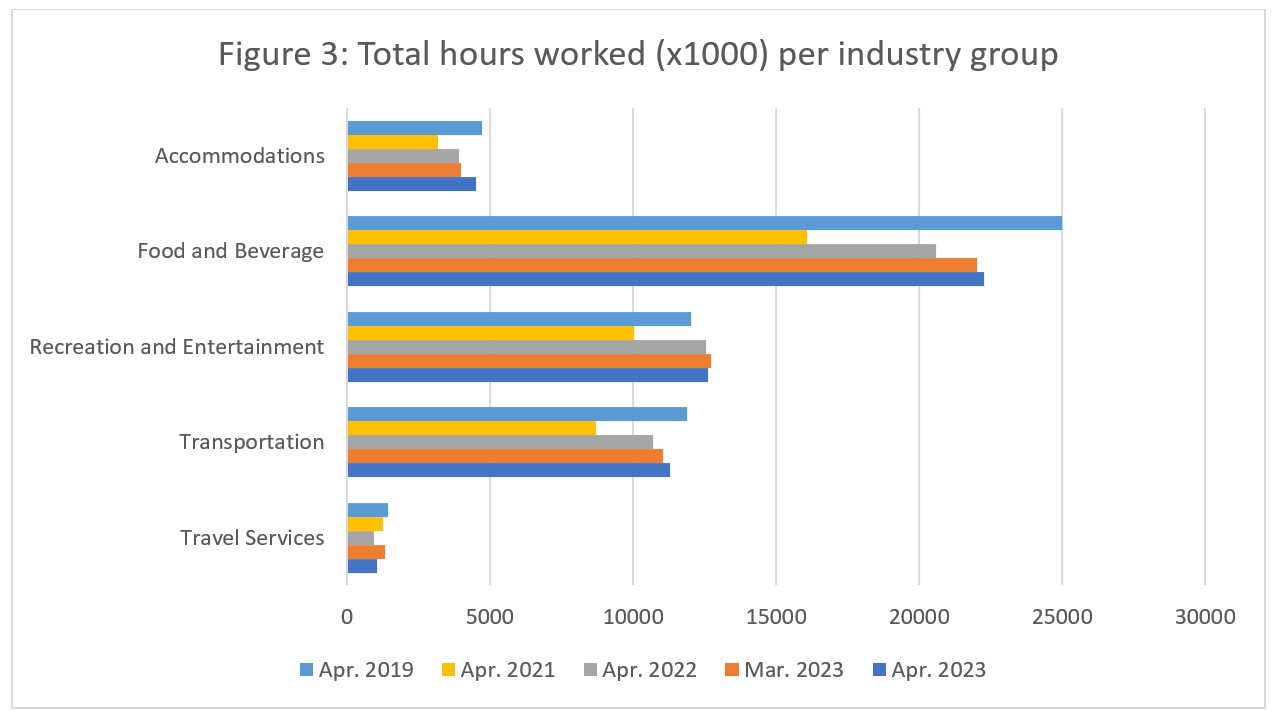
The general sector trends seen in Figure 2 were consistent with industry-level patterns (Figure 3), particularly when taken into consideration alongside the employment data previously discussed. Recreation and entertainment alone surpassed April 2019 in terms of total hours worked, in line with the higher employment and labour force numbers. Month-on-month, accommodations, food and beverage services, and transportation also saw an increase in hours worked, while recreation and entertainment and travel services saw a drop from March 2023. Accommodations had the largest relative monthly increase (+12.6%), which correlates with the industry’s recent growth in both labour force and employment.
Unemployment
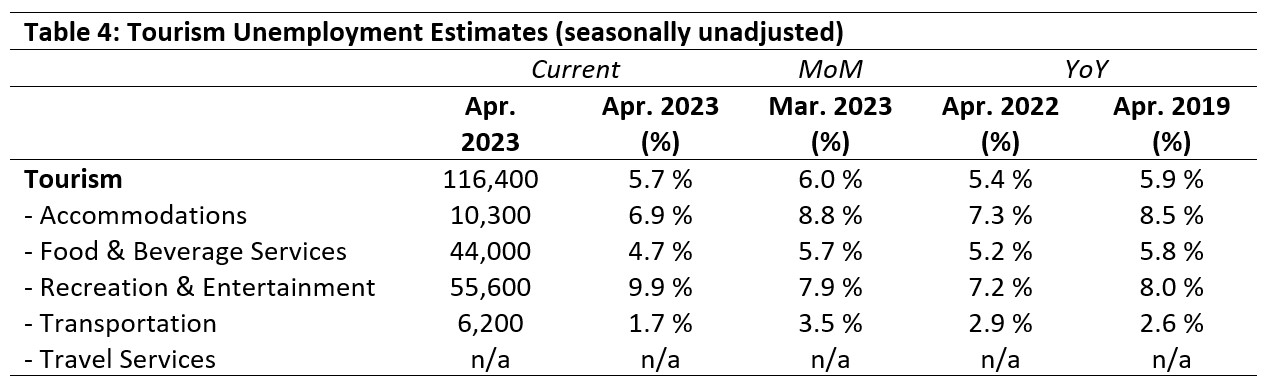
Unemployment[5] in the tourism sector in April was 5.7%, half a percentage point above the national economy-wide average (5.2%, using seasonally unadjusted data) and slightly lower than the sector’s rate in March 2023 (-0.3%). Table 4 provides a summary of tourism unemployment in April 2023.
April: Month-over-Month
Unemployment in the tourism industries decreased for the most part, with accommodations showing the largest drop since March (-1.9%), followed by transportation (-1.7%). Recreation and entertainment saw an increase of 2% over the same time period. Unfortunately, data was not available for travel services, but we can assume a very low rate based on survey estimates for labour force and employment. Given the month-over-month staffing losses in travel services, it is unsurprising to find low unemployment, although the accompanying fall in hours worked suggests that the industry group was experiencing a contraction in April—whether it is a short-lived dip or long-term concern remains to be seen.
April: Year-on-Year
Unemployment in the sector as a whole was higher than it was in April 2022, which is unsurprising given the increase in the labour force over the same period. At the industry level, however, it was only recreation and entertainment that saw an increase in unemployment (+2.5%), while it decreased across all other industry groups. This parallels the patterns with respect to April 2019, where recreation and entertainment was also the only industry group to have higher unemployment. Lower unemployment, of course, is a double-edged sword: on the one hand, low unemployment figures show that the sector is making good use of the resources available; on the other, it means there is a very limited supply of workers who are ready to engage with the sector. As unemployment levels remain low in tourism, businesses will need to work with fewer workers and also attract workers from outside the sector.
Provincial Tourism Unemployment
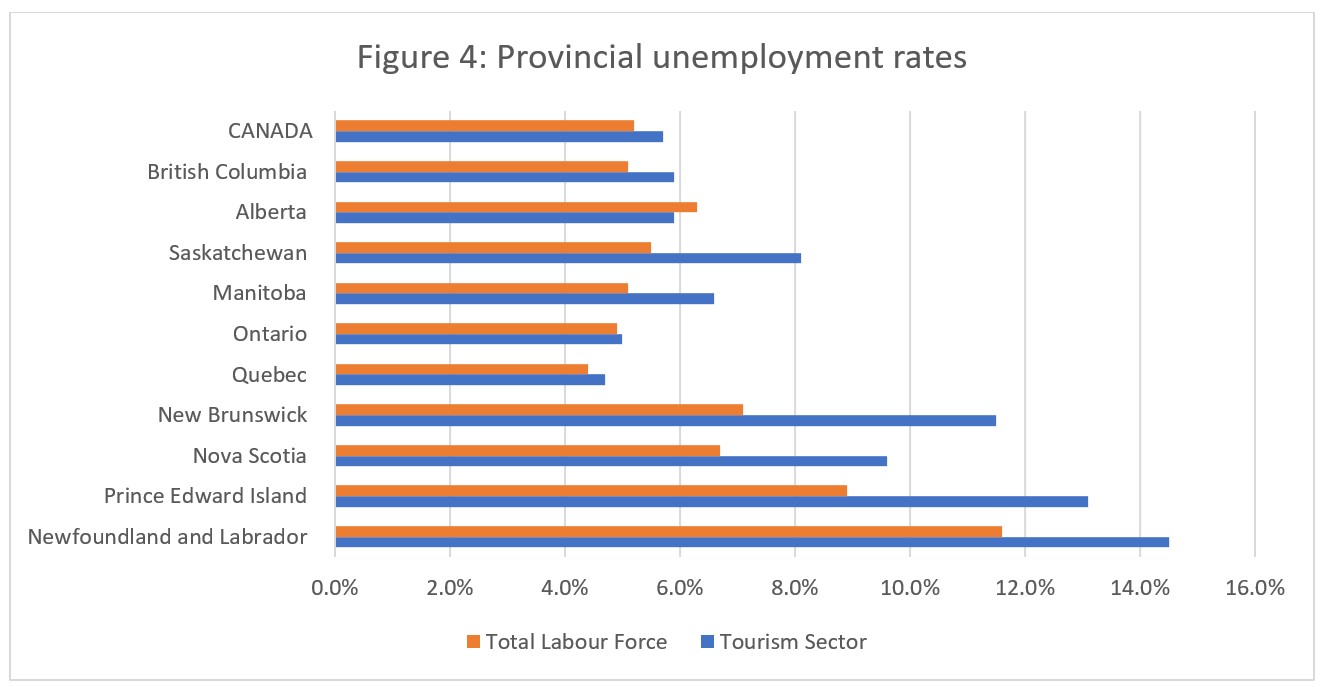
At the aggregate national level, unemployment in tourism (5.7%) was slightly higher than across the wider economy (5.5% using seasonally unadjusted data). Figure 4 provides a comparison of tourism unemployment and broader economic unemployment across the ten provinces.
Tourism unemployment remained high in April for the Atlantic provinces, both in comparison to other provinces and to the broader provincial economy, ranging from 9.6% in Nova Scotia to 14.5% in Newfoundland and Labrador. Saskatchewan and Manitoba also saw high unemployment rates in tourism (8.1% and 6.6%, respectively), as well as a large disparity between the rates in tourism and those of the broader labour force. Unemployment was overall lowest in Quebec (4.7%) and Ontario (5.0%). With the exception of Alberta, all provinces saw tourism unemployment outpace unemployment more generally.
Who’s Working in Tourism? Gender and Age Across the Industry Groups
Tourism boasts a very diverse workforce: some industries employ large numbers of recent immigrants and temporary foreign workers, and many employers go out of their way to welcome and sustain a culturally rich roster of employees. Because the sector spans so many different types of enterprises across a wide array of industries, there’s also a lot of diversity in terms of age: some businesses orient more towards older employees on a long-term basis, while others draw on a younger workforce with a higher turnover. There is no one-size-fits-all description for who is the ‘average’ tourism employee, and the fact that there is a place for everyone in tourism is one of the sector’s strengths.
This diversity, however, is not necessarily evenly distributed throughout the sector or its constituent industry groups. For industries and businesses that tend to rely on a limited demographic slice of the population to meet staffing needs, this can pose risks in terms of recruitment and retention. If the ‘usual’ demographic of workers becomes unavailable for some reason, it can be difficult to pivot quickly to attracting other workers, particularly if the industry has a strong social association with one group.
Although age and gender are very broad categories through which to assess the makeup of the tourism workforce, they do provide a good entry point to begin the conversation. Figure 5 provides an age and gender breakdown of employment across the sector as a whole, as of April 2023.
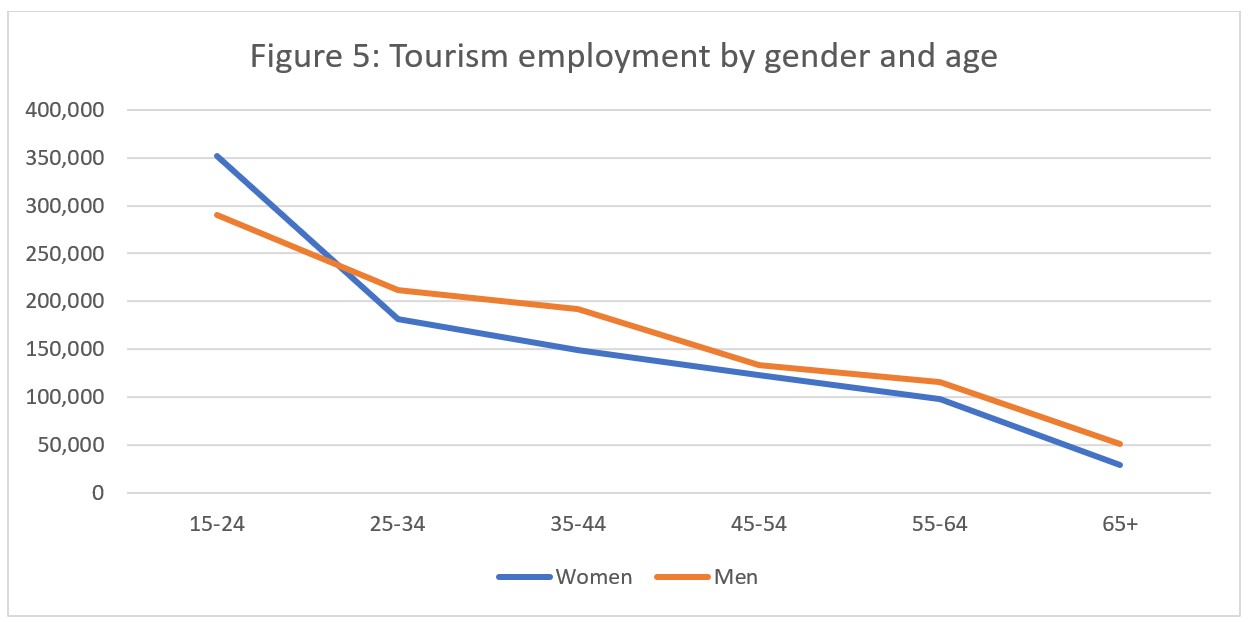
Unsurprisingly, there is a steady decrease in employment numbers as age increases, reflecting that two of the larger industries in the sector (food and beverage services and recreation and entertainment) draw heavily on younger workers looking for part-time employment.
The gender split is relatively evenly balanced: in the youngest group there are more women than men, and across the older groups there are slightly more men than women, but on the whole, there are no strong gender trends at this aggregate level. However, the picture changes when we consider each industry group in turn (see Figures 6a to 6e, below, which provide a series of snapshots as of April 2023).
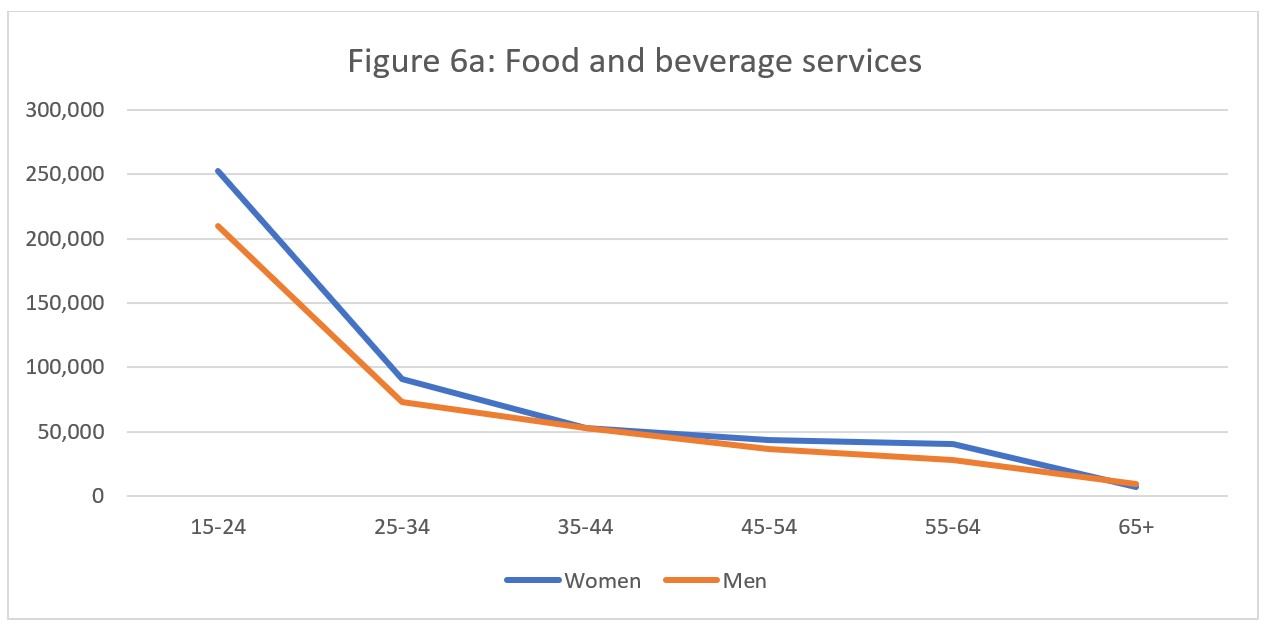
Starting with food and beverage services (Figure 6a), we see the general age split in even sharper relief. Employment drops precipitously between the youngest age group (15-24 years old) and the next (25-34), and then decreases gradually across the age groups. This suggests a lot of people have short-term experience in the industry, but a much smaller number stick with it for a career, or see it as a viable opportunity for a late-entry job. The gender effects are minimal in this industry, with both women and men following very parallel trajectories.
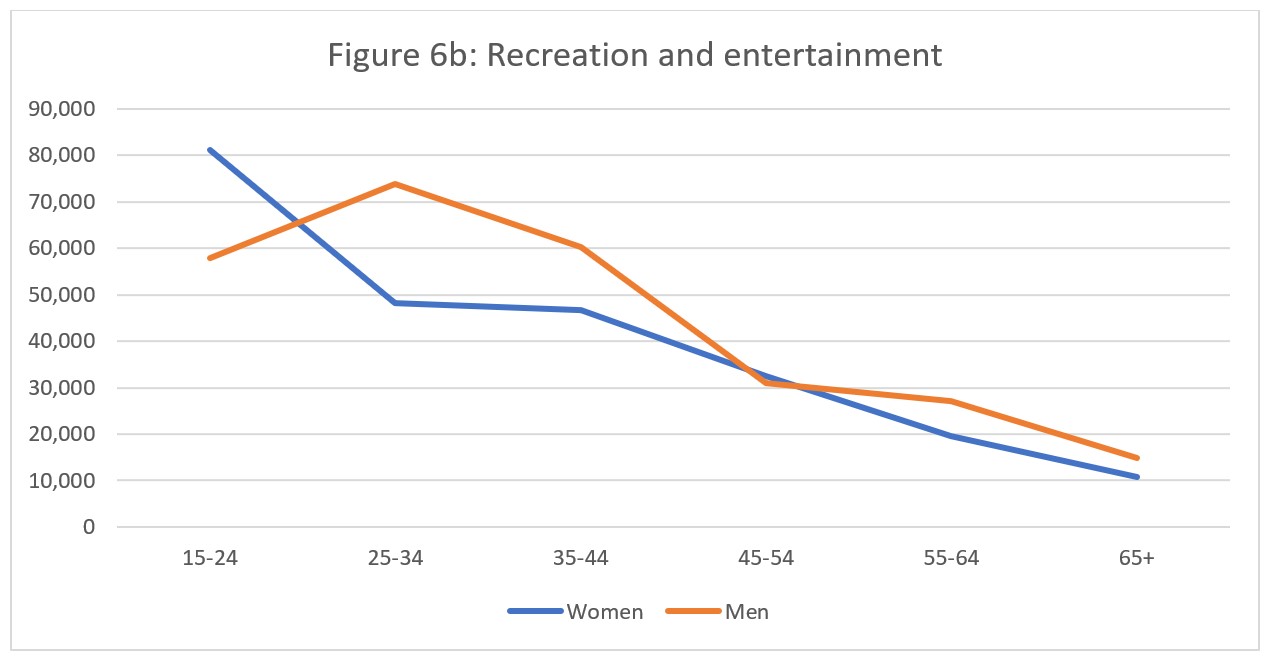
The next largest employer in the sector is the recreation and entertainment industry group (Figure 6b), which comprises a wide range of occupations and businesses and is therefore likely to appeal to a broader range of the working-age public. Overall, the pattern is not dissimilar to what we saw with the sector as a whole or with food and beverage services: generally higher participation in younger age groups, and gender fluctuations in the younger groups even out in the older groups. Women are substantially over-represented in the youngest age bracket, but that reverses between 25 and 44, and then the gap narrows beyond that. The age drop-off is not as pronounced in this industry group as it was in food and beverage services, although the absolute numbers are smaller. As noted, because this industry group covers a wide array of occupations across a number of different settings and operational contexts, it is unsurprising that the rate of participation of mid-career employees remains higher.
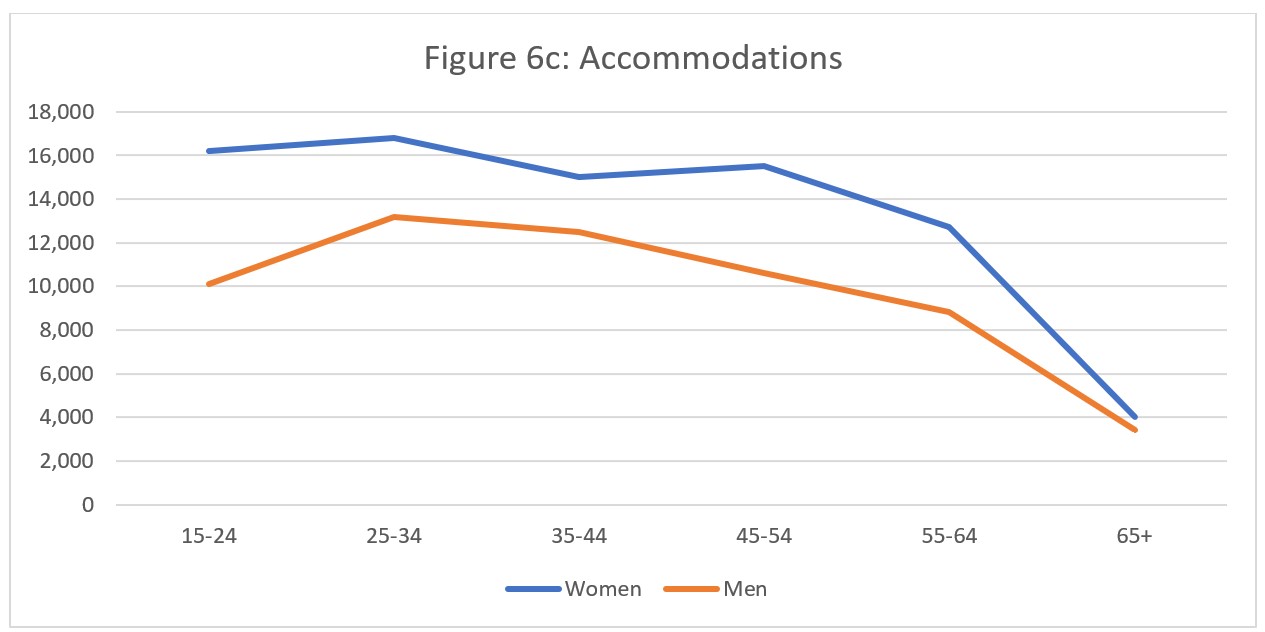
The accommodations industry is often perceived as heavily biased towards women (likely due to the ‘domestic’ associations around much of the work) and this perception is broadly help up by the data. That said, the gender gap is less pronounced than we might have expected, given widespread (mis)perceptions. Equally interesting in this industry group is the relatively flat age-related data: while numbers start to decline above 55, the accommodations workforce is much less reliant on younger workers than food and beverage services or recreation and entertainment. This suggests either people staying in employment for longer and building a career, or more openness in the industry to hiring older workers, or more interest in older workers to pursue jobs in this industry—likely, it is some combination of the three.
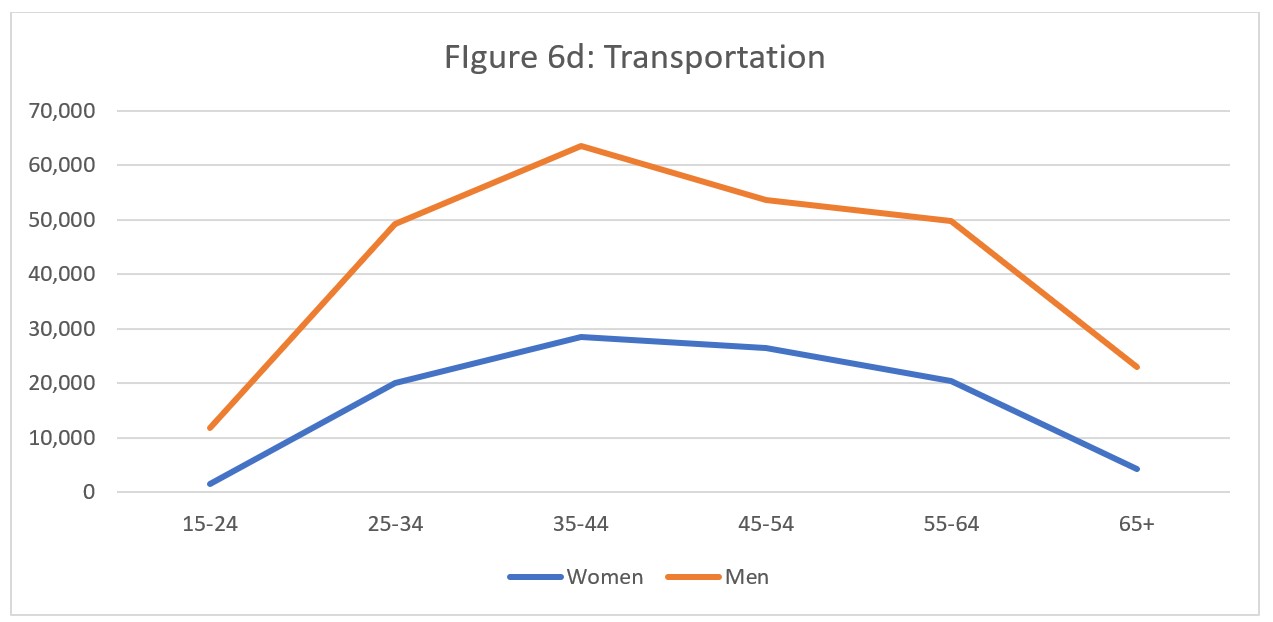
Another industry with strong gendered connotations in popular perception is transportation (Figure 6d), and these cultural assumptions are again borne out by the data: across all age groups, there are approximately twice as many men employed as there are women. Given the technical and licensed nature of many jobs in transportation, it is unsurprising that there are very few young workers. As many jobs in this industry are also unionized, it is also unsurprising to see evidence of career building: having invested in specific (and often expensive) certifications in this field, and working in an environment with strong collective bargaining mechanisms in place, we would expect a number of workers to stay in the industry for extended periods. This is precisely what the data supports.
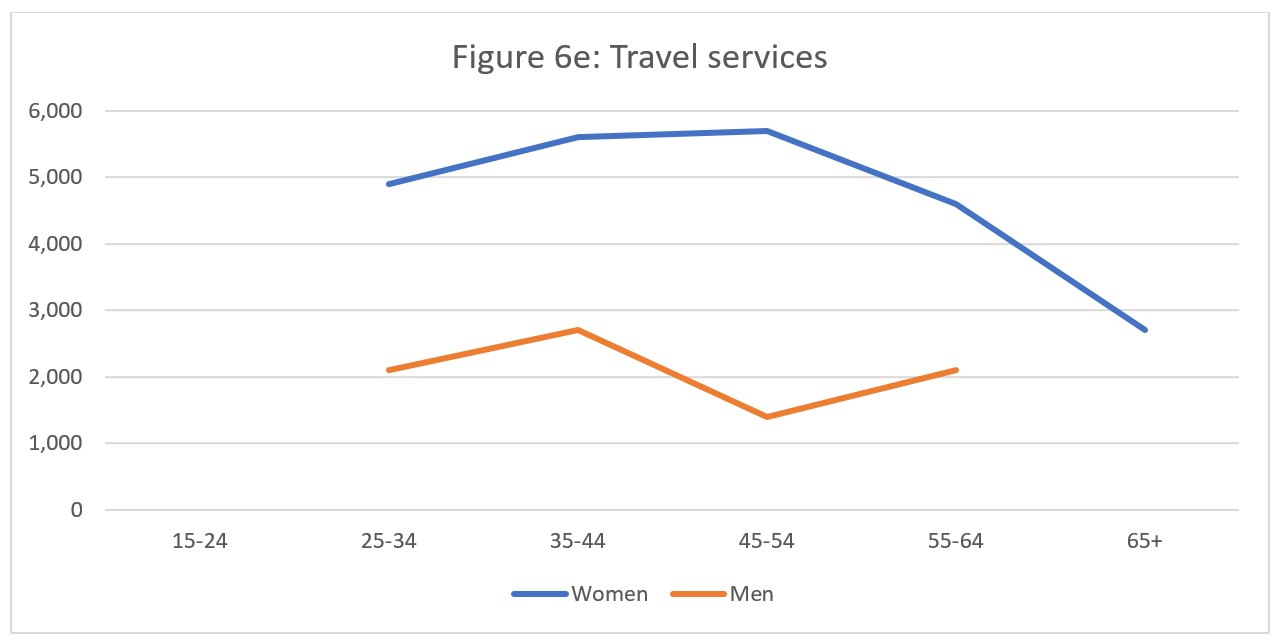
Travel services (Figure 6e) shows the strongest composite gender and age effect, although it is worth remembering that, because this is a relatively small industry within the sector, small absolute differences may be disproportionately amplified through statistical measures. Nevertheless, women make up more than 50% of the workforce in travel services, and seem to stay in the industry to a later age than men. The absence of younger workers (aged 15-24) in this data is not unexpected, given that many entry-level positions in this field require some kind of post-secondary qualification (college or university), which will naturally push the working ages into the next-highest bracket.
Some General Observations
Where there are strong gendered effects in the distribution of employment across tourism industries, they generally align with common (mis)conceptions of the work in question. When we think of pilots and drivers and ship personnel, many likely imagine men; and when we think of hotel workers, the occupations that come most rapidly to mind include housekeepers and front desk attendants, whom many are likely to imagine as women.
However, these stereotypes do not entirely align with reality: the ratio of women to men in accommodations, for instance, tells us that while there are more women than men, it is by no means an exclusively female workforce. This reflects the reality of the range of jobs available in accommodations, which are not popularly associated with the industry (e.g., skilled trades and financial/managerial roles), alongside the more public-facing occupations that have more gendered popular perceptions.
There is a broad social push to encourage more women to work in trades and licensed professions, so it likely that the ratio of men to women in transportation will shift over time, although it will likely take several years for the numbers to start to shift, given the length of training necessary in many transportation jobs (e.g., airline pilots, ship personnel, commercial drivers).
Where there are strong gendered associations linked to particular occupations, businesses (and the sector as a whole) need to do more to attract a more diverse range of workers, or risk facing ongoing and escalating staffing pressures.
The unfortunate reality is that jobs dominated by women tend to be seen as less prestigious, so as women pursue more prestigious career options, it will become increasingly difficult to fill these positions domestically. International workers can meet some of those needs, particularly for people from countries where tourism jobs are seen in a more positive light, but the narrative of careers in tourism needs to change in any event.
Initiatives such as Discover Tourism are an excellent starting point for reframing tourism as a desired career destination, but more focused work on specific industries—or occupations—will likely be needed.
View more employment charts and analysis on our Tourism Employment Tracker.
[1] As defined by the Canadian Tourism Satellite Account. The NAICS industries included in the tourism sector those that would cease to exist or would operate at a significantly reduced level of activity as a direct result of an absence of tourism.
[2] SOURCE: Statistics Canada Labour Force Survey, customized tabulations. Based on seasonally unadjusted data collected for the period of April 9 to 15, 2023.
[3] The labour force comprises the total number of individuals who reported being employed or unemployed (but actively looking for work). The total Canadian labour force includes all sectors in the Canadian economy, while the tourism labour force only considers those working in, or looking for work in, the tourism sector.
[4] Employment refers to the total number of people currently in jobs. Tourism employment is restricted to the tourism sector, while employment in Canada comprises all sectors and industries.
[5] Unemployment is calculated as the difference between the seasonally unadjusted labour force and seasonally unadjusted employment estimates. The percentage value is calculated against the labour force.