Canadian Tourism Labour Market Snapshot
Overall, the tourism sector[1] in November saw a decreased performance relative to the previous month, across the three key indices of labour force, employment, and unemployment. The only notable exception was in transportation, which improved across all three. The total number of hours worked increased, continuing to narrow the gap with the pre-pandemic baseline of 2019, and the ratio of full-time to part-time work remained steady from October, and lower last year, indicating a slight shift towards full-time work across the sector as a whole.
At the industry group level, there was less variability than was noted in October’s LFS estimates [2]. Table 1 provides a snapshot of the industry groups’ performance across labour force, employment, and unemployment, as compared with October 2022 [MoM], November 2021 [YoY], and with November 2019 as a pre-pandemic baseline. Small arrows represent changes of less than 1%.
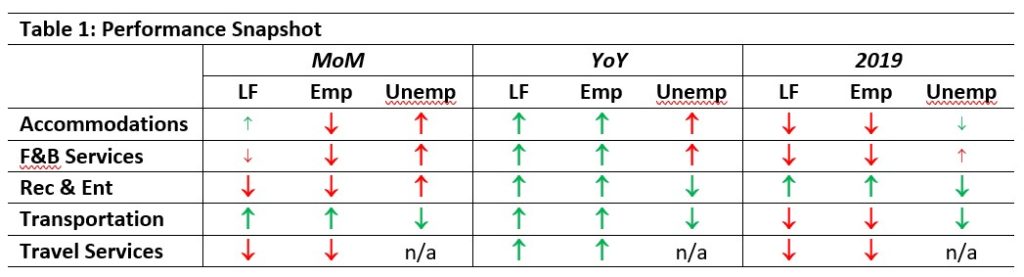
The labour profiles for the industry groups were generally depressed relative to the previous month, with the exception of transportation, which had improved. There was across-the-board improvement on last year for both labour force and employment estimates, although unemployment was up for accommodations and for food and beverage services. Only recreation and entertainment had improved on pre-pandemic figures overall: for the most part, tourism continued to lag behind 2019 numbers, although unemployment here was generally improved. As general economic instability continued to exert an effect on the short-term shifts, the broader trend of year-on-year recovery continued.
Tourism Labour Force
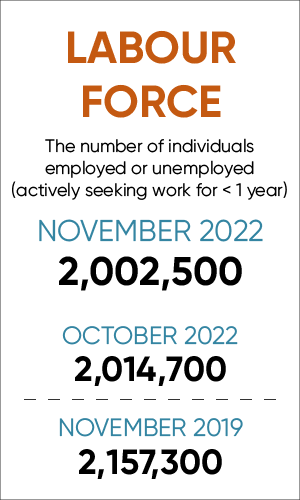
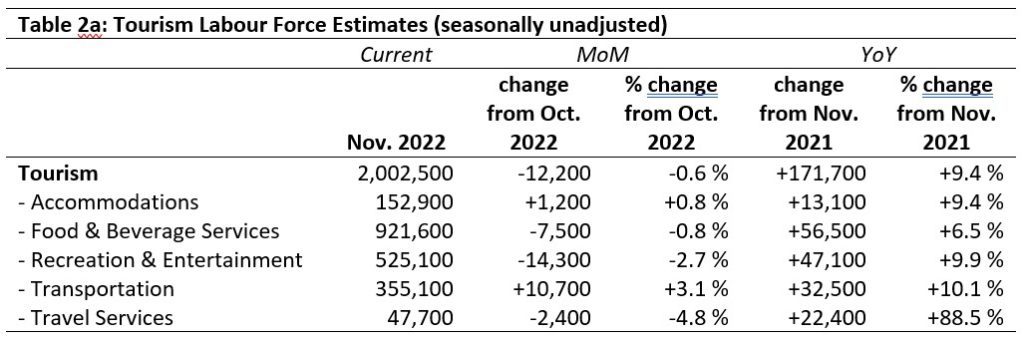
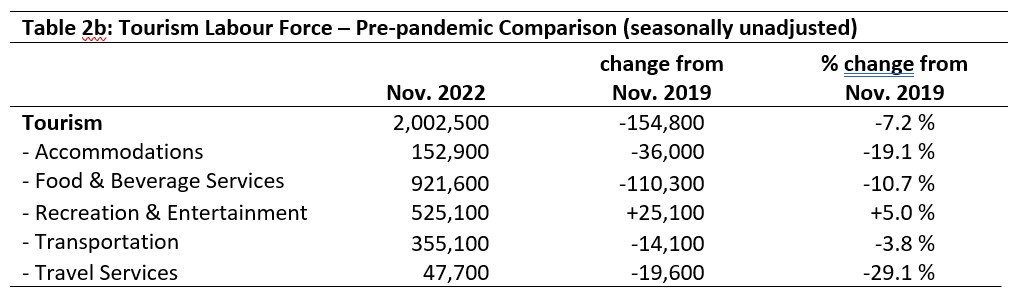
The tourism labour force[3] in November accounted for 9.7% of the total Canadian labour force, a very slight decrease from October (9.8%) but still below the pre-pandemic percentage of 10.7%. Tables 2a and 2b provide a summary of the tourism labour force as of November 2022.
November: Month-over-Month
The tourism labour force overall stayed essentially static from October into November, with proportionally larger changes in transportation (which saw growth), and recreation and entertainment and travel services (which both saw modest declines). Accommodations and food and beverage services saw no substantial movement.
November: Year-on-Year
Compared to November 2021, there were strong gains across the sector as well as in each of the industry groups. Travel services saw the most impressive growth in the labour force, with an additional 22,400 people entering (or re-entering) the labour force in this industry. The LFS data cannot differentiate between new people starting a career and people returning to the industry as the sector recovers and demand increases: likely it is some combination of the two. The other four industry groups saw more modest gains, but gains nonetheless.
November: Pre-pandemic Baseline
In spite of strong year-on-year improvements, the tourism labour force remained below pre-pandemic levels. Only the recreation and entertainment group had broken through 2019 levels. Travel services and accommodations remained the most depressed within the sector.
Tourism Employment
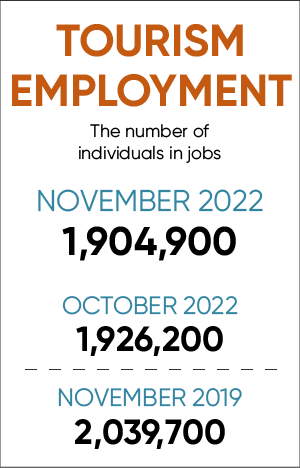
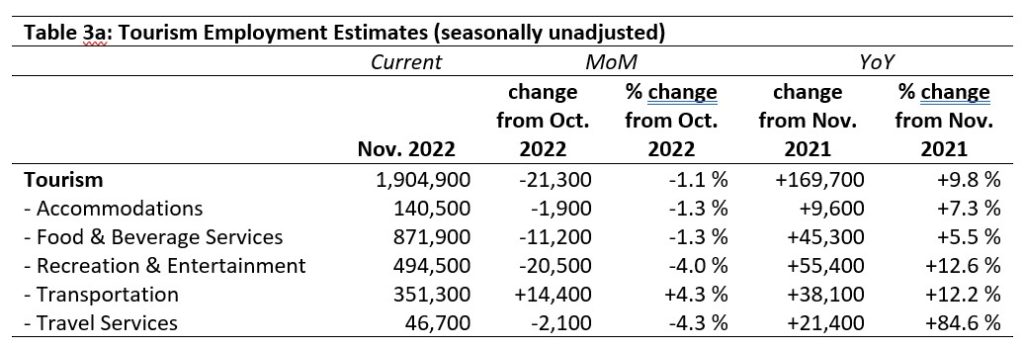
Tourism employment[4] accounted for 9.7% of all employment in Canada, and the sector employed 9.2% of the available labour force. These figures are slightly depressed relative to the previous month, and both about 1% below the pre-pandemic 2019 levels. Tables 3a and 3b provide a summary of tourism employment as of October 2022.
November: Month-over-Month
Employment across the sector as a whole saw a slight decline on the previous month, with some modest growth in transportation and modest losses in recreation and entertainment and travel services. These patterns very closely match those of the labour force, discussed above.
November: Year-on-Year
Across the sector, employment was substantially improved on the previous year, with an aggregate gain of nearly 10% on November 2021. The strongest gains were in travel services by a considerable margin; the smallest gains were in food and beverage services. Again, these patterns closely mirror labour force growth, but it is interesting to note that the employment growth for recreation and entertainment and transportation was slightly higher than their respective labour force increases, suggesting that over the past year these two industry groups have done well in recruiting new employees from other sectors or industries.
November: Pre-pandemic Baseline
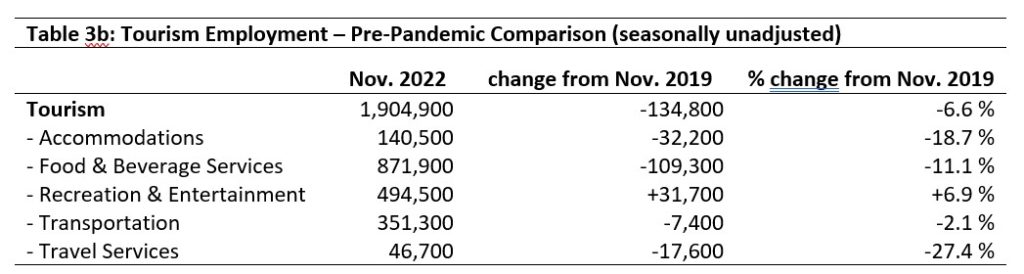
The recreation and entertainment industry group is the only one to have gained over 2019, also at a higher rate than its share of the labour force. In contrast, travel services, accommodations, and food and beverage services remain substantially below their pre-pandemic levels.
Part-time vs. Full-time Employment
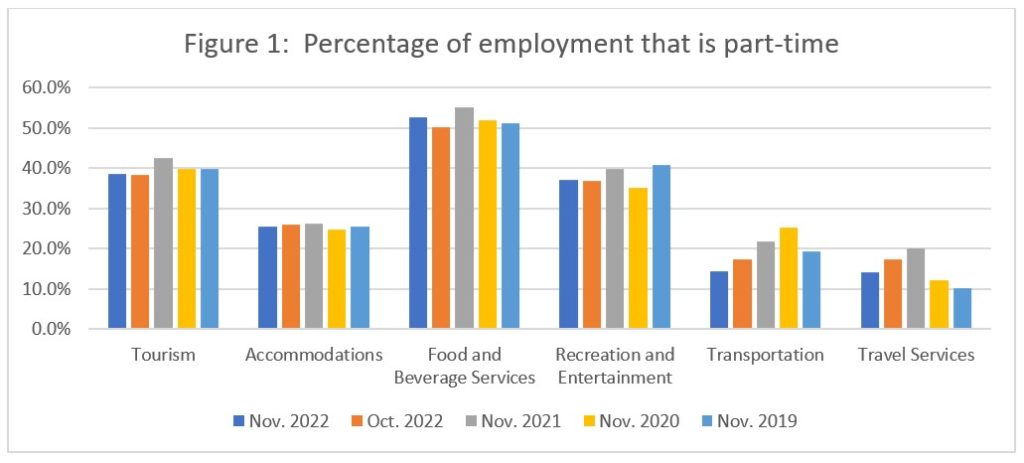
Tourism employment relies on both part-time and full-time employment, which is one of the factors that makes it an attractive sector for younger people (e.g., students working around their study commitments). Figure 1 provides an overview of the percentage of part-time employment across the industry groups. Transportation and travel services saw a slight decrease in part-time work from October, while food and beverage services saw a slight increase over the same period. Accommodations has remained stable relative to previous Novembers. The relative volatility observed in transportation and in travel services—which overwhelmingly rely on full-time employees—suggests that workers who reduced their hours during the peak of the pandemic disruptions have begun to return to full-time status.
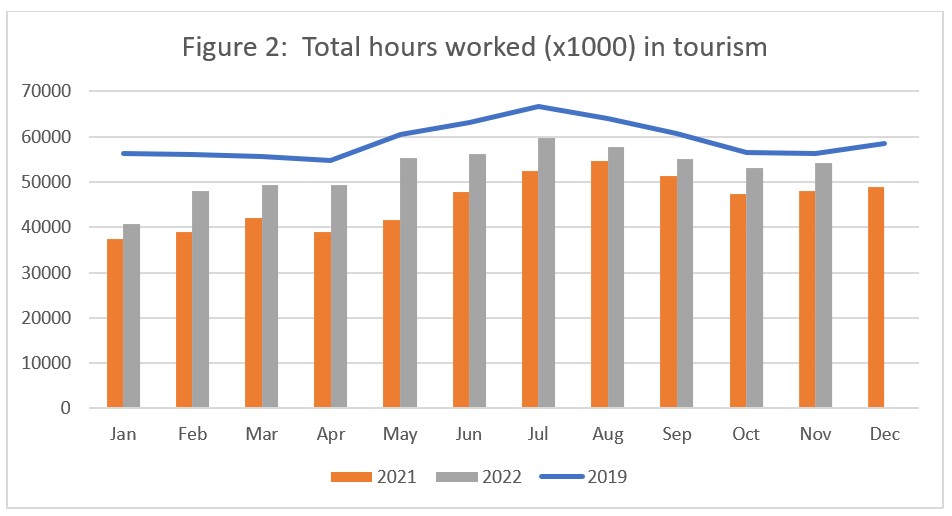
Hours worked
The total actual hours worked within the tourism sector is another useful metric by which to assess the health of the labour market (see Figure 2). Hours worked in 2022 continue to narrow the gap with 2019 pre-pandemic levels, and show consistent improvement over last year.
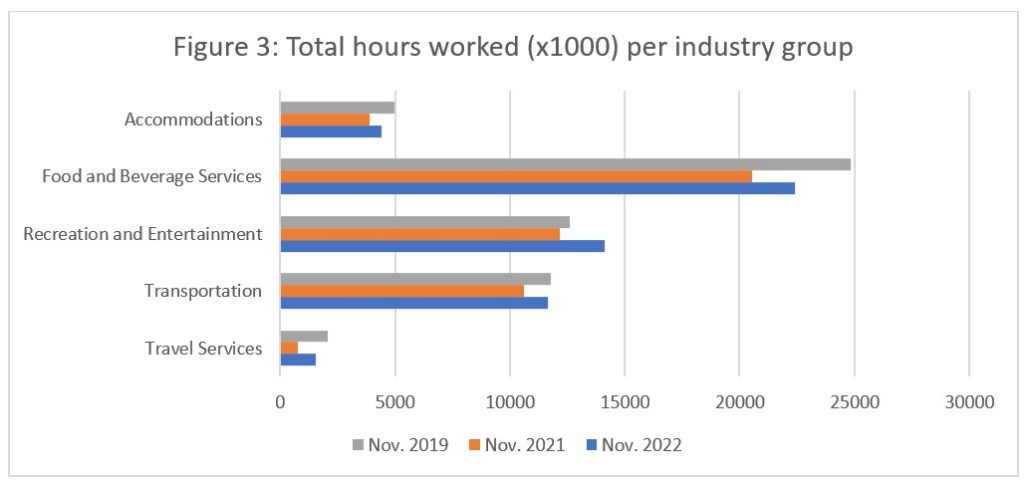
Across the industry groups, total hours worked (Figure 3) increased on last year. In transportation, hours worked had very nearly returned to pre-pandemic levels, while in recreation and entertainment, they had actually surpassed 2019. The biggest gap continued to be in food and beverage services.
Unemployment
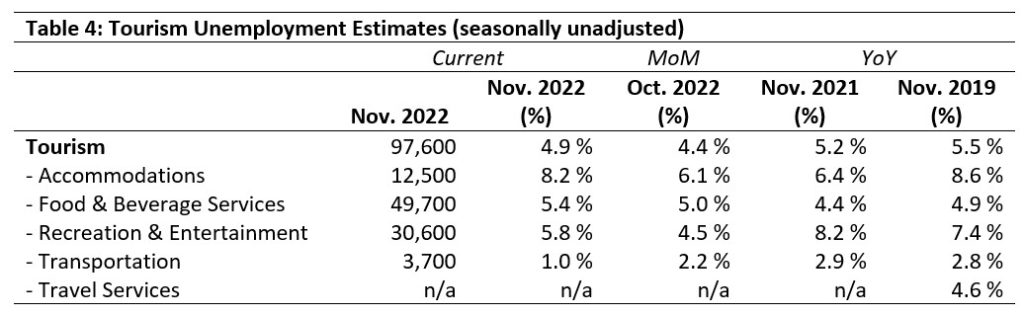
Unemployment[5] in the tourism sector in November was 4.9%, which was slightly higher than that in the wider Canadian economy (4.6%, using seasonally unadjusted data). Provincial trends are discussed below. Table 4 provides a summary of tourism unemployment in November 2022.
November: Month-over-Month
Unemployment was generally higher in November than in October, with the exception of transportation, which saw a decrease. The most affected industry group was accommodations, with 8.2% unemployment compared to 4.9% across the sector as a whole.
November: Year-on-Year
Unemployment in the tourism sector overall was lower this November than last year, and also lower than in 2019. Rates in accommodations were lower than 2019 but higher than 2021; this could either indicate very high employment in the industry in 2021, or fewer people in the labour force identifying accommodations as their industry group in November 2021 (i.e., they had left the industry completely). Unemployment in food and beverage services was up on previous years, while transportation was lower across the board.
Provincial Tourism Unemployment
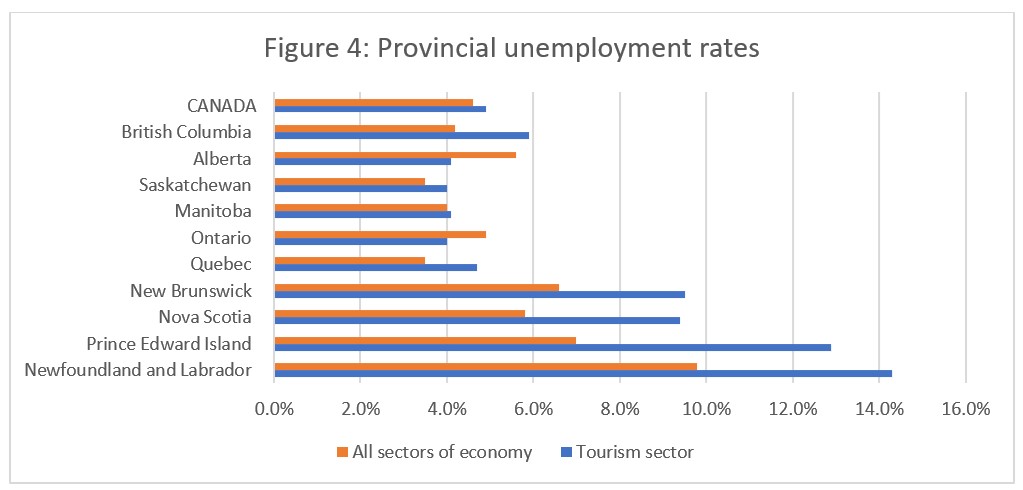
At the aggregate national level, unemployment in tourism was slightly higher than across the wider economy (see Figure 4). At the provincial level, there was considerable variability. The Atlantic provinces continued to see high unemployment across all sectors, and substantially higher rates in tourism specifically. Quebec, Saskatchewan, and British Columbia also had higher-than-background unemployment rates in tourism, while in Alberta and Ontario, tourism unemployment was lower than the background (i.e., wider economic) rate. The difference in Manitoba was negligible.
For the provinces where tourism unemployment surpassed unemployment across the entire provincial economy, Tables 5a to 5g provide a brief overview of the tourism sector. These include the labour force (LF) and employment (Emp) estimates, as well as an unemployment rate calculated from these estimates (UnEmp).
It is worth noting that where a provincial economy is relatively small, small differences can become amplified in the calculation of percentages, and rounding errors within the estimates may also introduce arithmetic errors. Blank spaces in each table represent data that has been suppressed by Statistics Canada, either for confidentiality reasons or because the reported numbers are below the estimated error threshold.

Prince Edward Island
By raw numbers, food and beverage services had the highest unemployment (i.e., people not working in that industry), while proportionately, accommodations and recreation and entertainment were the hardest hit. No estimates were available for either transportation or travel services.
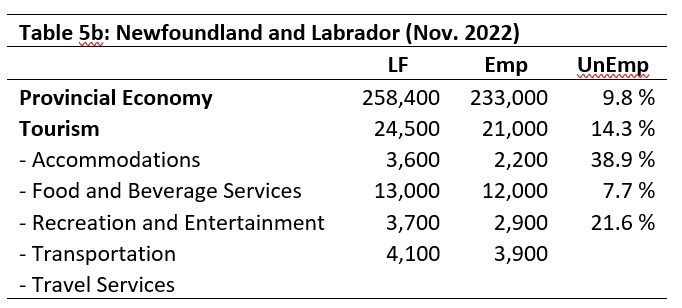
Newfoundland and Labrador
In Newfoundland and Labrador, accommodations had the highest unemployment rate, as well as the highest raw number of unemployed people (LF-Emp), followed by recreation and entertainment. Although food and beverage services had around 1,000 people unemployed, this was relatively small given the size of the labour force overall.
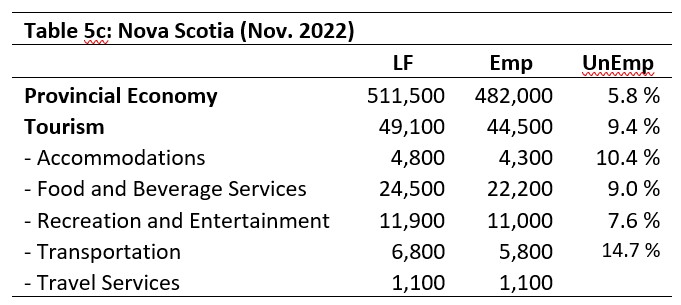
Nova Scotia
The industry group proportionately most affected by unemployment in Nova Scotia was transportation (14.7%), with around 1,000 people unemployed; this was followed by food and beverage services (10.4%), with around 2,300 people unemployed.
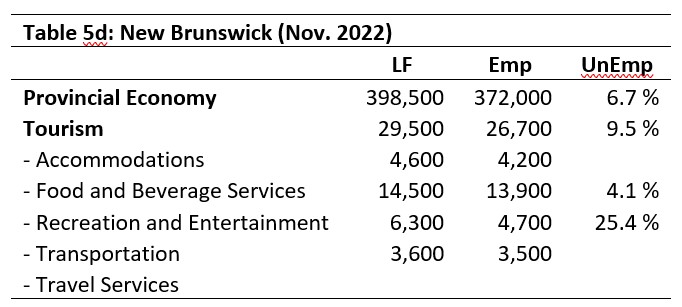
New Brunswick
In New Brunswick, much of the unemployment data is suppressed, although it is clear that the recreation and entertainment industry group is proportionately most affected by unemployment.
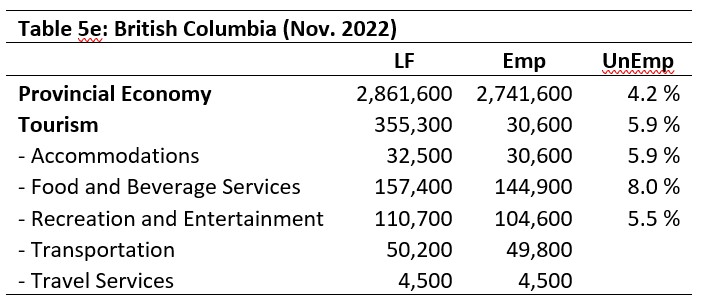
British Columbia
Food and beverage services in British Columbia faced the biggest challenges in November with respect to unemployment, while they were also the largest employer by industry group.
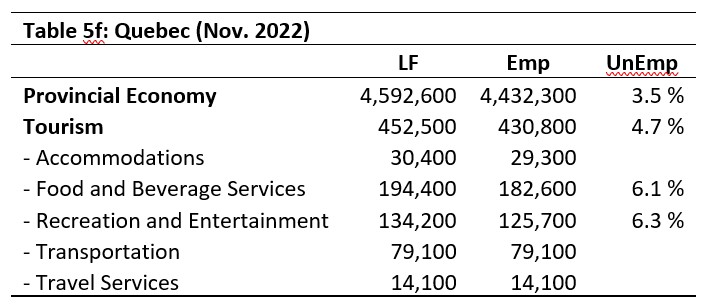
Quebec
Although tourism unemployment was higher in Quebec than the general provincial levels, it was actually below the national rate within the sector (4.9%); the fact that the background provincial unemployment rate was even lower speaks to the health of the overall economy, rather than to the state of the tourism sector in particular.
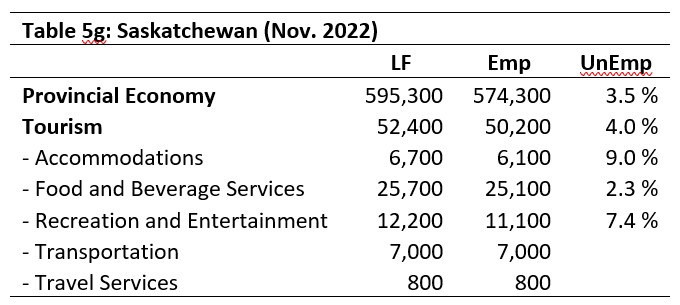
Saskatchewan
As with Quebec, the tourism unemployment rate in Saskatchewan was below the national rate, and reflected the provincial economic status rather than that of the sector. It is worth noting that food and beverage services had a substantially lower unemployment rate in Saskatchewan than elsewhere in the country, although this estimate does not take into account job vacancies, so does not necessarily indicate a strong industry in terms of labour.
View more employment charts and analysis on our Tourism Employment Tracker.
[1] As defined by the Canadian Tourism Satellite Account. The NAICS industries included in the tourism sector those that would cease to exist or would operate at a significantly reduced level of activity as a direct result of an absence of tourism.
[2] SOURCE: Statistics Canada Labour Force Survey, customized tabulations. Based on seasonally unadjusted data collected for the period of November 6 to 12, 2022.
[3] The labour force comprises the total number of individuals who reported being employed or unemployed (but actively looking for work). The total Canadian labour force includes all sectors in the Canadian economy, while the tourism labour force only considers those working in, or looking for work in, the tourism sector.
[4] Employment refers to the total number of people currently in jobs. Tourism employment is restricted to the tourism sector, while employment in Canada comprises all sectors and industries.
[5] Unemployment is calculated as the difference between the seasonally unadjusted labour force and seasonally unadjusted employment estimates. The percentage value is calculated against the labour force.