
 Tourism HR Canada regularly provides tourism stakeholders with new information on the labour force. A key data source is the Canadian census, which contains highly detailed information on the demographic makeup of the people who staff jobs in the industry.
We’ve released a series of charts that explore the share of tourism employees in 38 occupations who are either at, above, or below the expected skill level/educational attainment for their occupation. The information is further broken down by the age of the employee, gender, immigrant status, and work patterns (full-time or part-time).
Here’s an overview of how to read the charts and what trends to explore.
What does skill level mean?
This set of figures includes data on the relative “skill level” of employees in tourism occupations. Here, “skill level” refers to the level of educational attainment on the part of the employee, not job proficiency.
The data on expected skill level for an occupation was collected from the Canadian government’s National Occupational Classification (NOC) system. This database compiles information on hundreds of occupations nationwide. These occupations are then classified by skill level and broad occupational category on a matrix structure.
The skill levels (still referring to employees’ levels of educational attainment) are categorized alphabetically from A to D, each letter denoting a level of educational attainment typically required for that line of work.
Jobs classified at the “A” or “B” skill level typically require a post-secondary level of education. Classes “C” and “D” occupations generally need lower levels of educational attainment. (The NOC matrix also includes 0 level management occupations, which are at skill level A.)
| NOC Level | Skill Level |
| 0 | Management (Skill Level A) |
| A | Occupations usually require university education |
| B | Occupations usually require college education or apprenticeship training |
| C | Occupations usually require secondary school and/or occupation-specific training |
| D | On-the-job training is usually provided for occupations |
What do the charts show?
The NOC matrix indicates the level of education “usually” required to work in an occupation. However, many people work in occupations that do not necessarily correspond with their educational attainment.
Using the 2016 census, Tourism HR Canada was able to identify the share of employees in an occupation who are below, at, or above the “usual” skill level expected for the occupation. If workers are classified as “above the required skill level”, they have reached a higher level of education or training than is necessary for their respective occupations.
For example, a cashier with a doctorate would be classified as above the required skill level for their occupation, regardless of their competency as a cashier. Similarly, those who are classified as “below the required skill level” may have not yet attained certain levels of training expected for their job yet may be competent employees. Those who are “at the required skill level” would possess whatever degree of education expected of one in their position (be it a high school diploma or a university or college degree) and whatever supplemental training is required to carry out their role, but no more.
The figures produced from this data are arranged for each of the 38 occupations included in Tourism HR Canada’s customized census tabulations, produced by Statistics Canada. The reported level of educational attainment of employees who work for establishments within the tourism sector was compared to the skill level rating in the NOC matrix. While many of these occupations (e.g., cashiers) include individuals working in non-tourism industries, these are not included in the analysis.
Census data was then used to further classify employees in the occupations by their age, gender, immigration status, and “work activity” (i.e., part- or full-time employment). A further non-occupation-specific analysis was done for the five industry groups within the tourism sector (see chart 5 of 6).
How do I read the figures?
The figures produced from this data are visualized in a set of six graphs that can be toggled using the arrows at the bottom of the page. Each has a horizontal bar graph and a pie chart showing the data. Graph 1 shows the overall breakdown of employees who are below, at, or above the required skill level within an occupation based on the “usual” level of education indicated in the NOC matrix. The other graphs show the same data cross-tabulated with additional variables such as employee age group, gender, immigration status, tourism industry subgroup, or work activity.
Occupations can be selected from the drop-down menu near the top of each page. The occupation’s NOC skill level classification will be visible to the left of the occupation name. All occupation names will be preceded by a four-digit number in that drop-down menu. These numerical codes may be entered into the “NOC Quick Search” function on the National Occupational Classification webpage for further information, including a general job description, a list of alternate titles, main duties, educational and employment requirements, and more.
In the four graphs that further classify employees by additional demographic variables, the bar graphs show the percentage of employees, below, at, or above the required skill level for each demographic variable. The pie charts show the total number (as well as percentage) of employees at each skill level for each demographic variable out of the total number of employed workers in the occupation.
How do I interpret the numbers?
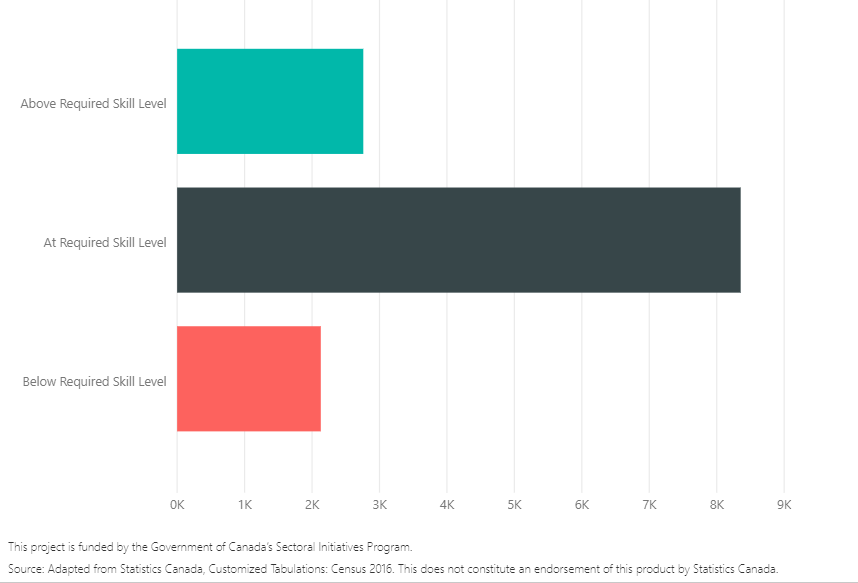
Numerous trends can be found within the dataset. As an example, most individuals employed as air pilots, flying instructors, and flight engineers are appropriately skilled for their respective careers, with this trend holding true regardless of age, gender, or work activity. For this occupation, individuals with a higher level of education than required are more common than those who are under-skilled.
Sample 1: Skill Level of Air Pilots, Flying Instructors and Flight Engineers – Level B
In contrast, the majority of those working as cooks have a lower level of educational attainment than is usual for this occupation as defined by the NOC matrix. Again, this trend holds true regardless of the demographic variables examined, except for cooks who are non-permanent residents.
Sample 2: Skill Level of Cooks (by Immigration Status) – Level B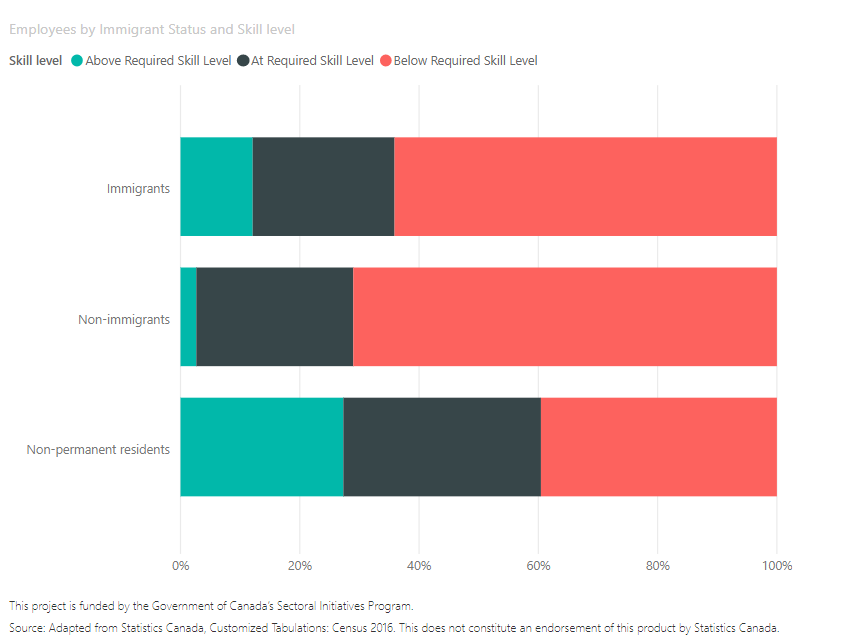
What should I consider while exploring the charts?
Numerous other trends can be extracted from this data, but it is important to note that data can often be equivocal, and that there are many potential pitfalls. As mentioned, in the NOC matrix, skill level refers to educational attainment, not proficiency in an occupation.
Furthermore, the data shown has not been analyzed for statistical significance. Without this, it is difficult to determine how meaningful differences are, regardless of how obvious they may appear. Often, subtle (and occasionally not-so-subtle) differences in data prove to be statistically insignificant. Without further work, there is a chance of being incorrect in assuming that there is a difference, for example, between the overall skill level of immigrant and non-immigrant bakers.
Still, the available data is useful as an indicator of trends in the sector and where further analysis is worth undertaking. Curious trends often inspire further investigation into their cause.