Tourism Labour Force Contracts Slightly
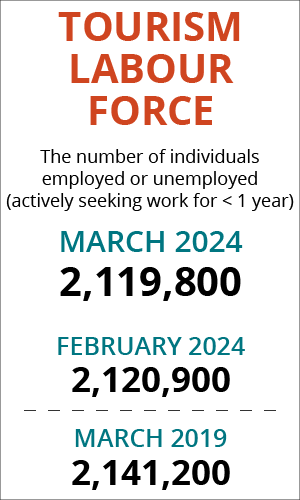
The tourism sector[1] in March saw an overall slight decline over the previous month[2], with contractions of less than 1% across labour force and employment, and an increase of less than 1% in unemployment. The sector was in a stronger position than in March 2023, but remained slightly below 2019 levels.
At the industry group level, the profile overall showed more variability.
Table 1 provides a snapshot of tourism’s and each of its five industry groups’ performance across labour force, employment, and unemployment, as compared with February 2024 [MoM] and March 2023 [YoY], and with March 2019 as a pre-pandemic baseline. Small arrows represent changes of less than 1%, or less than one percentage point (pp) in the case of unemployment.
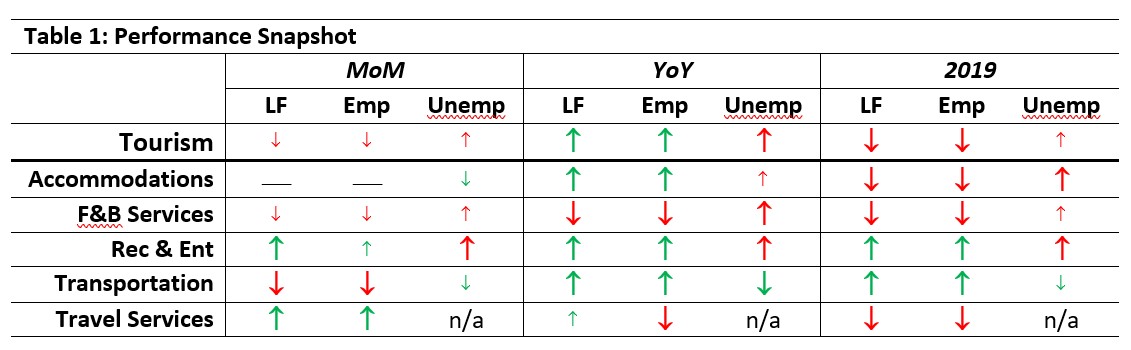
Accommodations was unchanged on both labour force and employment, and saw a slight decrease in unemployment. Recreation and entertainment saw larger gains in labour force than employment, and so also an increase in unemployment. Transportation saw losses across both labour force and employment for the first time in several months, while travel services saw growth in both labour force and employment. It should be noted that because of its relatively small size within the tourism sector, small absolute changes in travel services can become amplified when converted to percentages—longer-term monitoring of the industry will decide whether this is a monthly deviation or the start of a new trajectory.
Most industry groups were in a stronger position than last year, although all but two (recreation and entertainment and transportation) remained below 2019 levels on key indices.
Tourism Labour Force
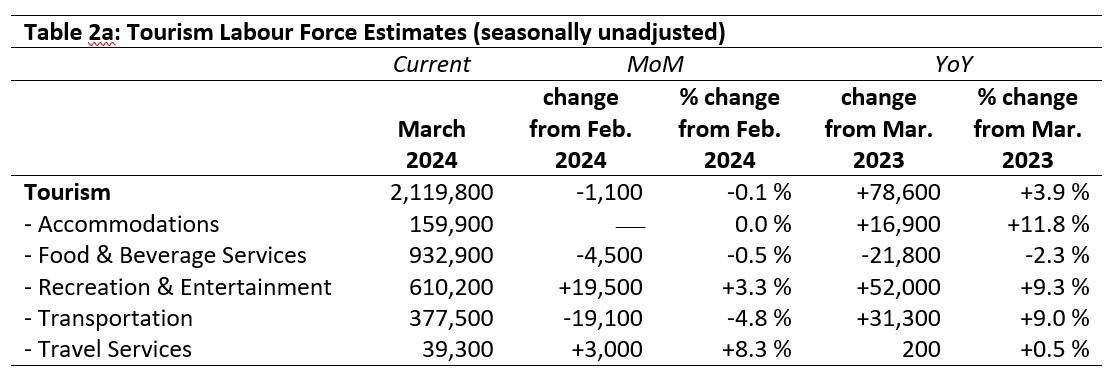
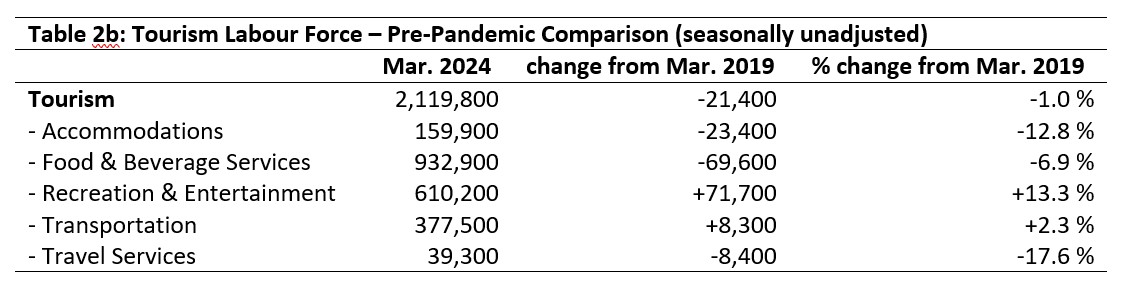
The tourism labour force[3] in March 2024 accounted for 9.8% of the total Canadian labour force, which was very slightly (0.1 percentage points) below its share in February, and nearly a full percentage point below 2019. Overall, the sector’s labour force was 99% of its size in March 2019. Tables 2a and 2b provide a summary of the tourism labour force as of March.
February 2024: Month-over-Month
The sector saw a very slight contraction of its labour force from February, although there were some differences between industries. Accommodations was unchanged, while gains in recreation and entertainment almost exactly cancelled losses in transportation. Food and beverage services saw a labour force decline of 4,500 people, while travel services saw an increase of around 3,000. Due to the small size of travel services as an industry group (relative to the tourism sector but also the sample size of the Labour Force Survey itself), this estimate should be considered tentative at this point, although if the upward trend continues into next month, it may indeed signal that conditions in travel services are starting to improve.
March 2023: Year-on-Year
The sector overall was in a substantially stronger position this time than last year, with nearly 80,000 more people in its labour force. Most industry groups saw increases, ranging from an 11.8% bump in accommodations to less than a 1% increase in travel services. Food and beverage services alone saw a decline in its labour force from last year.
March 2019: Pre-pandemic Baseline
The sector remained around 1% below its pre-pandemic labour force size, an aggregate which masks considerable variation between the different industry groups. The labour force in recreation and entertainment was over 70,000 people stronger than in 2019, and transportation saw an increase of over 8,000. In contrast, food and beverage services had lost nearly 70,000, while accommodations saw a decline of around 23,000 and travel services 8,000.
Tourism Employment
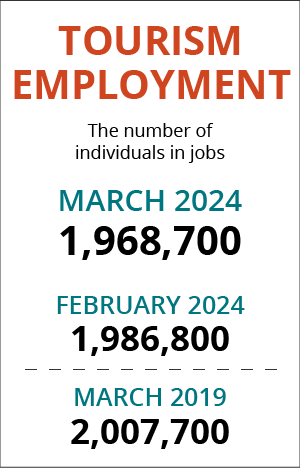
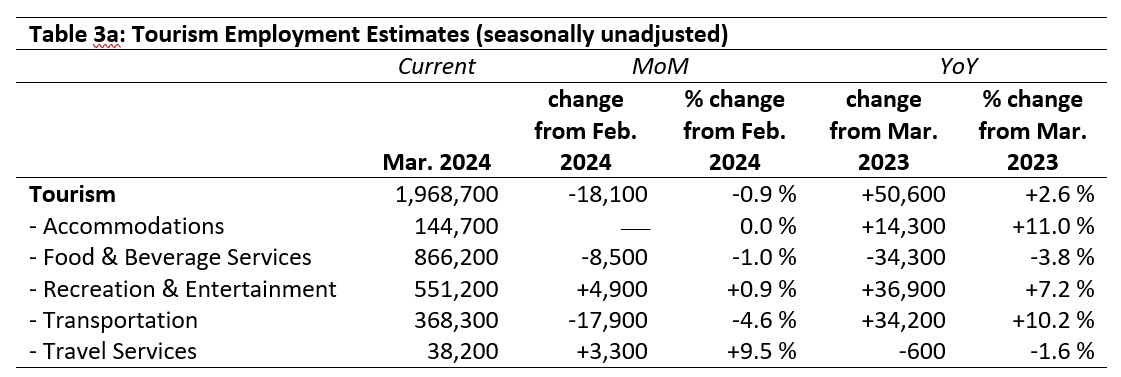
Tourism employment[4] accounted for 9.8% of all employment in Canada, and around 9.1% of the Canadian labour force worked in a tourism industry. Both figures are slightly below where they were in February, and although tourism’s share of all employment has reached parity with February 2019, the share of Canadians working in tourism remains around 1 percentage point below the pre-pandemic rate. Tables 3a and 3b provide a summary of tourism employment as of March 2024.
February 2024: Month-over-Month
The sector’s losses in employment were higher than those in labour force, although the monthly decrease was less than 1% in the aggregate. Employment in accommodations remained unchanged, while that in travel services increased by over 9%. Transportation saw substantial losses in employment, with nearly 18,000 workers having left—a loss of 4.6%. Food and beverage services also saw a slight decline in employment.
March 2023: Year-on-Year
Compared to last year, the sector saw a net gain of around 50,000 workers. Gains in transportation and losses in food and beverage services cancelled out (both seeing changes of around 34,000), with the remainder of the gains supported by strong growth in accommodations (+11%) and recreation and entertainment (+7.2%). Travel services saw losses of around 600 employees in the past year.
March 2019: Pre-pandemic Baseline
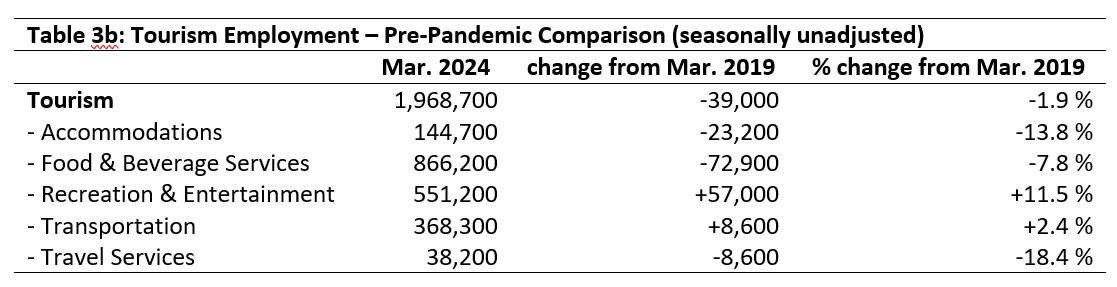
Employment in tourism was around 2% below 2019 levels, with variation between industries following familiar patterns: recreation and entertainment and transportation saw substantial growth in the past four years, together accounting for around 65,000 new people working in the sector. However, these gains were offset by losses in food and beverage services (around 73,000), in accommodations (around 23,000 workers), and in travel services (over 8,000 people).
Part-time vs. Full-time Employment
The ratio of part-time to full-time employment across tourism provides a useful perspective on the composition and stability of the workforce. Generally, the sector has tended to have around 40% of its employees in part-time positions (defined by Statistics Canada as working fewer than 30 hours per week), with different rates seen across the industry groups. These differences are largely due to the age and life stage of employees, as well as impacts of the degree of training, licensing/certification, and experience that differ across prominent industry occupations.
During the pandemic, employment patterns changed, sometimes dramatically: some businesses scaled back their operations and retained only a skeleton staff at full-time hours, covering the work of those who had been laid off or furloughed; others shifted towards keeping more staff on at part-time hours, in order to retain bench strength. Persistent deviations from pre-pandemic patterns can reflect realignment within the industries. Figure 1 provides an overview of the percentage of part-time employment across the industry groups.
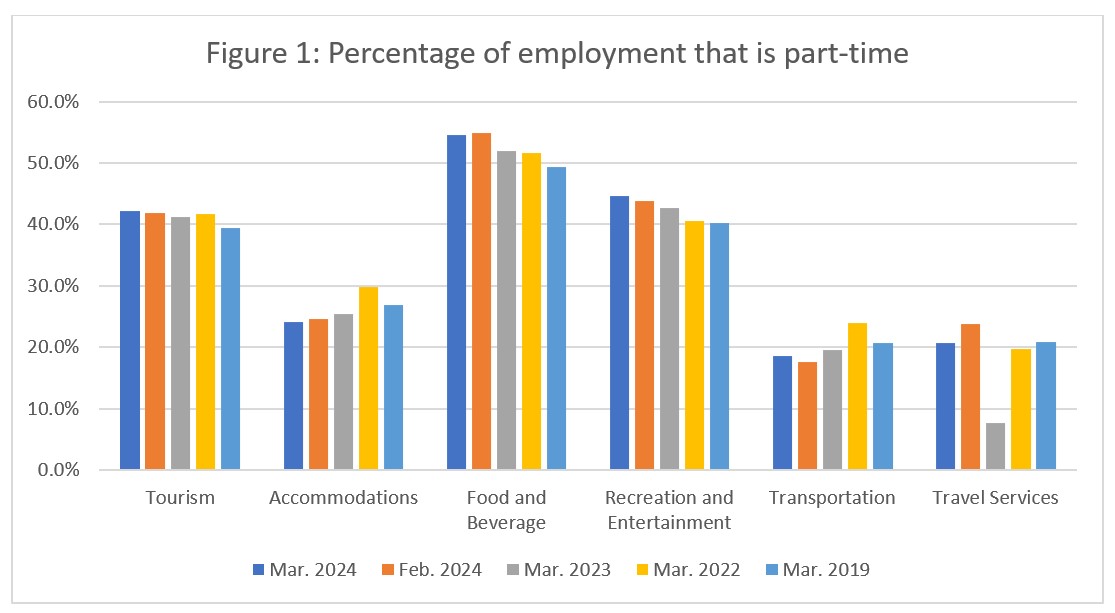
The sector’s overall share of employment that is part-time saw a very slight increase from February, and was around 3 percentage points higher than in March 2019.
The part-time share of accommodations employment has continued its trend of gradual decrease, down from around 27% in March 2019 to just over 24% in 2024. Apart from a spike in March 2022, coinciding with peak disruption due to COVID-19, this trend has been fairly steady, and likely represents a shift in the industry overall.
In contrast, food and beverage services has been increasingly reliant on part-time employment over the past several years, although there was little change month-over-month from February. The latest figure is over 5 percentage points higher than it was before the pandemic.
Recreation and entertainment also showed a straightforward increase, up 0.7 percentage points from February, and over 4% from March 2019. Transportation and travel services have both historically been around 20% part-time: transportation’s part-time share has dropped slightly from pre-pandemic levels to 18.6%, while travel services has more or less returned to March 2019 rates.
Overall, the industries that align with an older workforce tend to have fewer part-time employees and are seeing a gradual shift away from part-timers, while those that align with a younger workforce are increasing their share of part-time workers.
Hours worked
The total actual hours worked within the tourism sector is another useful metric by which to assess the health of the labour market (see Figure 2). For industries particularly reliant on part-time work, it is easy for businesses to lower the total hours worked without having to change their roster of employees, making this index potentially more responsive to short-term changes than raw employment figures alone.
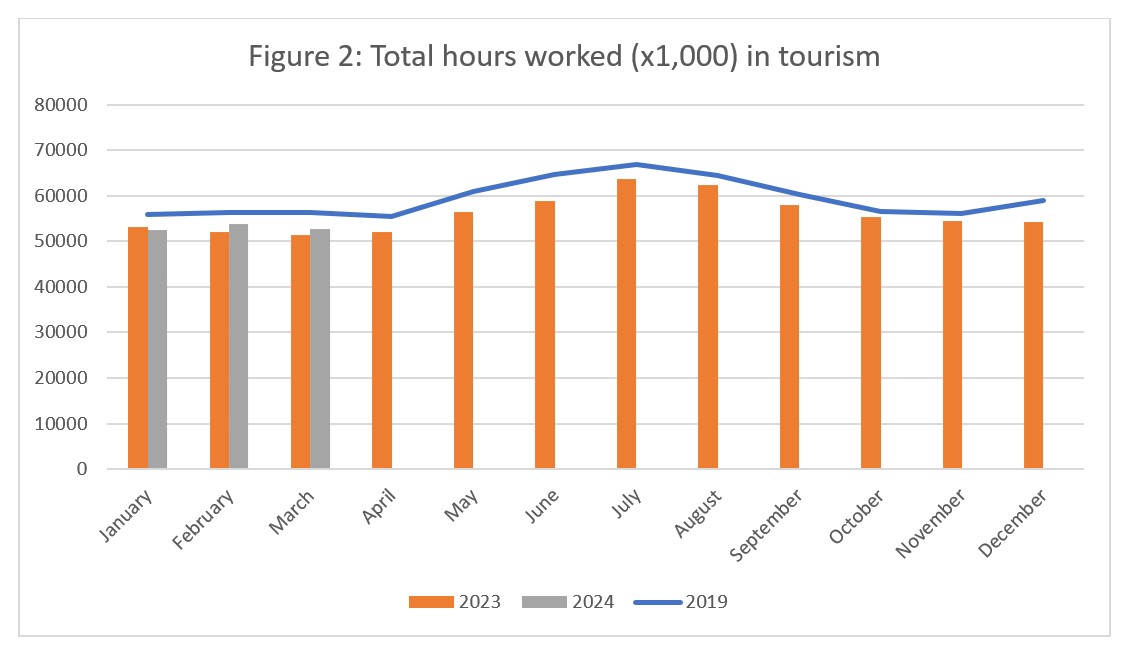
The total hours worked fell slightly from February (-1.8%), but was 2.5% higher than in March 2023. Although hours worked in 2024 have tended to be higher than in 2023 (except for January), the totals remain substantially below 2019 levels (-6.3% in March). However, unpredictable and volatile weather in February and March may have had an impact on hours worked; as the year continues and tourism enters its summer surge period beginning in May, it will be interesting to see how 2024 compares with 2019.
Figure 3 breaks down the total hours worked across the sector into its constituent industry groups, and provides a year-over-year comparison starting in 2019. As March 2020 marked the beginning of the pandemic disruptions, it is unsurprising that most industry groups saw a substantial drop from 2019 into 2020. Interestingly, travel services saw a slight increase in 2020, which may reflect extra work put in by travel agents in the wake of pandemic disruption to travel plans. The total hours worked in travel services has remained fairly stable, which is remarkable given the difficulties the industry has faced in regrowing its workforce.
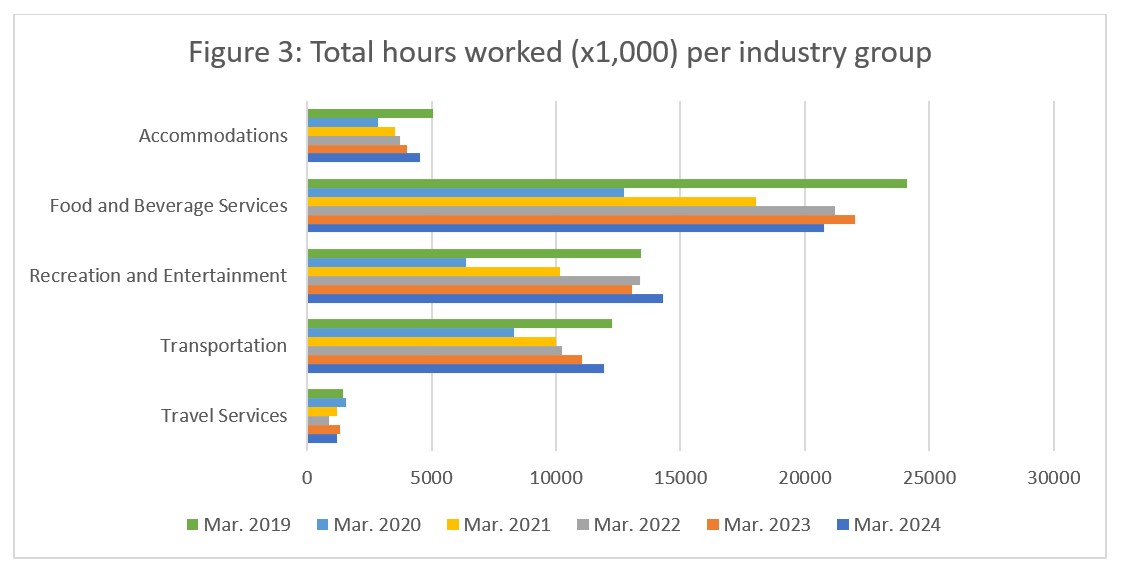
Total hours worked in accommodations has been increasing steadily year-on-year since 2020, with the increase from 2023 to 2024 being larger than that from 2022 to 2023, although the total remained below pre-pandemic levels. In food and beverage services, the total hours worked fell by around 6% from 2023 to 2024, likely reflecting the labour force challenges the industry has been grappling with in the past few months. Recreation and entertainment is the only industry group to surpass 2019 in terms of total hours worked, noting an increase of around 6.5%; this aligns with labour force growth over the same period. And although transportation has also seen labour figures higher than pre-pandemic levels in the past few months, the industry has not yet surpassed 2019 total hours worked (it remains around 2.5% below where it had been before the pandemic).
Unemployment
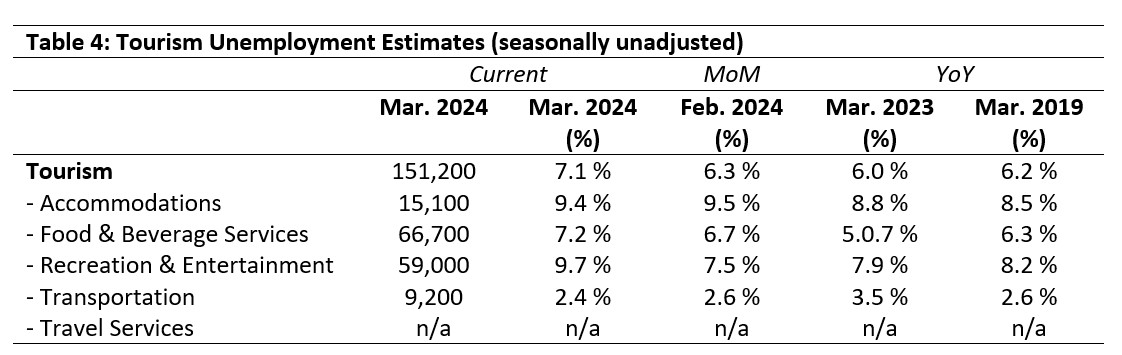
Unemployment[5] in the tourism sector in March 2024 was 7.1%, which was higher than the economy-wide national average of 6.4% (using seasonally unadjusted data). It was also higher than last month, last year, or March 2019. Table 4 provides a summary of tourism unemployment in March.
February 2024: Month-over-Month
The unemployment rate in accommodations held steady from February, which is unsurprising given the consistency in both labour force and employment month-over-month. Unemployment in food and beverage services was 0.5 percentage points higher, while recreation and entertainment saw a more substantial increase (+2.2 percentage points). Unemployment fell very slightly in transportation. No data was available for travel services.
March 2023 and 2019: Year-on-Year
The unemployment rates across most industry groups were higher than in March 2023, with the exception of transportation, which saw a decrease of just over 1 percentage point. This pattern held generally true relative to pre-pandemic unemployment rates as well: increases were generally between 0.9 and 1.5 percentage points, except for transportation, which was 0.2 percentage points lower.
Provincial Tourism Unemployment
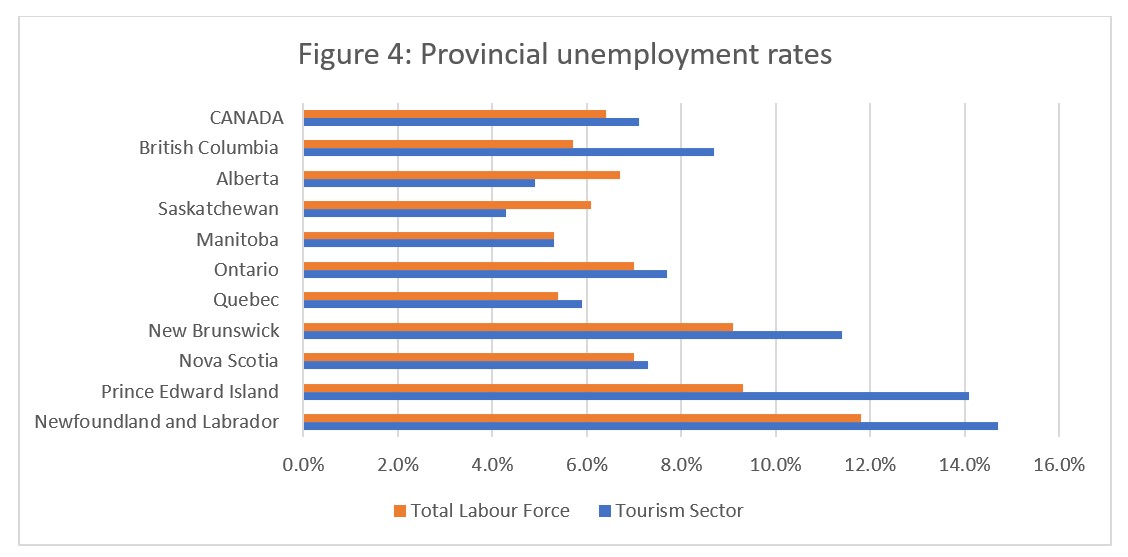
At the aggregate national level, unemployment in tourism was higher than across the wider economy (see Figure 4), and this generalization held true in most provinces as well. The gap between tourism and the wider provincial economy was most pronounced in Prince Edward Island (4.8 percentage points) and British Columbia (3.0 percentage points). In contrast, unemployment was lower in tourism than in the general economy in Saskatchewan and Alberta, and the two indices were even in Manitoba. The highest tourism unemployment rates were in Newfoundland and Labrador (14.7%) and Prince Edward Island (14.1%), and the lowest were in Saskatchewan (4.3%) and Alberta (4.9%).
View more employment charts and analysis on our Tourism Employment Tracker.
[1] As defined by the Canadian Tourism Satellite Account. The NAICS industries included in the tourism sector those that would cease to exist or would operate at a significantly reduced level of activity as a direct result of an absence of tourism.
[2] SOURCE: Statistics Canada Labour Force Survey, customized tabulations. Based on seasonally unadjusted data collected for the period of March 10 to 16, 2024.
[3] The labour force comprises the total number of individuals who reported being employed or unemployed (but actively looking for work). The total Canadian labour force includes all sectors in the Canadian economy, while the tourism labour force only considers those working in, or looking for work in, the tourism sector.
[4] Employment refers to the total number of people currently in jobs. Tourism employment is restricted to the tourism sector, while employment in Canada comprises all sectors and industries.
[5] Unemployment is calculated as the difference between the seasonally unadjusted labour force and seasonally unadjusted employment estimates. The percentage value is calculated against the labour force.