Tourism Workforce Accelerates After Sluggish Start to 2024
Overall, the tourism sector[1] in February saw increases over the previous month[2], with growth in employment (+2.6%) outpacing that in the labour force (+2.4%). The sector was in a stronger position than in February 2023, but remained around 1-2% below 2019 levels on both indices.
At the industry group level, the profile overall was fairly consistent, with a few industries showing different trends from the sector averages.
Table 1 provides a snapshot of tourism’s and its five industry groups’ performance across labour force, employment, and unemployment, as compared with January 2024 [MoM] and February 2023 [YoY], and with February 2019 as a pre-pandemic baseline. Small arrows represent changes of less than 1%, or one percentage point (pp) in the case of unemployment.
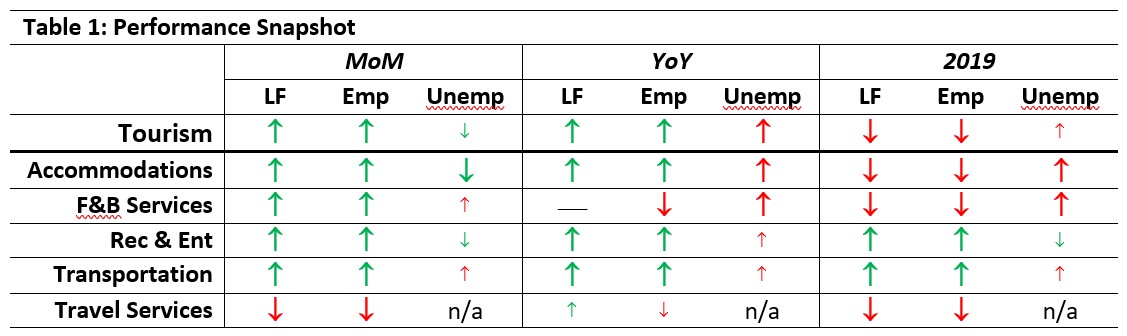
All industries showed month-over-month growth except for travel services, which shrank on both labour force and employment. Unemployment rates were variable across the industry groups. Compared to last year, most industries showed growth across labour force (except for food and beverage services, which was unchanged) and employment (except for decreases in food and beverage services and travel services).
Unemployment was higher across the board. Most industry groups were substantially below 2019 levels, except for recreation and entertainment and transportation, which saw growth in both labour force and employment. Unemployment was generally slightly higher than in February 2019.
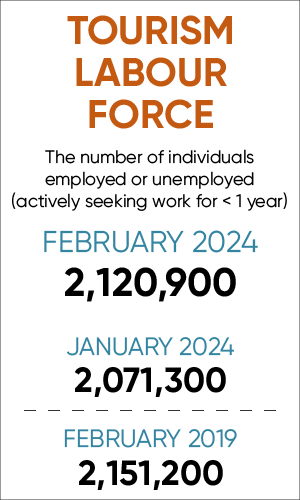
Tourism Labour Force
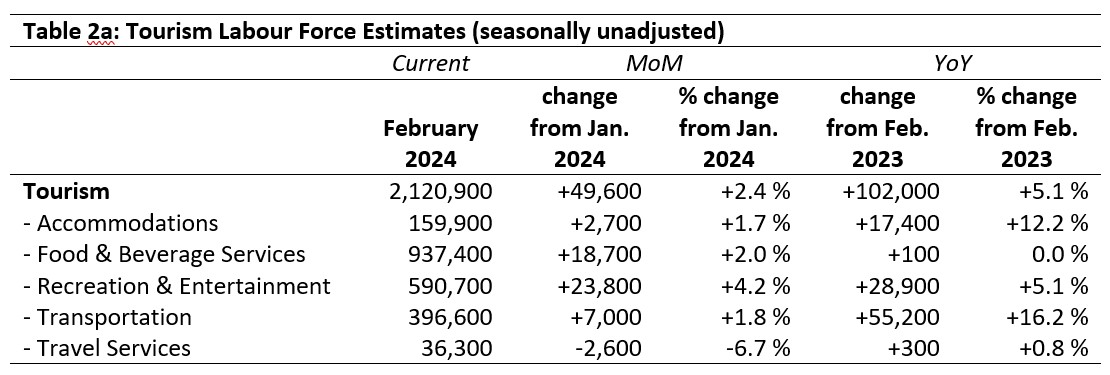
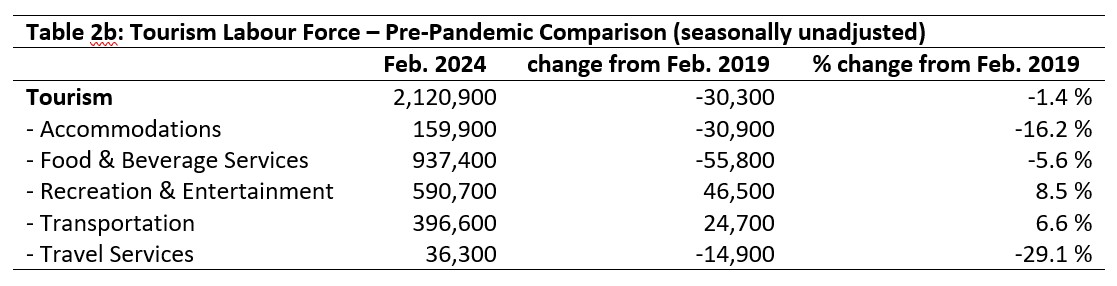
The tourism labour force[3] in February accounted for 9.9% of the total Canadian labour force, which was 0.2 percentage points higher than in January, but still below its pre-pandemic share. Overall, the sector’s labour force was 98.6% of its size in February 2019. Tables 2a and 2b provide a summary of the tourism labour force as of February 2024.
January 2024: Month-over-Month
The sector’s labour force grew by around 50,000 people from January, an increase of 2.4%. The biggest growth was in recreation and entertainment, which alone accounted for almost 24,000 people entering the workforce. Travel services saw a decrease of 6.7% from January, a loss of just over 2,500 people.
February 2023: Year-on-Year
The tourism labour force grew by over 100,000 people since last February, a gain of 5.1%. Food and beverage services alone remained essentially static, while accommodations (+12.2%) and transportation (+16.2%) showed substantial increases. Even travel services, which has been struggling to regain ground since the pandemic, showed a very slight gain over February 2023.
February 2019: Pre-pandemic Baseline
Overall, the tourism sector’s labour force had not yet returned to its pre-pandemic levels, although the gap has continued to narrow. At the industry level, three groups remained below 2019 levels: travel services, accommodations, and food and beverage services. In contrast, recreation and entertainment and transportation continued to post labour force engagement above 2019 levels, with both industry groups operating above 105% of February 2019.
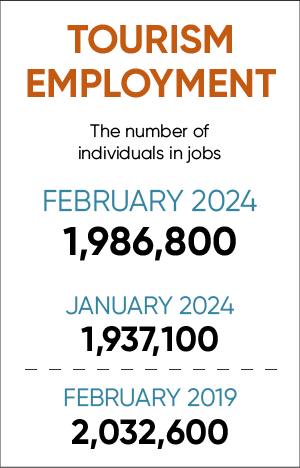
Tourism Employment
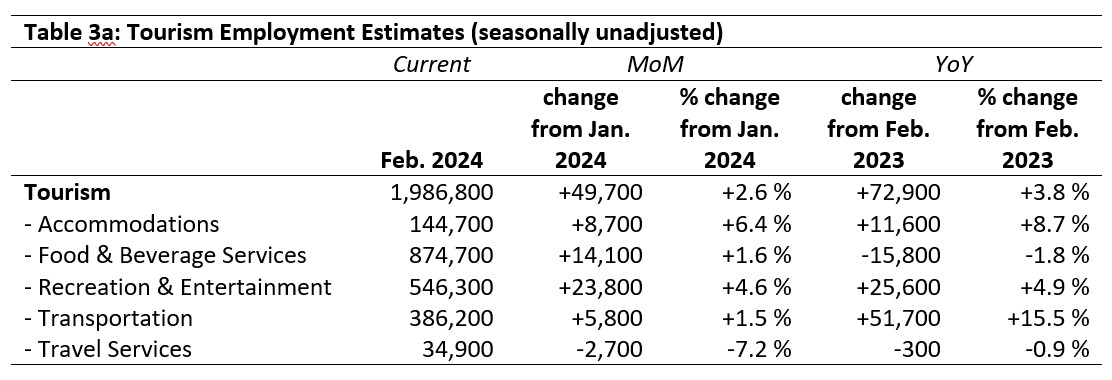
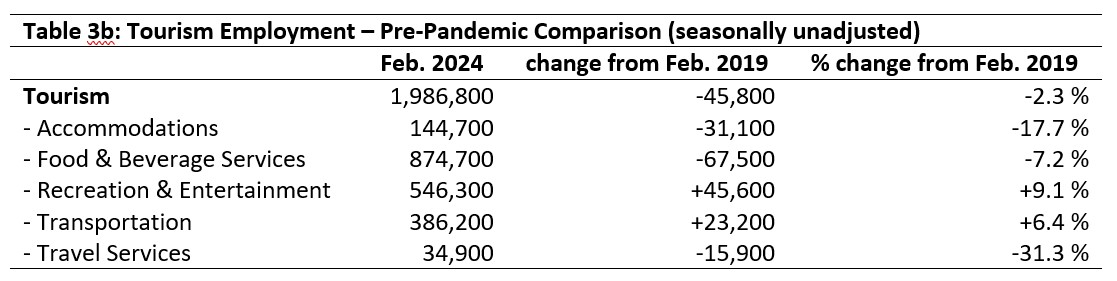
Tourism employment[4] accounted for 9.9% of all employment in Canada, with 9.3% of the total Canadian labour force working in a tourism industry. Tourism employment overall was 97.8% of what it was in 2019. Tables 3a and 3b provide a summary of tourism employment as of February 2024.
January 2024: Month-over-Month
As with the labour force, tourism employment in February was nearly 50,000 higher than the previous month, and most industry groups mirrored this aggregate increase. Accommodations saw the highest relative growth (+6.4%), while recreation and entertainment saw the largest absolute increase (+23,800). Travel services lost around 2,700 employees, a drop of 7.2%.
February 2023: Year-on-Year
Tourism employment saw gains of nearly 73,000 people since the previous February. The majority (51,700) of these new employees were in transportation, which grew by 15.5% on last year. Accommodations also saw substantial growth. In contrast, food and beverage services saw a net decrease of nearly 16,000 workers, and travel services fell by nearly 1%.
February 2019: Pre-pandemic Baseline
Employment in tourism industries remained around 2.3% below where it was in 2019, representing a net loss of around 46,000 employees. This net change was not evenly distributed across the sector: recreation and entertainment and transportation saw substantial increases (a combined growth of nearly 70,000 people), which offset the magnitude of losses across food and beverage services, accommodations, and travel services (a combined loss of nearly 115,000). Travel services in particular has remained depressed, with nearly a third of its 2019 workforce having left employment in the industry.
Part-time vs. Full-time Employment
The ratio of part-time to full-time workers across time provides a useful perspective on the stability of the labour force. As a sector, tourism has historically made good use of part-time employment, although the part-time share of the workforce varies by industry group.
Figure 1 provides an overview of the percentage of part-time employment across the industry groups. These ratios use Statistics Canada’s definition of full-time employment as 30 hours per week or more, and part-time employment as fewer than 30 hours per week.
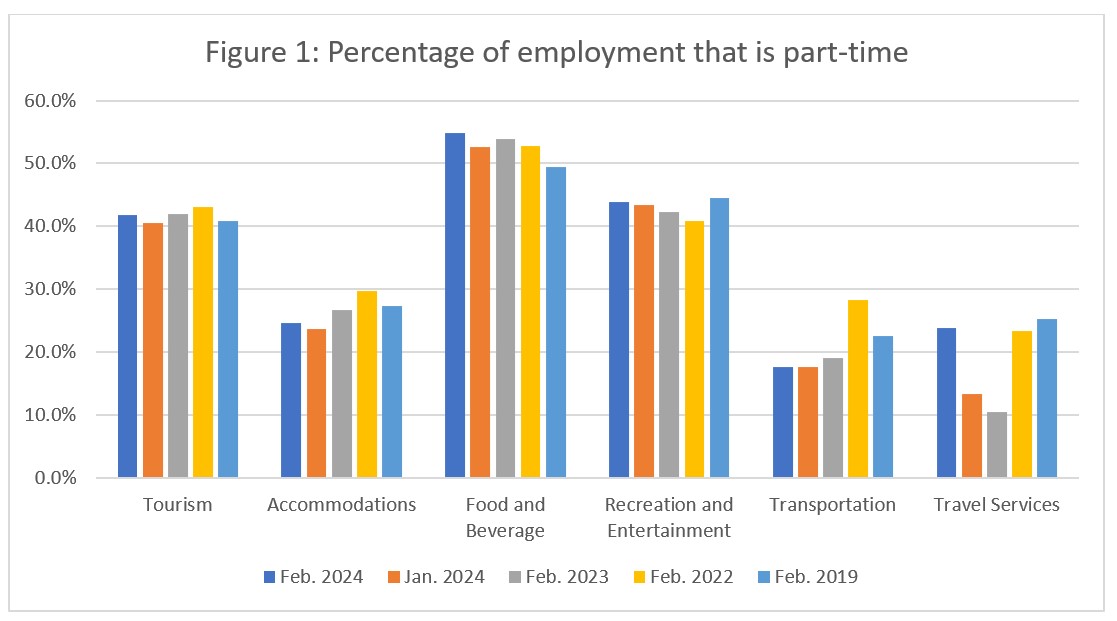
Part-time tourism employment in February has generally tended to be around 40% of all tourism employment. February 2024 saw a slight increase from January (+1.4 percentage points) to 41.8%, and indeed most industry groups also saw an increase in part-time employment over this same period. The effect was most pronounced in travel services, which saw a jump of over 10 percentage points. Less pronounced, but representing a substantially larger number of people, was food and beverage services, which saw an increase of 2.2 percentage points. The increases were smaller for accommodations and recreation and entertainment, and transportation held steady. As the LFS reference week in January was early enough that some post-secondary students may not yet have returned to full-time studies, these shifts may represent students scaling back their hours in February to accommodate their academic schedules.
Looking at general trends across the years, accommodations seemed to be settling at a slightly lower rate of part-time employment than what it had in 2019, as was transportation, while food and beverage services seemed to be increasingly relying on its part-time workforce. Travel services seemed to be returning to its pre-pandemic ratio, although it is important to note that this industry group has lost a substantial percentage of its workforce since 2019, so although the part-time ratio may be returning to pre-pandemic ‘normal’, this does not mean that the industry group overall is in a stable position.
Hours worked
The total actual hours worked within the tourism sector is another useful metric by which to assess the health of the labour market (see Figure 2). For industries particularly reliant on part-time work, it is easy for businesses to lower the total hours worked without having to change their roster of employees, making this index more responsive to short-term changes in demand than raw employment figures alone.
The total hours worked in tourism industries grew slightly on January (around 2.2%), commensurate with changes in employment. The hours worked were also higher than in February 2023 (+3.1%), but still around 4.6% below 2019 hours worked in February. Figure 2 shows that the gap between 2023 and 2019 narrowed in the second half of the year, so it remains to be seen if this early growth on 2023 reflects a trend that will persist.
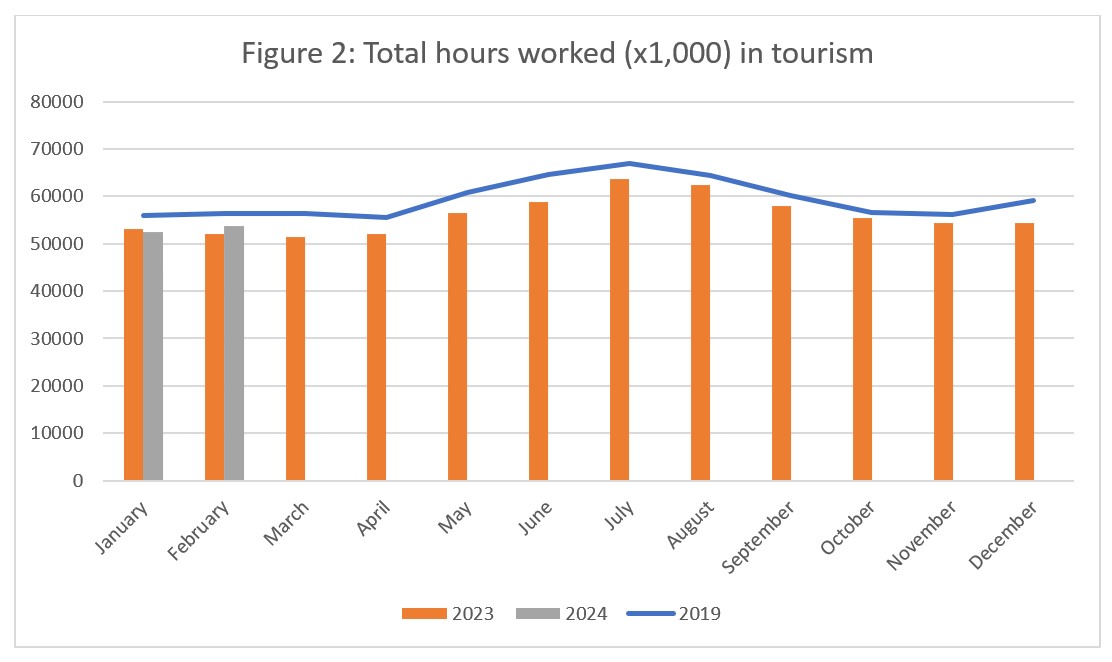
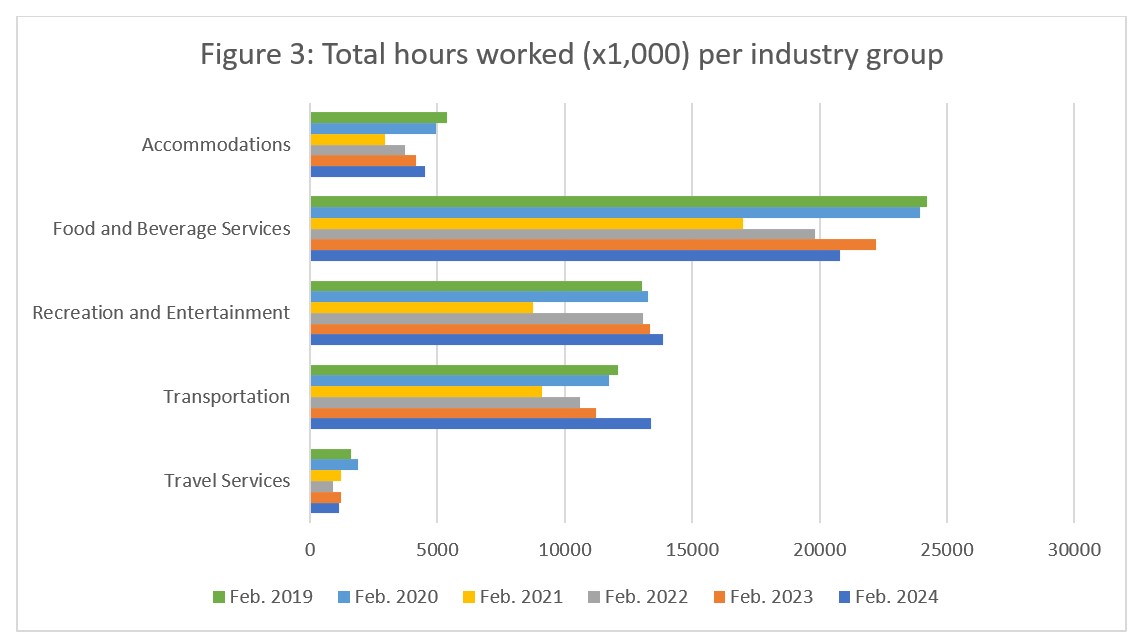
Figure 3 breaks down the total hours worked across the sector into its constituent industry groups, and provides a year-over-year comparison starting in 2019. Because COVID-19 had not yet taken a global hold in February 2022, the light green (2019) and light blue (2020) bars show that, for most industries, 2020 represented an overall decrease on total number of hours worked, suggesting that the sector was beginning to contract even before the pandemic disrupted everything.
Recreation and entertainment and travel services alone saw growth in hours worked. Recreation and entertainment has since surpassed 2020 hours worked, as has transportation, while travel services has remained substantially depressed. Food and beverage services, the largest employer among the five industry groups, saw a rapid increase in hours worked from 2021 through to 2023 as the sector reopened, but it contracted substantially from February 2023 to February 2024. This aligns with the previous observations around labour force and employment relative to last year, and raises questions about why this industry group’s path to recovery remains so challenging.
Unemployment
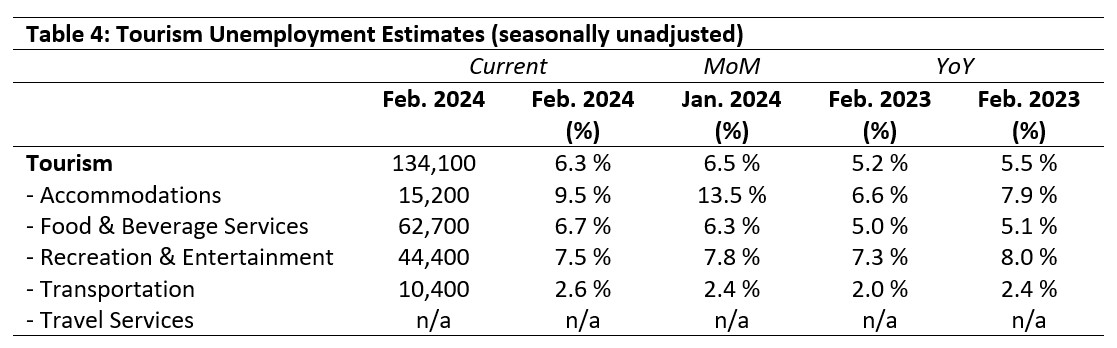
Unemployment[5] in the tourism sector in February 2024 was 6.3%, which was slightly higher than the economy-wide average of 6.0% (using seasonally unadjusted data). This was also slightly lower than in January, but a full percentage point higher than in February 2023, and nearly a full point higher than in 2019 as well. Table 4 provides a summary of tourism unemployment in February.
January 2024: Month-over-Month
The unemployment rate across two industries fell from January, with accommodations showing the largest drop (4 percentage points) and recreation and entertainment showing a more modest fall of 0.3 percentage points. Transportation saw a slight increase (+0.2 percentage points) and the rate in food and beverage services likewise rose slightly (+0.4 percentage points). There was no data available for travel services.
February 2023 and 2019: Year-on-Year
The unemployment rate in recreation and entertainment was half a percentage point lower than it was in February 2019, but slightly higher than in 2023, although it stayed within the same broad range. Similarly, transportation posted slightly lower unemployment rates in 2019 and 2023, but retained its position at the bottom of the scale across the industry groups. Unemployment in food and beverage services grew by over 1.5 percentage points relative to last year and 2019, while accommodations saw the largest rise in its unemployment rate (+2.0 percentage points since 2023, and +1.6 percentage points over 2019 rates).
Provincial Tourism Unemployment
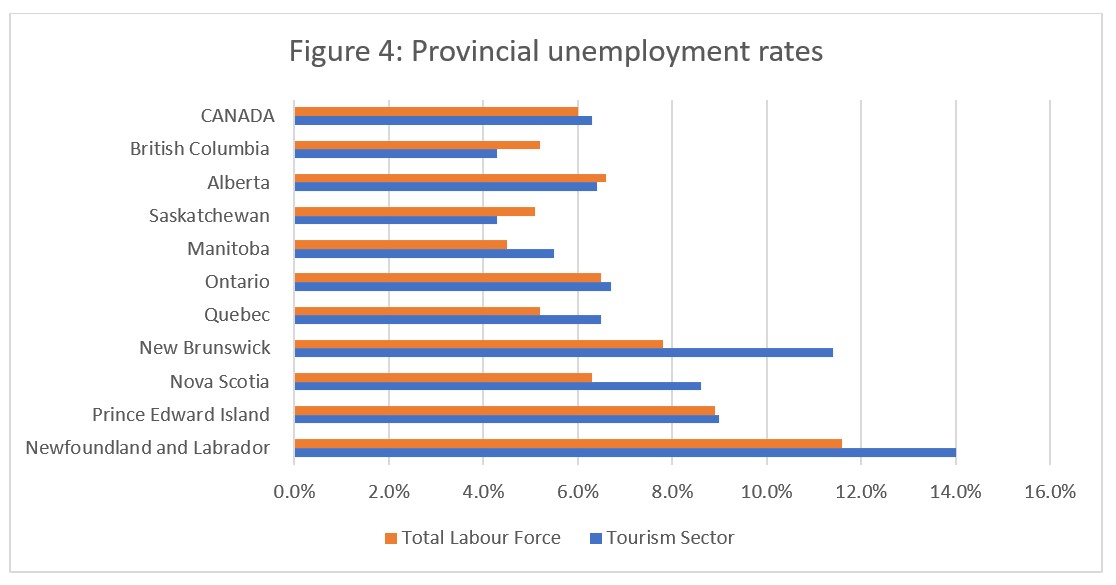
At the aggregate national level, unemployment in tourism was slightly higher than across the wider economy (see Figure 4). There was a marked east-west difference in tourism unemployment in February, with rates considerably higher in the Atlantic provinces than elsewhere in the country.
Tourism unemployment rates were generally higher than those of the broader provincial economies, except in British Columbia, Alberta, and Saskatchewan. The highest tourism unemployment rates were in Newfoundland and Labrador (14.0%) and New Brunswick (11.4%), and the lowest were in British Columbia and Saskatchewan (both at 4.3%).
View more employment charts and analysis on our Tourism Employment Tracker.
[1] As defined by the Canadian Tourism Satellite Account. The NAICS industries included in the tourism sector those that would cease to exist or would operate at a significantly reduced level of activity as a direct result of an absence of tourism.
[2] SOURCE: Statistics Canada Labour Force Survey, customized tabulations. Based on seasonally unadjusted data collected for the period of February 11 to 17, 2024.
[3] The labour force comprises the total number of individuals who reported being employed or unemployed (but actively looking for work). The total Canadian labour force includes all sectors in the Canadian economy, while the tourism labour force only considers those working in, or looking for work in, the tourism sector.
[4] Employment refers to the total number of people currently in jobs. Tourism employment is restricted to the tourism sector, while employment in Canada comprises all sectors and industries.
[5] Unemployment is calculated as the difference between the seasonally unadjusted labour force and seasonally unadjusted employment estimates. The percentage value is calculated against the labour force.