Tourism Sector Stumbles into August
Outside of the pandemic-dominated years, the labour force in August has tended to fluctuate between a slight increase or a slight decrease over the previous month, with changes typically within ±3%.
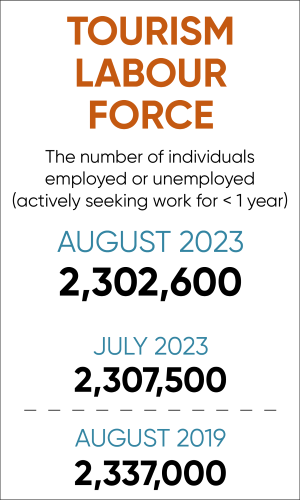
This August, the tourism sector[1] saw a slight drop relative to July[2], with a larger fall in employment than in the labour force. Compared to last year, both labour force and employment were in a stronger position, although the sector remained below 2019 levels.
At the industry group level, the sector profile showed a bit more variability, with most industry groups posting a weaker performance than in July. Table 1 provides a snapshot of the industry groups’ performance across labour force, employment, and unemployment, as compared with July 2023 [MoM], August 2022 [YoY], and with August 2019 as a pre-pandemic baseline. Small arrows represent changes of less than 1%.
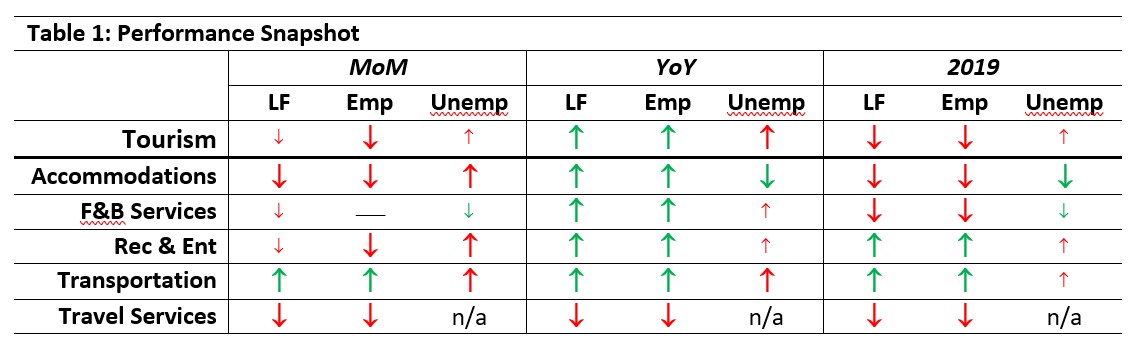
Transportation alone was in a stronger position on labour force and employment relative to July, with all other industries showing some degree of contraction. Both indices were healthier when compared to August 2022 (YoY), except in travel services, which continued to show a smaller pool of workers. Recreation and entertainment and transportation continued to show growth over 2019, with all other industry groups remaining below this pre-pandemic baseline. Unemployment was higher than last month, but not much changed relative to August 2019.
Tourism Labour Force
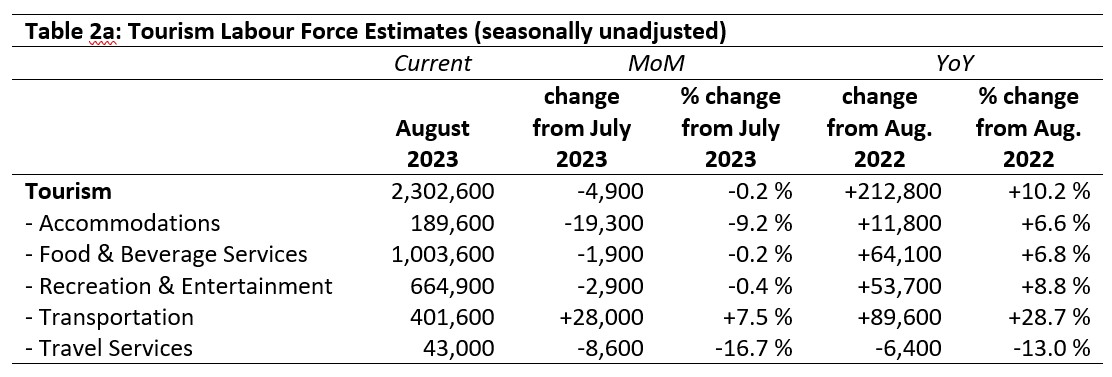
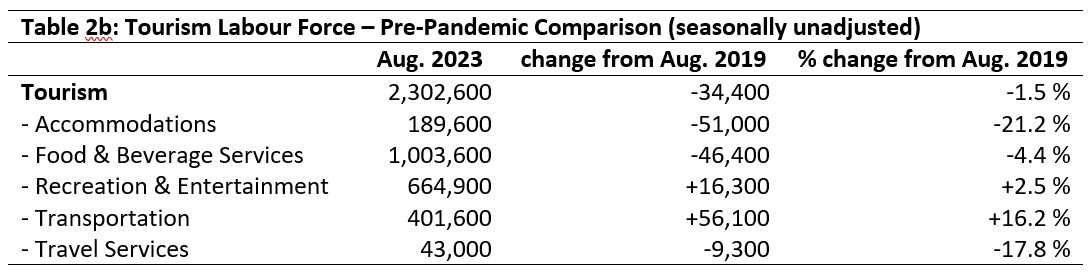
The tourism labour force[3] in August 2023 accounted for 10.6% of the total Canadian labour force, on par with last month but still below the pre-pandemic share of 11.3% in August 2019. Tables 2a and 2b provide a summary of the tourism labour force as of August.
July 2023: Month-over-Month
The transportation labour force saw a substantial increase over the previous month, gaining 28,000 new people, the only gain across the sector (+7.5%). Conversely, the largest losses were in travel services (a relative fall of 16.7%) and accommodations (losing nearly 20,000 people from the labour force). Food and beverage services and recreation and entertainment saw only modest changes, remaining essentially unchanged through the end of summer. Given this split between industries shrinking and showing stability, it is worth noting that both of the ‘stable’ industries tend to rely on part-time workers drawn from a younger demographic, while the two that have shrunk rely more on older workers and on full-time employment.
August 2022: Year-on-Year
Most industries saw an increase in labour force relative to last year, with only travel services showing a net loss of 6,400 people (-13%). The largest gains were seen in transportation, where an additional 89,600 people saw the industry grow by nearly 30%. Other industry groups saw more modest increases, but the sector as a whole is in a generally stronger position than it was in August 2022.
August 2019: Pre-pandemic Baseline
At the sector level, tourism was not far below its pre-pandemic labour force levels, averaging out to a net deficit of around 35,000 workers (-1.5%)—but the pattern within the industry groups was more varied. Accommodations in particular was substantially below 2019 levels, with a loss of 51,000 people (-21.2%), as was travel services (9,300 people short, -17.8%). Although food and beverage services showed a large absolute loss, its relative size was moderate (-4.4%). Recreation and entertainment posted a small gain (+2.5%), while transportation showed a much stronger performance (+16.2%). This is the third month in a row that transportation has surpassed pre-pandemic labour force counts.
Tourism Employment
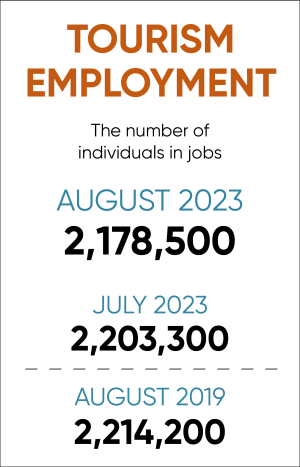
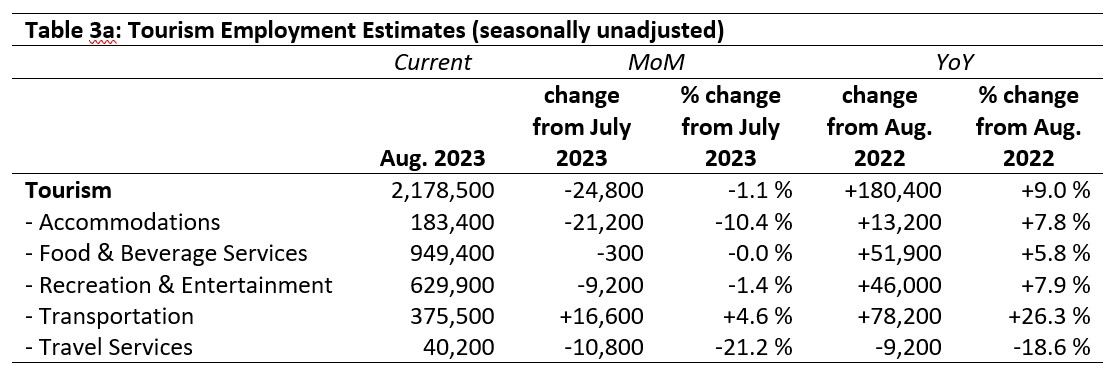
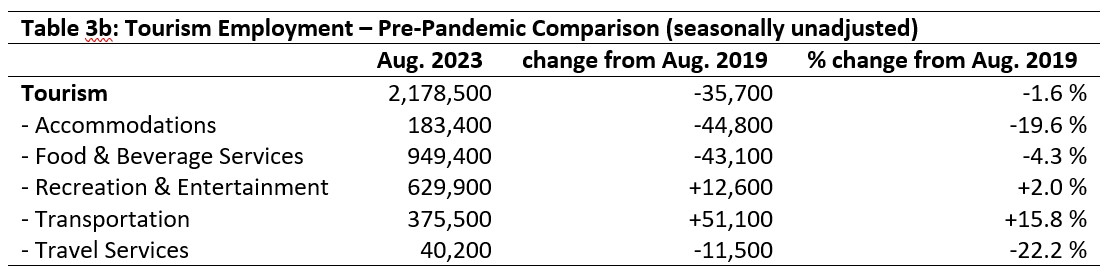
Tourism employment[4] accounted for 10.7% of all employment in Canada, employing 10.0% of the total Canadian labour force. This was slightly below the rates seen in July, but higher than those seen in August 2022. Employment remained overall below the pre-pandemic levels seen in August 2019. Tables 3a and 3b provide a summary of tourism employment as of August 2023.
July 2023: Month-over-Month
The sector as a whole saw a modest decrease in employment from July (-1.1%), although this sector-level stability masks substantial differences at the industry-group level. Accommodations saw a drop of 10.4%, while travel services saw a drop of 21.2%—these figures are not out of step with labour force estimates, although they are slightly higher, suggesting increased unemployment alongside people leaving the industry altogether. Food and beverage services showed virtually no change from July, while recreation and entertainment saw a slight fall. Transportation saw the largest increase, adding 16,600 new workers in employment, which was substantially smaller than the increase in the labour force—unemployment has similarly grown in this industry. Please see the final section of this report for an occupation-level look at the transportation industry group.
August 2022: Year-on-Year
With the exception of travel services (-9,200 workers, slightly smaller the industry’s loss in labour force), all industry groups were in a stronger position this year than last year. The largest growth was unsurprisingly in transportation, while accommodations, food and beverage services, and recreation and entertainment saw growth of between 5% and 10%. On the whole, the sector has continued the general trajectory of improvement year-over-year, in spite of month-over-month stumbles.
August 2019: Pre-pandemic Baseline
Employment in tourism remained below pre-pandemic levels in August, although the gap continues to narrow gradually—at the sector level, employment was only 1.6% below August 2019 rates. As noted in the labour force analysis, this masked volatility between different industries, with accommodations and travel services posting large relative losses (-19.6% and -22.2% respectively), and food and beverage services showing substantial absolute losses (-43,100 employees). Recreation and entertainment saw modest growth, and transportation again showed impressive gains.
Part-time vs. Full-time Employment
With employment in a few industries falling in August, it is interesting to look at the distribution of part-time to full-time work as another parameter that can reflect changing patterns of employment. Figure 1 provides an overview of the percentage of part-time employment across the industry groups, using Statistics Canada’s threshold of 30 hours per week as the definition of full-time employment.
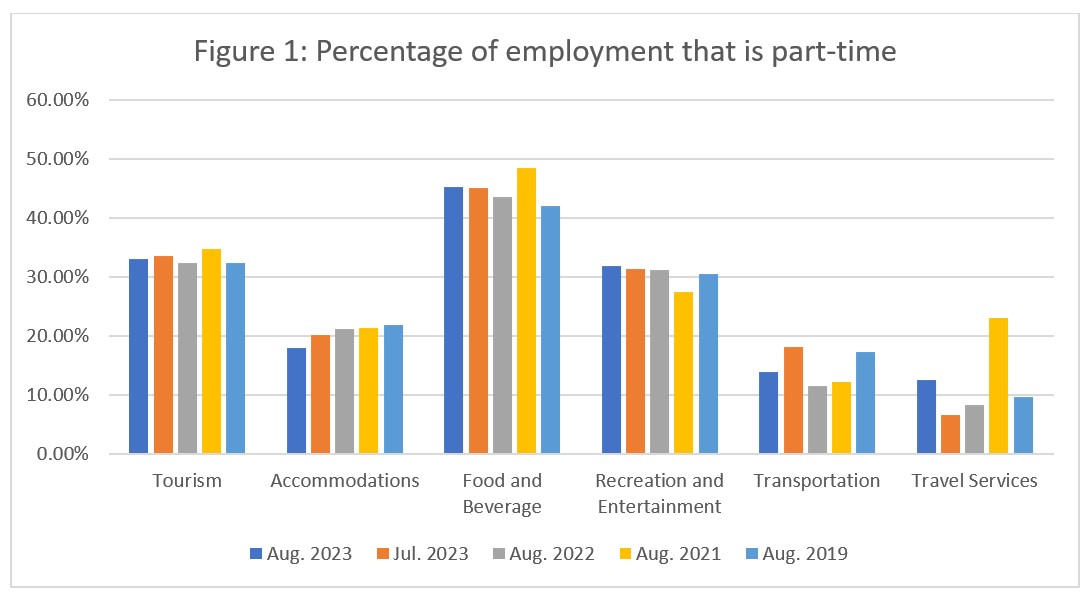
At the sector level, the ratio of part-time to full-time work changed very little from July, and has stayed relatively static over the past few years. Accommodations saw a further decrease from July in part-time work (indicated in Figure 1 as a drop in part-time work), and the work pattern for August has shifted by about 4% since 2019. Transportation likewise saw a substantial shift away from part-time work, suggesting that the increase in employment has been primarily in full-time positions. Food and beverage services saw a slight increase in part-time work on the previous month, and the share of part-time work has increased by 3% since 2019. The pattern was similar in recreation and entertainment, although the increase on 2019 was less pronounced. Travel services saw quite a big jump in part-time employment from July (around 6%), and a smaller but important increase on August 2019 (around 3%); as the industry group loses employees, more people are taking on full-time hours.
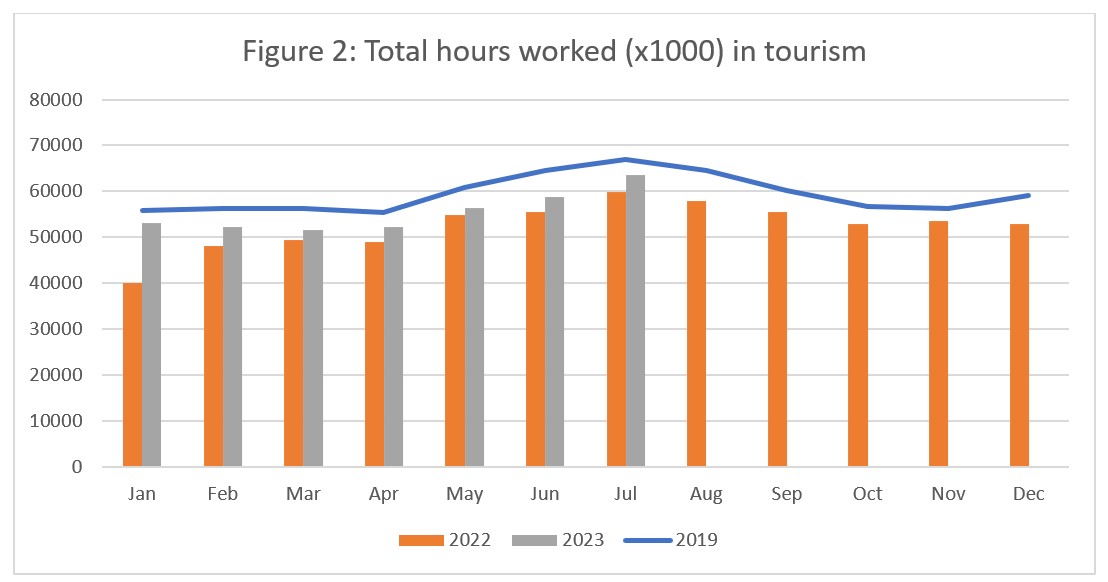
Hours worked
The total actual hours worked within the tourism sector is another useful metric by which to assess the health of the labour market (see Figure 2). From July, there was a drop of 1.8% in the total number of hours worked, which was larger than the aggregate drop in employment (1.1%; Table 3a), although the difference was not enormous, and likely reflects the uneven distribution in employment changes across the different industry groups. The drop from July in 2023 was smaller than that seen in 2019, meaning the gap between pre-pandemic norms and the current state of employment in the sector continues to narrow. However, as noted above, August figures have historically tended to fluctuate relative to August, with some years showing slight increases and others slight decreases, so it is too soon to tell if this signals an overall gain on previous years, or if this is simply normal variation. Hours worked in September will provide an indication of how to best interpret the figures from August.
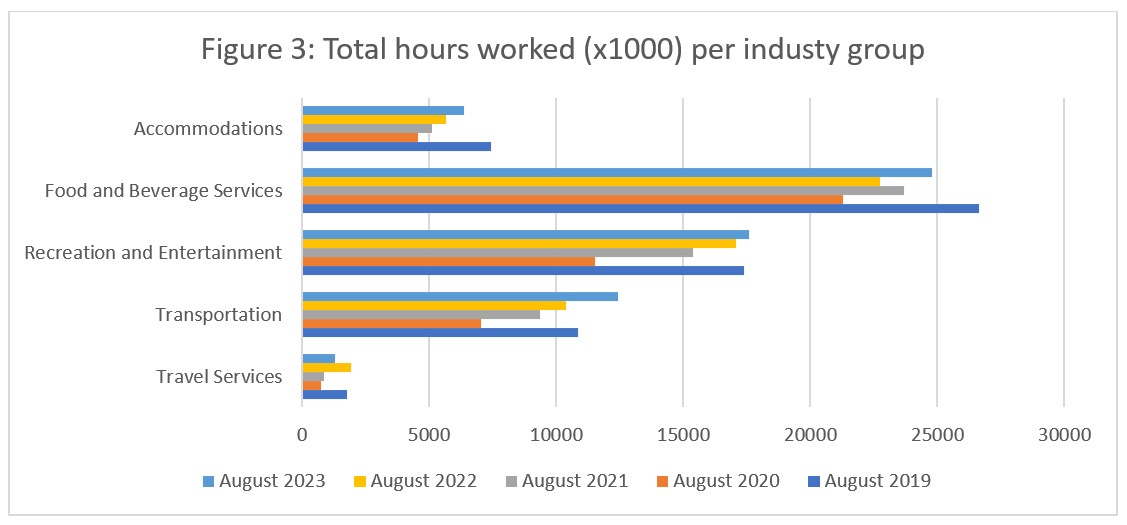
At the industry level (see Figure 3), total hours worked increased on last year for all industry groups except travel services, which saw a drop of around 30%—this tallies with the data discussed above on falling employment rates and the shift towards increased part-time work. Accommodations and food and beverage services posted fewer hours worked than in August 2019, while recreation and entertainment and transportation had surpassed the August 2019 benchmark, with transportation having the greatest increase. Again, this is unsurprising given the increase in employment for this industry.
Unemployment
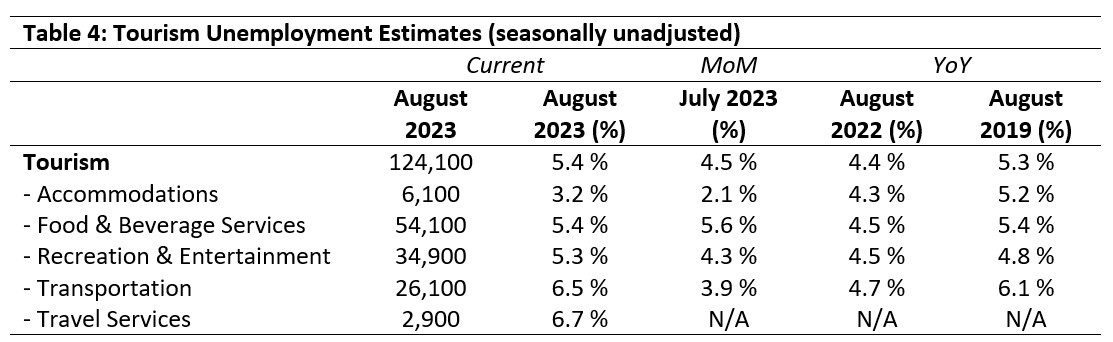
Unemployment[5] in the tourism sector in August 2023 was 5.4%, which was below the national economic average of 6.3% (using seasonally unadjusted data). It was higher than in July, but comparable to the unemployment rate seen in August 2019. Table 4 provides a summary of tourism unemployment across the industry groups in August.
July 2023: Month-over-Month
Unsurprisingly, given the shifts in employment in August, unemployment rates mostly rose from July, with the exception of food and beverage services, which saw a very slight (-0.2%) drop. The highest unemployment rate was reported in travel services, followed by transportation, where additions to the labour force were substantially higher than growth in employment in August. Unemployment in accommodations remained low.
August 2022 and 2019: Year-on-Year
Although unemployment in tourism was one percentage point higher this August than it was in 2022, it was comparable to the rate seen in 2019—and this holds broadly true to most industry groups as well, although accommodations was two points lower than in August 2019. The fact that sector and industry unemployment rates have largely returned to patterns quite similar to those seen pre-pandemic suggests a degree of stability may be returning to the sector, in spite of lower overall employment.
Provincial Tourism Unemployment
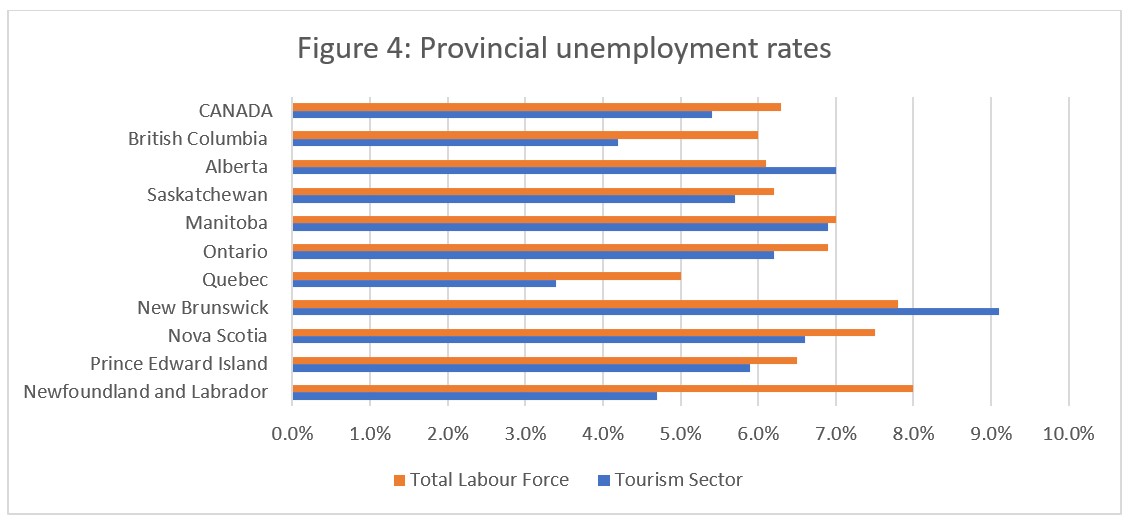
At the aggregate national level, unemployment in tourism was nearly a full percentage point below that of the wider economy (see Figure 4), a pattern that held across most of the provinces. Tourism unemployment was higher than the economy-wide average in Alberta and in New Brunswick, while the difference between the wider economy and tourism was most pronounced in Newfoundland and Labrador (tourism = 4.7%, general economy = 8.0%), where the seasonality of the sector is particularly pronounced. Tourism unemployment was lowest in Québec (3.4%) and British Columbia (4.2%), and highest in New Brunswick (9.1%).
A Closer Look at Transportation
The transportation industry is the third-largest group in the sector, and spans an impressive range of domains (air, water, road, rails). Because it has seen such substantial growth from July to August this year, it is worth taking a more in-depth look at some of the key occupations, to understand where these increases had the most impacts.
Data Limitations
It is only recently that Tourism HR Canada began purchasing occupation-level data from Statistics Canada as part of the Labour Force Survey (LFS) release, so this is the first report that includes occupation-specific details (using National Occupation Classification [NOC] codified occupations). It is also worth noting that the identification of ‘tourism occupations’ is a matter of some debate in the sector: Tourism HR Canada generally uses the Tourism Satellite Account definition, although we have added some additional occupations in hopes of capturing a more representative sampling of the tourism employment landscape. In spite of these inclusions, it is not possible to wholly capture all of the occupations that constitute the sector—or indeed any of its constituent industry groups—so the approach taken here is to consider certain key occupations in the industry, for which there is sufficient data to make observations. The omission of any particular occupation from this discussion does not indicate a principled exclusion of that occupation from the tourism sector, but rather reflects the methodological limitations associated with the data set at hand. Finally, the data purchased does not go as far back as that of the general LFS, so a full pre-pandemic comparison is unfortunately not possible—but understanding even short-term changes provides a useful perspective on the industry.
Transportation Occupations
Employment estimates across 13 occupations in transportation are provided in Table 5, covering July and August 2023. Because of the nature of the LFS, only employment data is available at the occupation level, so it is not possible to consider labour force or unemployment through this lens.

A quick comparison between Table 5 and Table 3a (above) shows that this list of transportation occupations is not exhaustive: the total employment for August 2023 in transportation was estimated to be 375,500, while this list of occupations accounts for only 69% of that total employment, and only 57% of the net change month-over-month. The remaining 31% of transportation employment must be in occupations that are not strictly speaking ‘transportation jobs’, although they are based in transportation organizations and enterprises (e.g., marketing, HR, administration). In this data set, it is not possible to separate occupations by industry group, so these occupations cannot be included in a discussion of the transportation industry group without over-including all instances of those occupations that are based in other industries (i.e., accommodations, food and beverage services, recreation and entertainment, travel services). It interesting to note, however, that these non-transportation occupations within the industry account for 43% of the employment growth.
Limiting the discussion to the data at hand, the occupation with the largest absolute employment gains from July 2023 was taxi and limousine drivers and chauffeurs (+12,600, or +25%). This may seem counter-intuitive, but this NOC code includes drivers in the gig economy (e.g., Uber, Lyft). Bus drivers, subway operators and other transit operators also saw gains (+3,300; +5%), as did airline ticket and service agents (+3,300; +26%). Ticket agents and customer service occupations also saw substantial increases in employment (airline ticket and service agents +26%; ground and water transport ticket agents, cargo service representatives and related clerks +27%, respectively).
The largest employment losses were both in the air transport sub-group, with air pilots, flight engineers and flying instructions seeing a drop of 21% (-4,200 people) and pursers and flight attendants dropping by 22% (-4,100 people). Unless these trends are reversed in short order, the airline industry will continue to face mounting difficulties in maintaining reliable service in Canada, in spite of increases in ground-based and customer service staff. This will likely cast a long shadow over the tourism sector as a whole, as the scale and geography of the country makes airline travel almost unavoidable in all but the most local of trips, and serves as a key entry point for many international visitors.
View more employment charts and analysis on our Tourism Employment Tracker.
[1] As defined by the Canadian Tourism Satellite Account. The NAICS industries included in the tourism sector those that would cease to exist or would operate at a significantly reduced level of activity as a direct result of an absence of tourism.
[2] SOURCE: Statistics Canada Labour Force Survey, customized tabulations. Based on seasonally unadjusted data collected for the period of August 13 to 19, 2023.
[3] The labour force comprises the total number of individuals who reported being employed or unemployed (but actively looking for work). The total Canadian labour force includes all sectors in the Canadian economy, while the tourism labour force only considers those working in, or looking for work in, the tourism sector.
[4] Employment refers to the total number of people currently in jobs. Tourism employment is restricted to the tourism sector, while employment in Canada comprises all sectors and industries.
[5] Unemployment is calculated as the difference between the seasonally unadjusted labour force and seasonally unadjusted employment estimates. The percentage value is calculated against the labour force.