Labour Market Stays Strong as Summer Comes into Season
Summer is a peak season for tourism in Canada (with the obvious exception of winter pursuits), and as the season heats up, it is in encouraging to see the labour market for the sector staying strong.
Overall, the tourism sector[1] in July saw consistent improvement over the previous month[2], with increases in both labour force and employment, and a slight drop in unemployment. Compared to last year, labour force and employment were also in stronger positions, although the sector remained below 2019 levels.
At the industry group level, the profile overall was generally positive, with the exception of transportation, which saw both a drop in employment and a rise in unemployment. Table 1 provides a snapshot of the industry groups’ performance across labour force, employment, and unemployment, as compared with June 2023 [MoM], July 2022 [YoY], and with July 2019 as a pre-pandemic baseline. Small arrows represent changes of less than 1%.
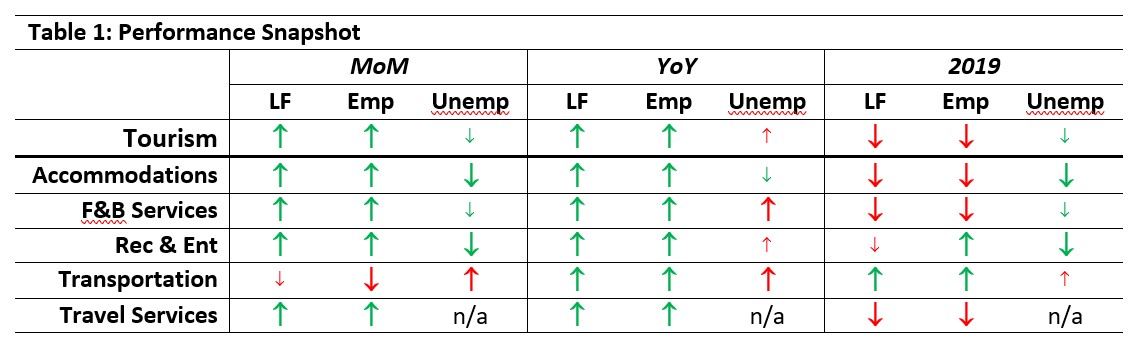
Other than transportation, all industry groups were in a stronger position than they were last month or last year, with substantial increases in both labour force and employment. The unemployment picture was better with respect to June than it was with July 2022, although 2022 figures could have been distorted by the effects of pandemic-related restrictions. Compared to 2019, the sector as a whole remained depressed, but recreation and entertainment and transportation showed some improvement.
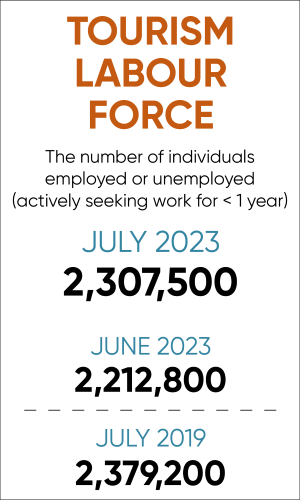
Tourism Labour Force
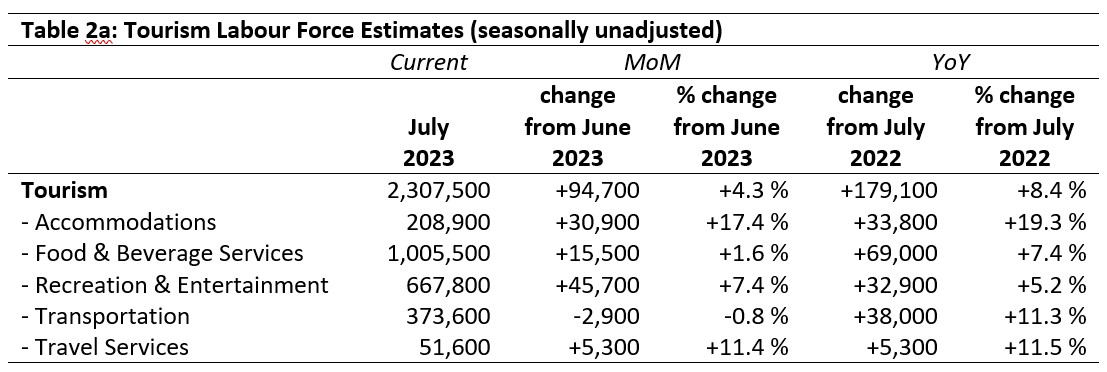
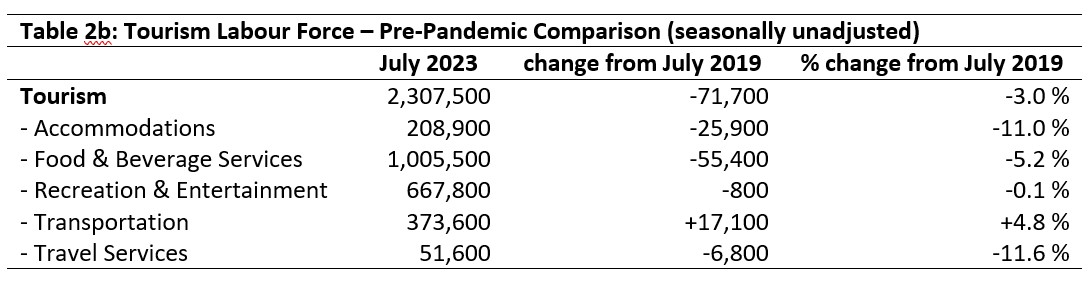
The tourism labour force[3] in July 2023 accounted for 10.6% of the total Canadian labour force, slightly higher than last month (10.2%) and last year (10.1%), but below the pre-pandemic share of 11.6%. Tables 2a and 2b provide a summary of the tourism labour force as of July.
June 2023: Month-over-Month
Transportation saw a small decrease in labour force from June (less than 1%), while all other industry groups saw growth. Accommodations gained over 30,000 workers, the strongest relative gain across the industries (+17.4%). Recreation and entertainment saw the largest absolute gain (+45,700). Interestingly, food and beverage services only saw a very modest increase of 1.6%, substantially out of line with the other industries. Last month’s LFS also reported poor performance for food and beverage services, suggesting that this is not just a timing mismatch (high school students re-entering the workforce later than university students), but rather a possible signal of a labour slowdown in this industry group.
July 2022: Year-on-Year
Across the board, all industry groups had a much stronger labour force than last year. The sector as a whole saw an increase of 8.4% (nearly 180,000 workers), with all industry groups showing gains. Accommodations had the greatest relative gains (+19.3%), while recreation and entertainment saw the smallest relative gains (+5.2%). Even food and beverage services, which has not been showing the same strength as the other industry groups over the past few months, had 69,000 more workers in its labour force than this time last year.
July 2019: Pre-pandemic Baseline
The sector remained below pre-pandemic levels in its labour force, although the transportation industry has gained over 17,000 workers (+4.8%) relative to July 2019. Deficits were particularly pronounced in accommodations and in travel services, both of which remained more than 10% below 2019 levels. In absolute terms, food and beverage services remained the most depressed.
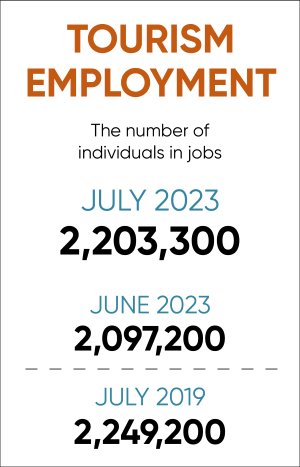
Tourism Employment
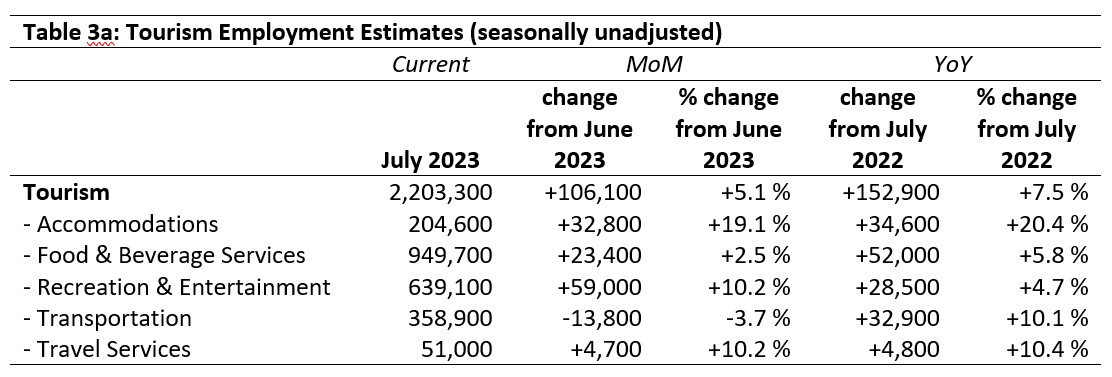
Tourism employment[4] accounted for 10.8% of all employment in Canada, and employed 10.2% of the Canadian labour force. This was higher than June and last July on both counts, but still below July 2019—the sector’s share of employment has continued to grow over the past few years, but has not passed the pre-pandemic baseline. Tables 3a and 3b provide a summary of tourism employment as of July 2023.
June 2023: Month-over-Month
Tourism gained over 100,000 workers since June (+5.1%), with most industry groups seeing an increase in employment. Transportation alone saw a slight fall, more substantial than its drop in labour force (see Table 2a, above), which is also reflected in unemployment figures (see Table 4, below). It’s not immediately obvious why this sector has seen these decreases, although it may be related to the end of the school year in late June. Food and beverage services likewise saw only a modest increase in employment, in line with its change in labour force. Accommodations saw the strongest growth in employment (+19.1%), followed by recreation and entertainment and travel services (both +10.2%).
July 2022: Year-on-Year
All industry groups showed substantial gains on last year, with the sector overall having grown by over 150,000 employees relative to July 2022. Accommodations posted the largest relative increase (+20.4%, nearly double the next largest increase), suggesting that this industry group is stabilizing its trajectory of recovery, as we have seen over the past few months. Although absolute numbers are small, travel services has continued to improve as well, which is encouraging given the ease with which travellers can make their own arrangements through online services. It may be that uncertainties around weather and environmental issues are making travellers look for more security in their travel plans, or that people are making more complex plans that benefit from professional support.
July 2019: Pre-pandemic Baseline
In employment, two industry groups surpassed 2019 levels: transportation was up 4.4% and recreation and entertainment was up 1.3%. At the aggregate level, the sector remained 2% below pre-pandemic baseline employment, with travel services (-12.4%), accommodations (-8.7%), and food and beverage services (-4.3%) lagging. Transportation and recreation and entertainment were both above 2019 levels in June as well, suggesting that these figures represent industry stabilization rather than seasonal fluctuations. Recreation and entertainment in particular has been performing above 2019 levels for several months.
Part-time vs. Full-time Employment
As noted in the previous LFS report, summer employment in tourism is often marked by a shift towards full-time employment as students take on additional hours while they are off school. Figure 1 provides an overview of the percentage of part-time employment across the industry groups as of July, using Statistics Canada’s threshold of 30 hours per week as the definition of full-time employment.
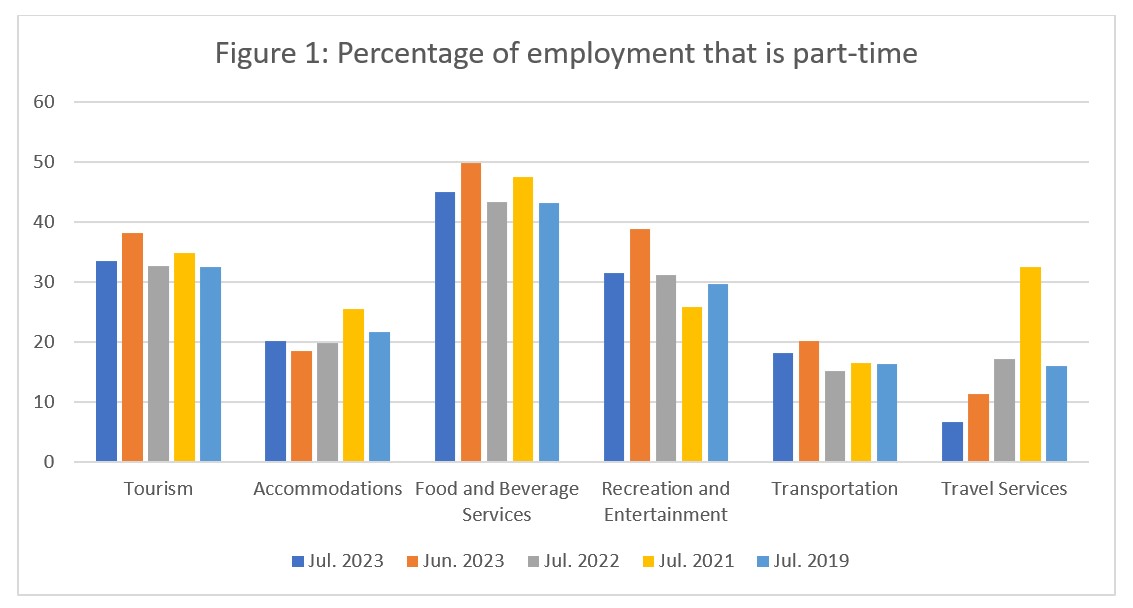
Overall, the ratio of part-time to full-time employment has dropped from June into July, as expected, with high school students joining post-secondary students in taking up full-time employment. This trend is reversed only in accommodations, where the ratio has shifted over the past month in favour of full-time employment. This industry group has always had comparatively low rates of part-time employment, so it may be that rather than having part-time workers taking on full-time hours for the summer season, its complement of full-time workers is being supplemented by part-time workers to meet peak needs. Whether this is a seasonal variation or a shift in broader working patterns remains to be seen as the labour pool and employment numbers continue to grow in this industry. Travel services has continued its shift away from part-time employment, showing a drop over successive years. On the whole, most industry groups saw part-time employment rates comparable to their pre-pandemic levels, so although the overall workforce is reduced compared to 2019, its distribution of workers has returned to more familiar patterns.
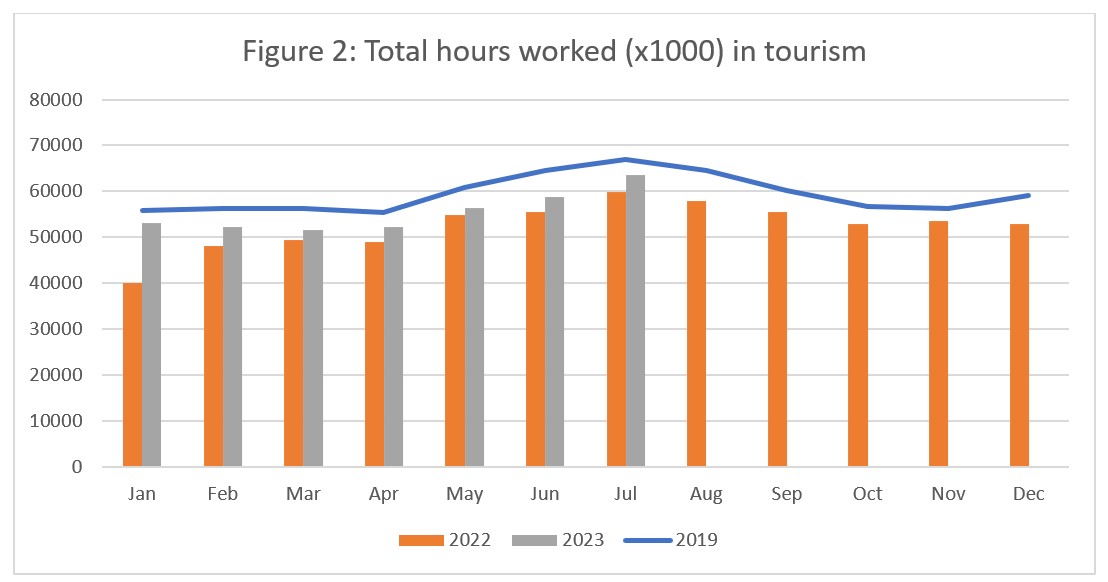
Hours worked
The total actual hours worked within the tourism sector is another useful metric by which to assess the health of the labour market (see Figure 2). The past six months have seen 2023 hours paralleling 2019 patterns, although always at a lower level; in July, that gap narrowed to its smallest since January. Trends for both 2019 and 2022 suggest that July will be the peak of total hours worked, although pent-up demand for tourism may mean that employment hours remain high into August as well.
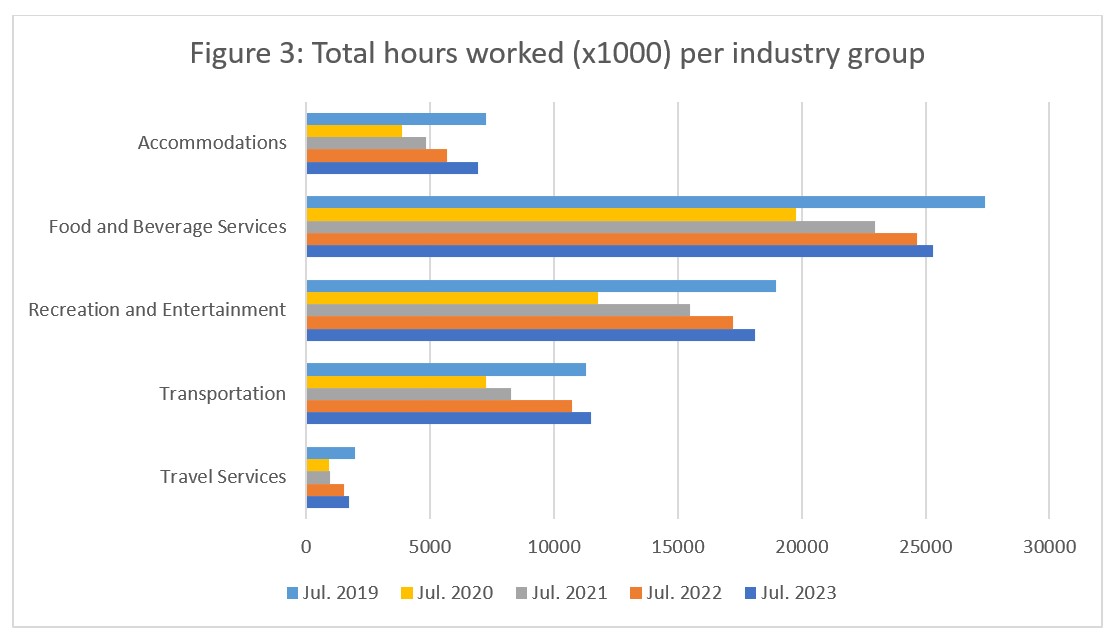
At the industry level (see Figure 3), total hours worked increased from last year across all industry groups, with the largest relative gains seen in accommodations and the smallest in travel services. Annual increases from 2020 onwards are beginning to flatten out for food and beverage services, recreation and entertainment, travel services, and transportation, while the trajectory of growth in accommodations suggests that it is not yet slowing down. Food and beverage services remained substantially below its pre-pandemic levels, but that is unsurprising given the industry’s more general struggles with labour force and employment. Transportation has passed 2019 levels.
Unemployment
Unemployment[5] in the tourism sector in July 2023 was 4.5%, almost one and a half percentage points below that of the broader Canadian economy (5.9%, using seasonally unadjusted data). It was slightly lower than it was in June, higher than it was last year, and lower than the pre-pandemic figure from July 2019. Table 4 provides a summary of tourism unemployment in June.
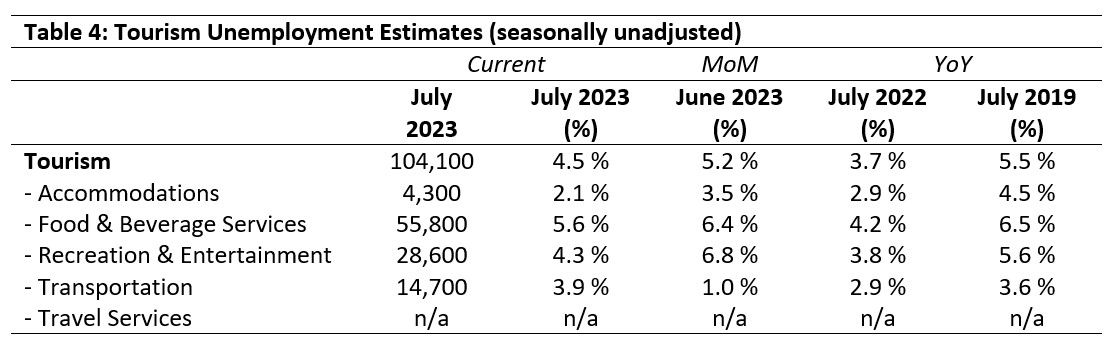
June 2023: Month-over-Month
Unemployment fell from June across most industry groups, except for transportation, which saw an increase of nearly 3%, which tallies with the drop in employment figures noted earlier. Unemployment in accommodations fell to just over 2%, while recreation and entertainment dropped from nearly 7% to 4.3%. Food and beverage services also dropped, which accounts for the larger increase in employment than in labour force for this industry group. No information was available about travel services.
July 2022 and 2019: Year-on-Year
Although there has been some fluctuation from year to year, particularly around the pandemic and its associated restrictions, tourism unemployment in July has been relatively stable, no doubt because of the high tourism demand at this time of year. July 2022 saw some very low unemployment rates, but this may well have been due to a substantially reduced labour force at that point. Compared to 2019, the sector as a whole was one percentage point lower, although recreation and entertainment was a bit higher than it was pre-pandemic.
Provincial Tourism Unemployment
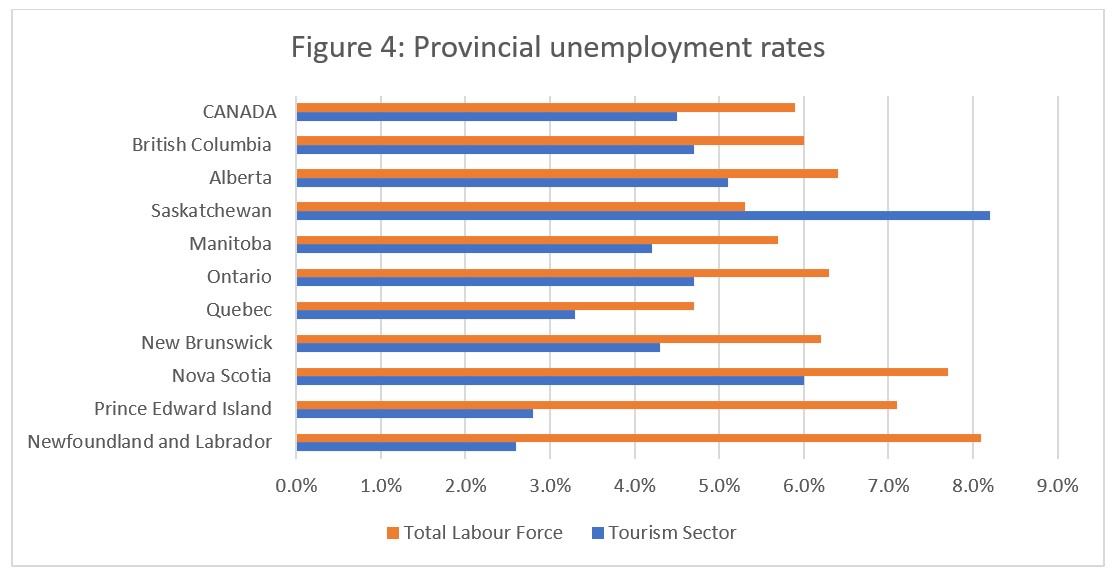
At the aggregate national level, unemployment in tourism was almost one and a half percentage points below that of the wider economy (see Figure 4), a pattern which held across most provinces, with the exception of Saskatchewan, where tourism unemployment far outstripped that of the broader provincial economy. Tourism unemployment was particularly low across Newfoundland and Labrador (2.6%) and Prince Edward Island (2.8%), where the full swing of the summer peak season seemed to be absorbing a number of previously unemployed people. Tourism unemployment was highest in Saskatchewan (8.2%) and Nova Scotia (6.0%).
View more employment charts and analysis on our Tourism Employment Tracker.
[1] As defined by the Canadian Tourism Satellite Account. The NAICS industries included in the tourism sector those that would cease to exist or would operate at a significantly reduced level of activity as a direct result of an absence of tourism.
[2] SOURCE: Statistics Canada Labour Force Survey, customized tabulations. Based on seasonally unadjusted data collected for the period of July 9 to 15, 2023.
[3] The labour force comprises the total number of individuals who reported being employed or unemployed (but actively looking for work). The total Canadian labour force includes all sectors in the Canadian economy, while the tourism labour force only considers those working in, or looking for work in, the tourism sector.
[4] Employment refers to the total number of people currently in jobs. Tourism employment is restricted to the tourism sector, while employment in Canada comprises all sectors and industries.
[5] Unemployment is calculated as the difference between the seasonally unadjusted labour force and seasonally unadjusted employment estimates. The percentage value is calculated against the labour force.