As Tourism Demand Ramps Up, So Does Employment
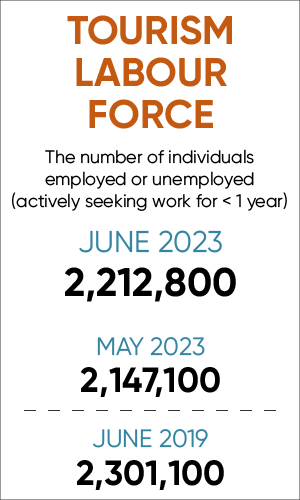
With the demand for tourism rising as summer heats up, employment in the sector has also been on the rise. Overall, the sector[1] in June saw across-the-board improvement over the previous month[2], with increases in both labour force and employment, and a slight decrease in unemployment. Compared to last year, both labour force and employment were in a stronger position, although unemployment was also higher than it was in June 2022. The sector remained below its pre-pandemic levels.
At the industry group level, the profile was also positive overall, although food and beverage services had taken a hit relative to May. Table 1 provides a snapshot of the industry groups’ performance across labour force, employment, and unemployment, as compared with May 2023 [MoM] and June 2022 [YoY], and with June 2019 as a pre-pandemic baseline. Small arrows represent changes of less than 1%.
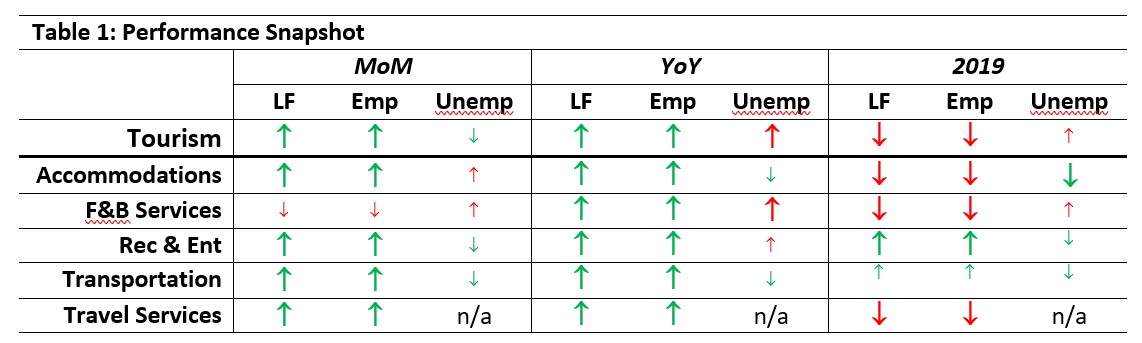
Accommodations continued its upwards trend in both labour force and employment. Food and beverage services saw a drop in labour force and employment as well as a slight increase in unemployment relative to May, while the other industry groups showed month-over-month improvement. Both labour force and employment were across-the-board stronger than they were in June 2022, although the picture with respect to June 2019 was more mixed. Recreation and entertainment and transportation were in slightly better positions than pre-pandemic levels for June, but the sector as a whole remained below 2019 levels.
Tourism Labour Force
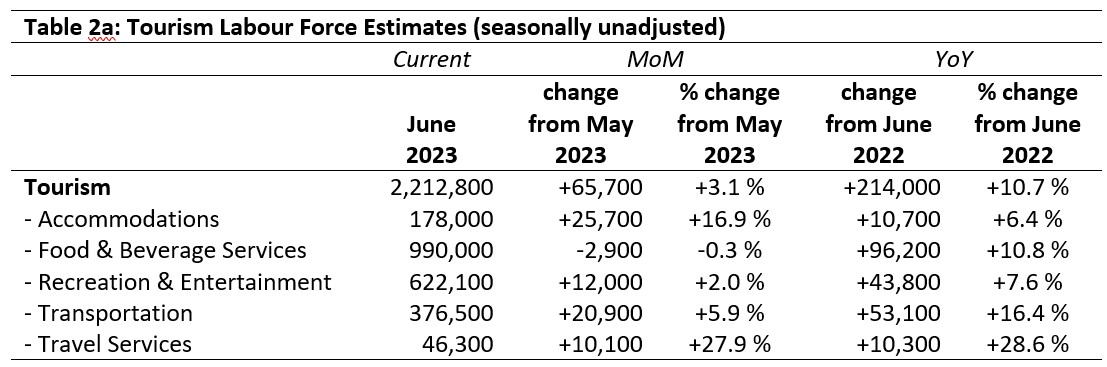
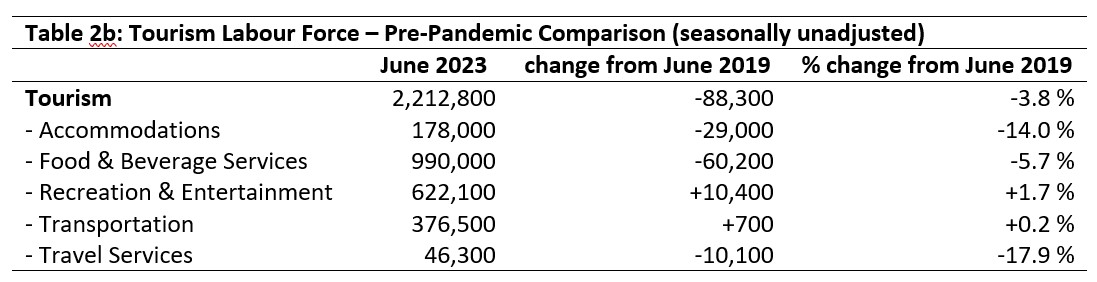
The tourism labour force[3] in June 2023 accounted for 10.2% of the total Canadian labour force, one percentage point below 2019 (11.2%), but a slight increase (+0.2%) on June 2022. Tables 2a and 2b provide a summary of the tourism labour force as of June.
May 2023: Month-over-Month
The labour force for all industry groups (except for food and beverage services) grew since May, reflecting the increased availability of post-secondary students for full-time work by mid-June. Although food and beverage services saw a slight drop over the past month (-2,900), this accounts for a very small proportion of the industry’s labour market share overall (-0.3%). The strongest gains were in travel services (+27.9%) and accommodations (+16.9%). These figures are especially encouraging, given the difficulties faced by both industries over the past year.
June 2022: Year-on-Year
All industry groups had substantially larger labour forces this June than they did in 2022, aggregating into a sector-wide gain of over 214,000 people (+10.7%). The largest proportional improvements were seen in travel services (+28.6%) and in transportation (+16.4%), while the biggest absolute gains were seen in food and beverage services (+96,200). These figures suggest the sector is in a better position coming into this summer peak than it was last year, which is an important parallel to the increase in tourism demand—hopefully businesses will be able to recoup some of their pandemic losses this season, with a larger pool of potential workers to draw from.
June 2019: Pre-pandemic Baseline
The sector remained below pre-pandemic levels, unsurprisingly: the labour force was 88,300 people short of its June 2019 size. The deficit was particularly pronounced in travel services (-17.9%) and accommodations (-14.0%), which in spite of strong performances over last month and last year were still substantially depressed. In contrast, recreation and entertainment saw a modest increase (+1.7%), while transportation just surpassed its pre-pandemic labour force. Food and beverage services stayed below this baseline (-5.7%).
Tourism Employment
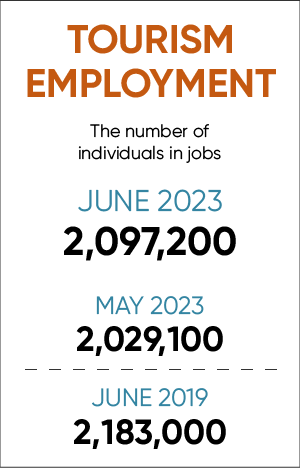
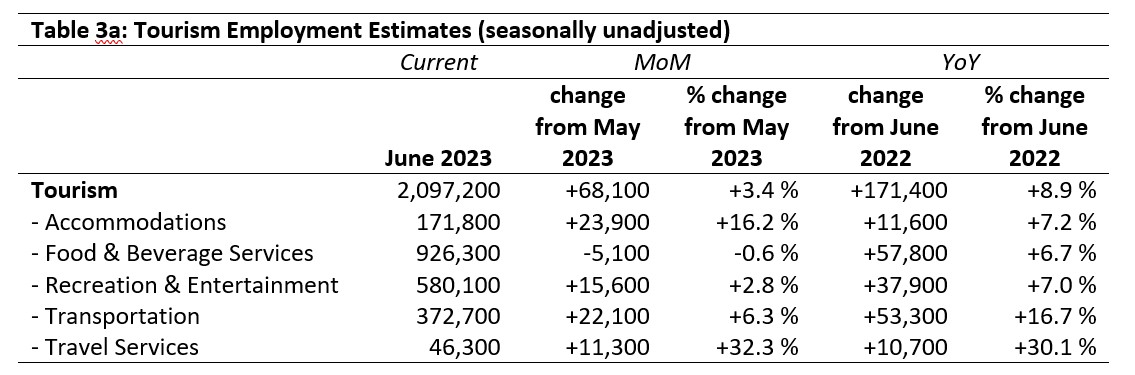
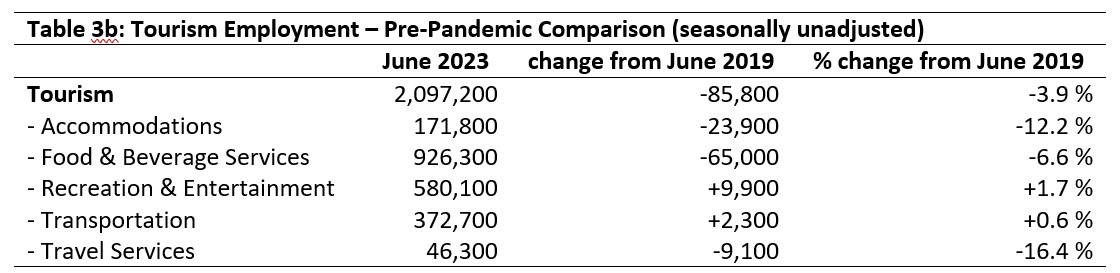
Tourism employment[4] accounted for 10.2% of all employment in Canada in June, and 9.7% of the Canadian labour force was working in tourism. This was higher on both counts than it was in May 2023 and June 2022, but still around a percentage point lower than in June 2019. The sector has continued its trajectory of recovery, but it has not yet closed the gap. Tables 3a and 3b provide a summary of tourism employment as of June 2023.
May 2023: Month-over-Month
The tourism sector overall saw a gain of 68,100 employees since May, which is larger than the gains seen in labour force—a good indicator of people taking up new jobs. Most industry groups grew by over 10,000 people, with accommodations seeing the largest overall increase, at 23,900 (+16.2%), and travel services seeing the largest proportional increase, at 32.3% (+11,300 workers). Food and beverage services alone saw a drop in employment, with 2,900 people leaving the industry group—as a percentage change, however, this represented a very small decrease (-0.3%).
June 2022: Year-on-Year
Relative to last year, employment in tourism was up by 171,400 people, representing an increase of 8.9%. All industry groups were in a stronger position this year. Travel services had the biggest proportional growth (+30.1% on June 2022), while food and beverage services posted the biggest absolute gains (+57,800 people). The year-on-year improvement in accommodations employment was higher than its growth in labour force, meaning the industry is doing well at recruiting, which is very a promising trend in light of the challenges it has faced over the past several months.
June 2019: Pre-pandemic Baseline
Employment in the tourism sector in June 2023 was 85,800 below where it was in June 2019, operating at 96.2% of its pre-pandemic levels. Travel services (-16.4%) and accommodations (-12.2%) remained the most depressed, while recreation and entertainment and transportation both surpassed 2019 levels (+1.7% and +0.6%, respectively). On the whole, the industry-level baseline comparison figures were improved on those of May 2023, suggesting that the sector’s recovery may be starting to accelerate into summer.
Part-time vs. Full-time Employment
A characteristic of the summer peak in tourism is not just a seasonal bump in employment (see the last section of this report, Early Summer Bump, for a more detailed discussion), but also a shift in the ratio of part-time to full-time work, as students working part-time through the academic year transition into full-time work for the summer. Figure 1 provides an overview of the percentage of part-time employment across the industry groups, using Statistics Canada’s threshold of 30 hours per week as the definition of full-time employment.
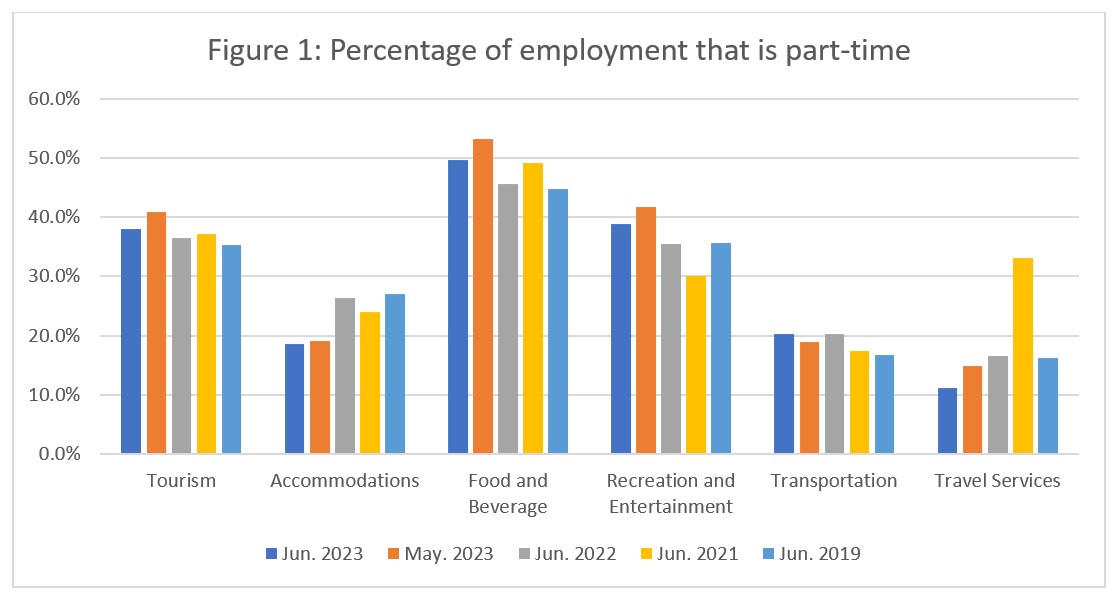
Across the sector, there has been a shift in the expected direction from May: this shift is largely due to changes in food and beverage services and recreation and entertainment, the two largest industry groups in the sector in terms of employment, and also two industries that are heavily reliant on a young workforce. Interestingly, both industries have higher rates of part-time work than they did in 2019, which likely reflects smaller numbers of permanent, full-time staff. Travel services also showed a shift in the expected direction, although as this industry group is currently undergoing rapid (re)growth, it’s difficult to tell from the data whether this is part of a seasonal shift or whether this is a broader realignment of working arrangements in the industry. Accommodations saw a very slight shift from May, but more importantly, the industry’s share of part-time workers remains substantially lower than it was pre-pandemic. Transportation’s reliance on part-time work saw a slight increase from May, but has generally stayed more stable over the past few years than the other industry groups comprising tourism.
Hours worked
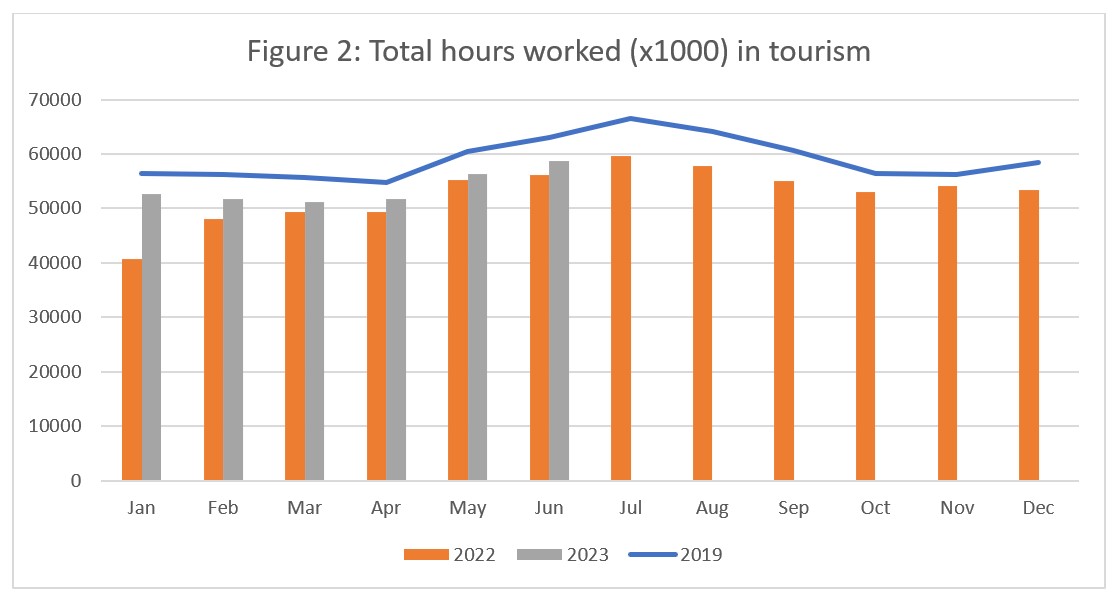
The total actual hours worked within the tourism sector is another useful metric by which to assess the health of the labour market (see Figure 2). The sector-level trend across 2023 has been to closely parallel the pre-pandemic seasonal shifts, but at a lower overall total. The total hours worked in June 2023 was 93.2% of those worked in June 2019, and across the year to date, this percentage has ranged from 91% to 94%. The hours worked in 2023 has been consistently higher than those worked in 2022.
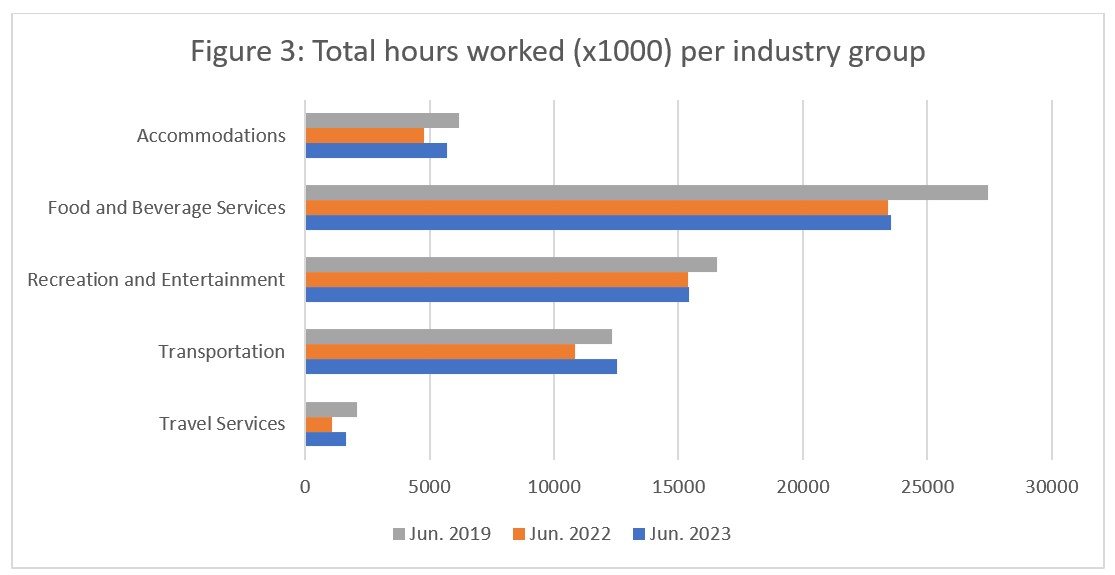
At the industry level (see Figure 3), total hours worked has increased from June 2022 for all industry groups, with the most pronounced increases seen in transportation, accommodations, and travel services. Food and beverage services and recreation and entertainment have only seen slight increases in hours worked. All industries except transportation remained below 2019 totals, with the largest gap in food and beverage services.
Unemployment
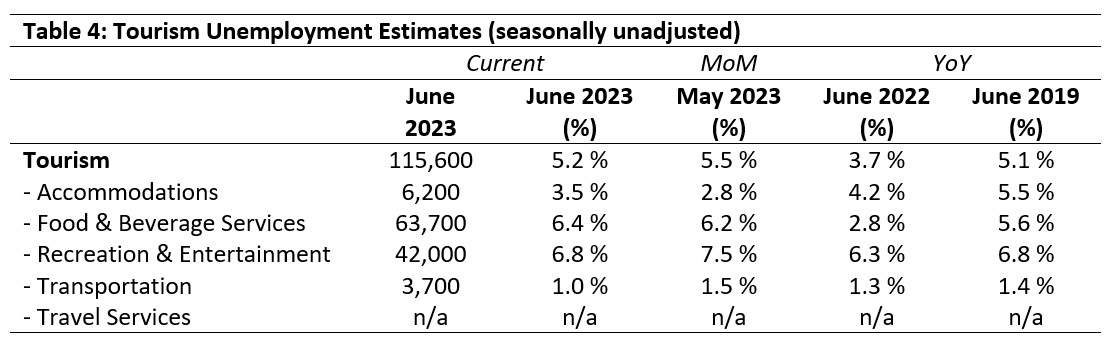
The unemployment[5] rate in the tourism sector in June 2023 was 5.2%, which matched that of the broader Canadian economy (also 5.2%, using seasonally unadjusted data). It was slightly lower in June than in May, but higher than it was last year and comparable with June 2019. The highest unemployment rate was in recreation and entertainment (6.8%), and the lowest was in transportation (1%). Table 4 provides a summary of tourism unemployment.
May 2023: Month-over-Month
Over 115,000 people were unemployed in the tourism sector in June (5.2%), which was an improvement on May’s figures (118,000, 5.5%). The unemployment rate rose in accommodations from May, as it did in food and beverage services, while it fell in recreation and entertainment and in transportation. No data was available for travel services, as is often the case.
June 2022 and 2019: Year-on-Year
Tourism unemployment in June 2023 was comparable with June 2019, but higher than in 2022 when the sector struggled to regrow its labour force as the tourism economy reopened. All industry groups had a very low unemployment rate in June 2022 compared to June 2019, but the figures in June 2023 were more typical. The unemployment rate in recreation and entertainment was the same as in June 2019, while the rate in food and beverage services was slightly higher this year than in 2019 (+0.8%), and that in accommodations has continued to fall year on year. Transportation likewise has seen unemployment fall over time, but it has been consistently very low for a long time.
Provincial Tourism Unemployment
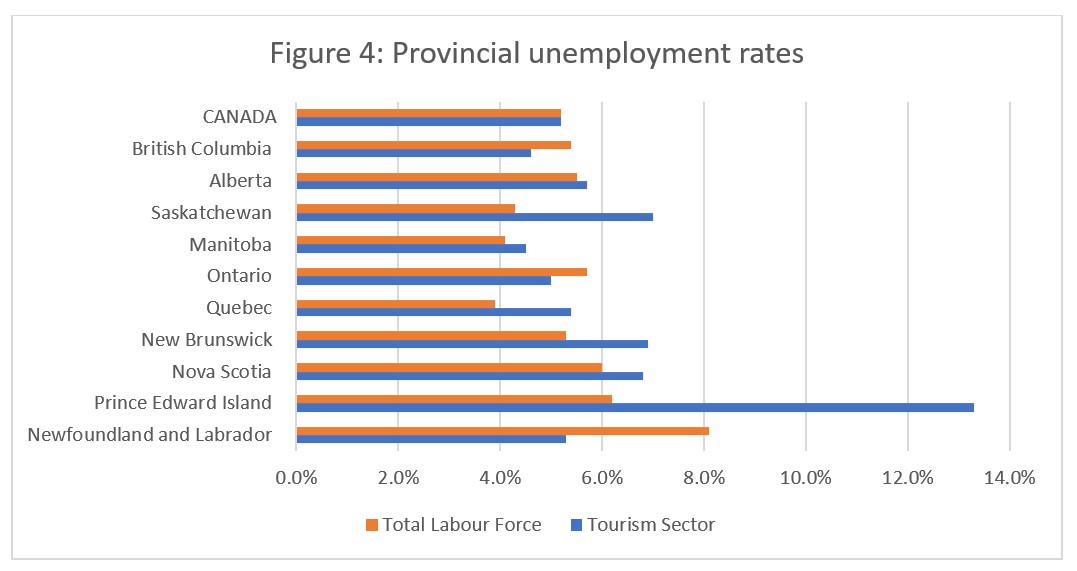
At the aggregate national level, unemployment in tourism was the same as that seen across the broader economy (5.2%, using seasonally unadjusted data—see Figure 4). The recent trend of much higher unemployment in the Atlantic provinces started to correct itself in June, with only Prince Edward Island showing a tourism unemployment rate of over 10% (13.3%, double the broader provincial rate). While the other Atlantic provinces and Saskatchewan maintained higher-than-national unemployment rates in tourism, the differences were much less substantial than they have been lately. The lowest provincial tourism unemployment rates were in Manitoba (4.5%) and British Columbia (4.6%). Tourism unemployment was substantially higher than that of the broader provincial economy in Prince Edward Island, Saskatchewan, New Brunswick, and Quebec, while it was substantially lower than that of the broader economy in Newfoundland and Labrador, British Columbia, and Ontario.
Early Summer Bump
The June Labour Force Survey was conducted during the week of June 11th to 17th, which is late enough into the summer that post-secondary students have largely found summer jobs, but secondary students—who are a not insubstantial part of the summer tourism workforce—have not yet done so. For this reason, it is useful to think of the June statistics as showing an early summer bump: the summer labour force has not yet reached its maximum, but it has picked up the first wave of its new seasonal workers.
Figure 5 provides a comparison of June (early summer bump) with March (pre-summer bump) since 2017, across tourism as an aggregate sector. The blue bars provide employment numbers for March, the orange bars for June, and the grey line represents the June employment as a percentage of the March employment (percentage values can be read on the right vertical axis).
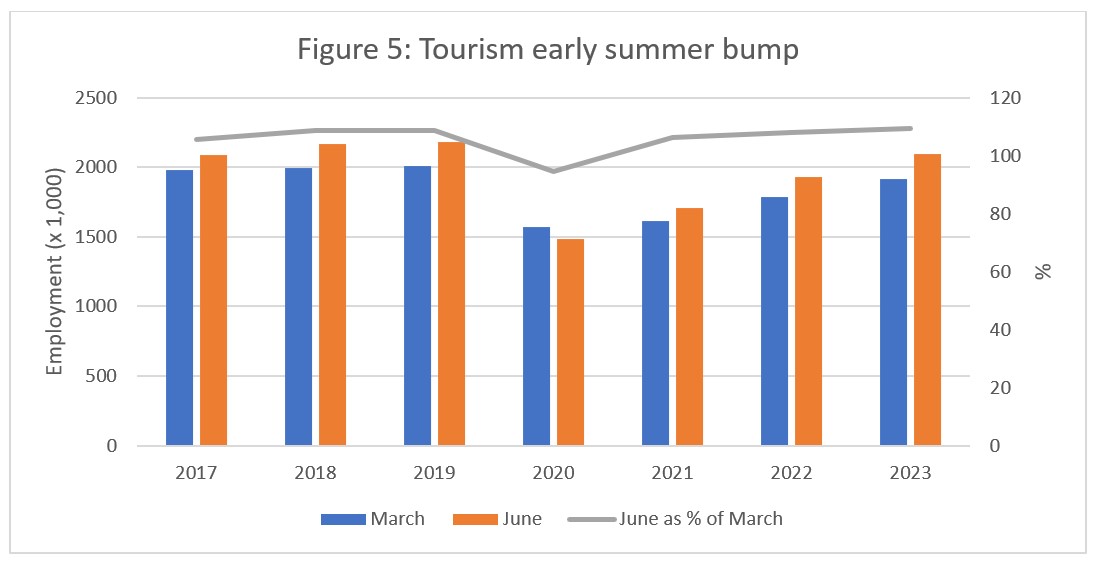
The ratio of June to March employment has been consistently above 100% except for 2020 when it dropped to 95%, coinciding with the imposition of the most extreme public health measures and travel restrictions related to the pandemic. And although the absolute numbers for both March and June 2023 are lower than they were before the pandemic, they show a year-on-year increase as the tourism sector gradually returns to full force. The ratio in 2023 (109%) is comparable to those from 2018 and 2019, suggesting that the dynamics of the summer employment cycle will be familiar, even though the numbers remain below where they need to be to meet tourism demand.
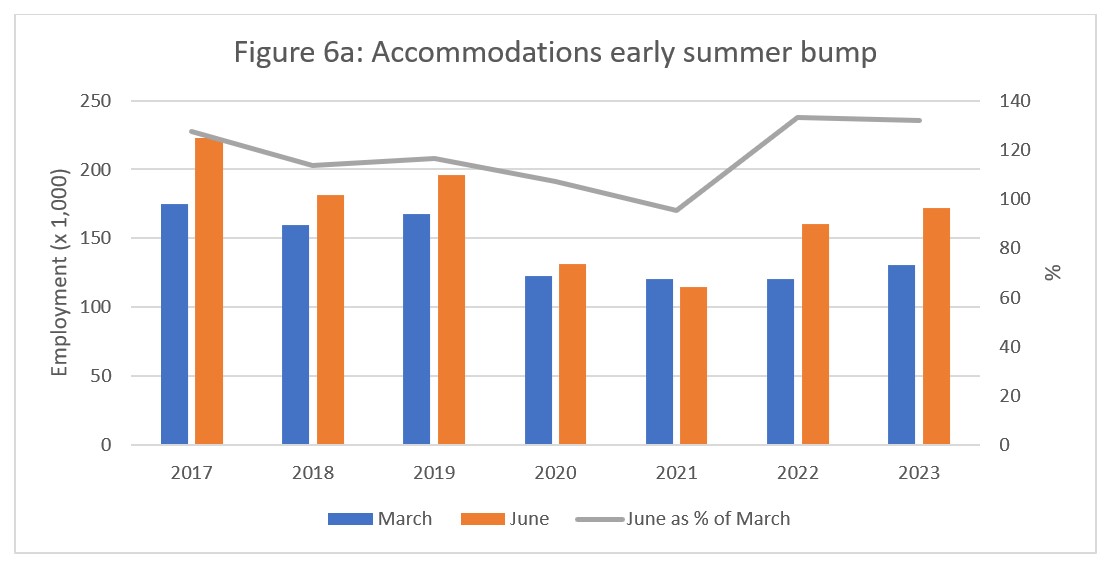
In accommodations (Figure 6a), the early summer bump ratio has been above pre-pandemic levels since 2022 (over 130%, indicating an increase of 30+% in employment between March and June). Interestingly, the lowest bump ratio in this industry group occurred in 2021 (95%, when June employment was lower than in March), rather than in 2020. This may reflect the fact that some accommodations providers stayed open during the pandemic as quarantine hotels, while others offered short-term housing for essential workers; by summer of 2021, both of these factors were greatly reduced. The absolute employment numbers remain depressed relative to pre-pandemic levels, and the March data in particular shows a very gradual trajectory towards recovery.
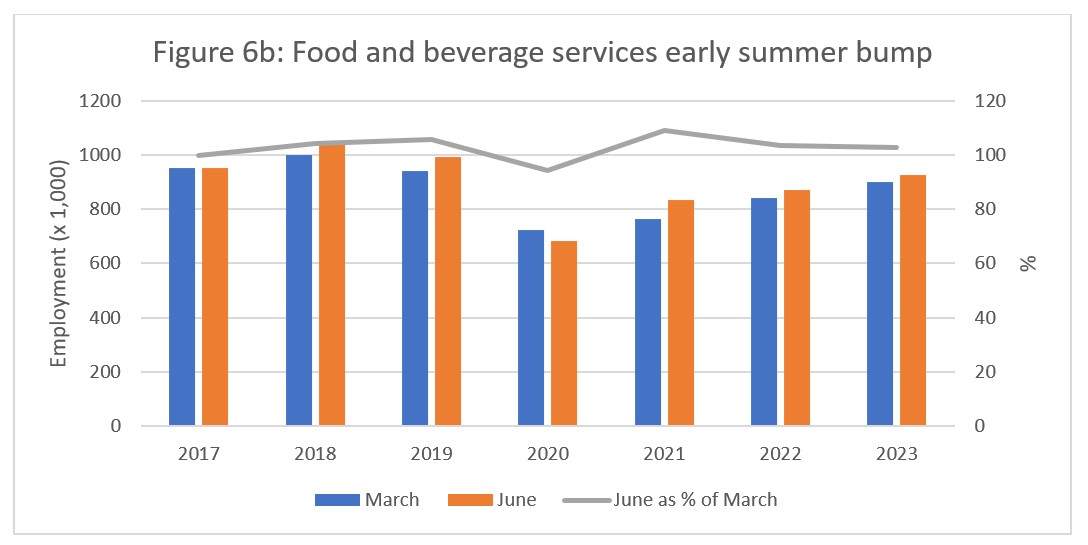
For food and beverage services (Figure 6b), the summer bump ratio has been more modest than in accommodations (peaking at 109% in 2021, and only 106% pre-pandemic). Overall employment numbers fell sharply in 2020 and have been slow to recover, and even the summer bump has been somewhat depressed for this industry group (103% in both 2022 and 2023). However, as this industry represents such a large proportion of overall tourism employment, the conversion to percentages can serve to minimize some of the seasonal changes observed.
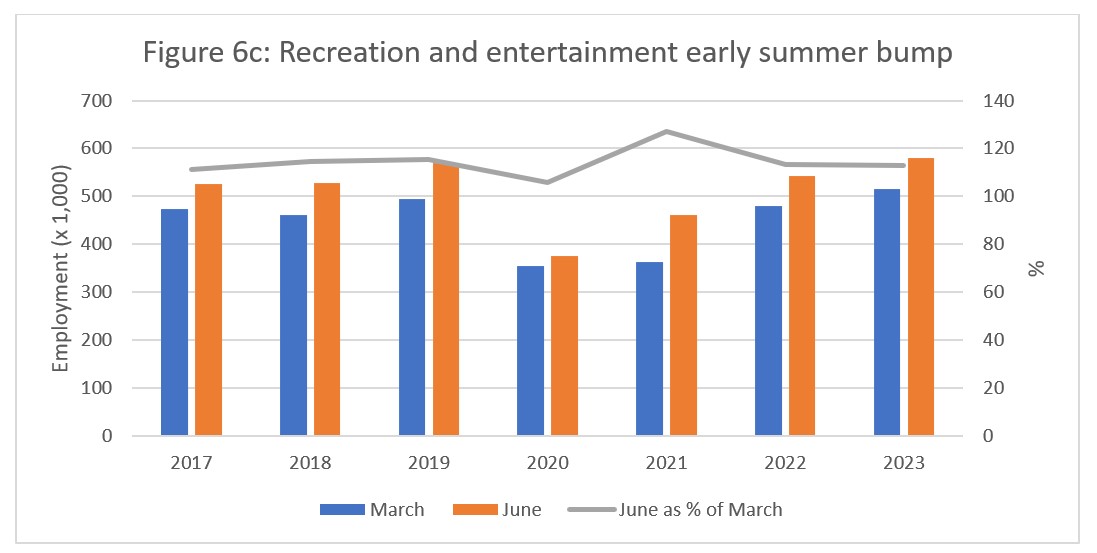
For the recreation and entertainment industry group (Figure 6c), the fluctuations in the early summer bump have been much less severe, with a local minimum of 106% in 2020 and a local maximum of 127% in 2021. This may reflect an increased local interest in outdoor recreational activities during the pandemic, and the accompanying boost in local employment. The early summer bump ratio plateaued at 113% in 2022 and 2023, very comparable to the pre-pandemic ratio of around 114%. Given the overall recovery of this industry group in terms of both labour force and employment, this suggests that it may be stabilizing in its recovery, relative to the other industry groups.
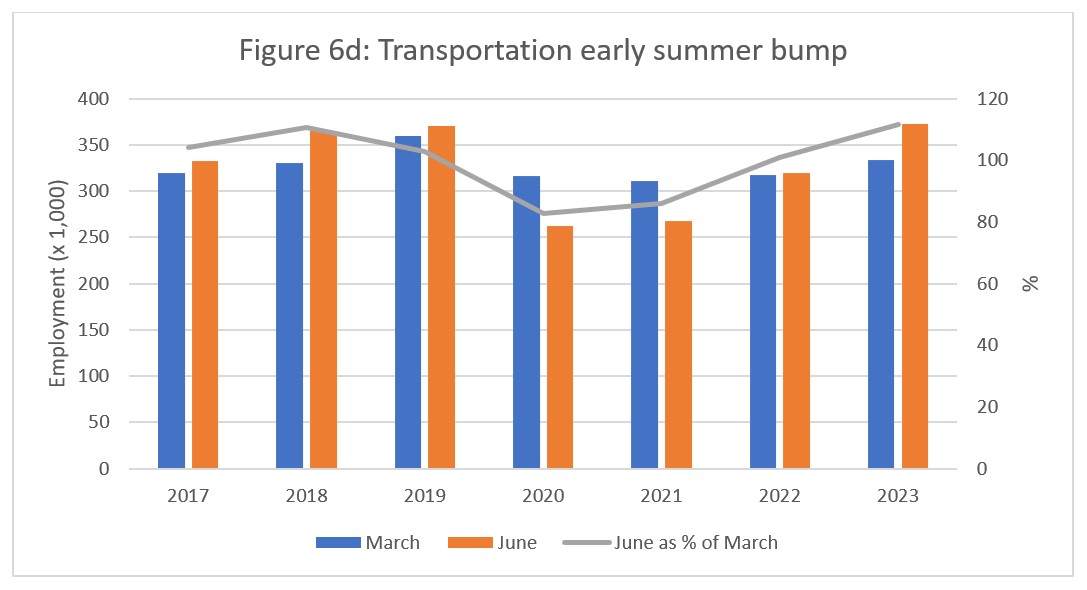
Transportation (Figure 6d) is another industry group that has broadly returned to pre-pandemic employment levels in June 2023, although it remains to be seen whether this trend will continue or if this is a statistical departure from a more gradual path of recovery. The early summer bump ratio has returned to pre-pandemic levels this year (111% in 2018, 112% in 2023) from the low ratios seen in 2020 (83%) and 2021 (86%). These two depressed years coincided with the two summers of extremely reduced travel, which clearly impacted employment levels. Although not possible at this point, it would be interesting to explore this at the occupation level to see which specific modes of transport (e.g., airlines, buses, taxis, ferries) were most severely impacted during this low period.
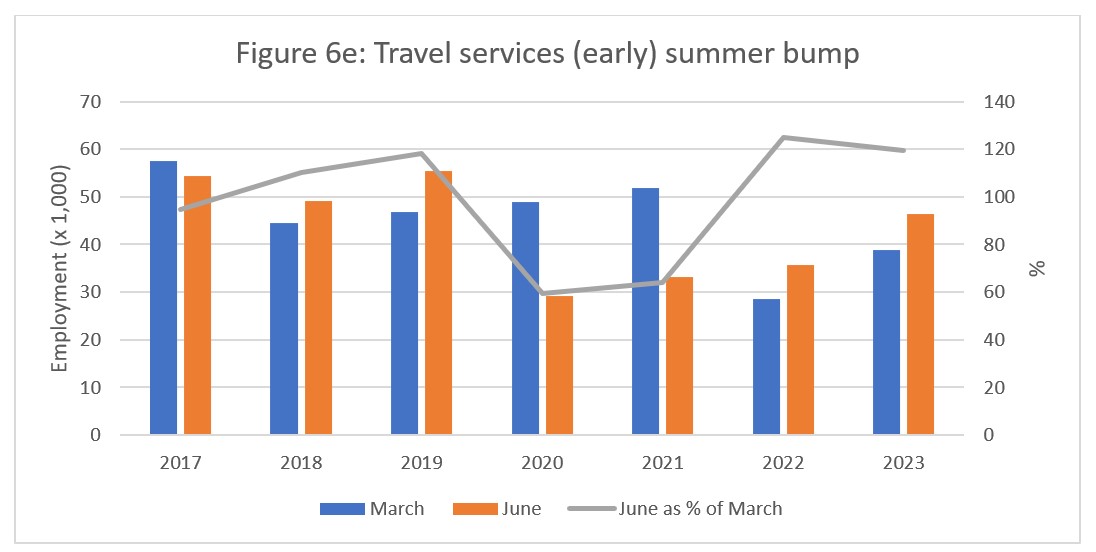
Travel services (Figure 6e) has been particularly hard-hit by the pandemic, with the co-occurrence of both a sharp decline in travel (including business travel and associated event planning) and an increase in the availability of online tools for both travel planning and for hosting remote events. At the height of the pandemic restrictions, the early summer ‘bump’ was actually a trough that dropped down to 60% in 2020 and 64% in 2021. Interestingly, the March data for 2021 continued the general growth trend started in 2018, with the severe loss of employment not being felt until 2022; this is somewhat surprising, as it makes more sense to see high employment in March 2020 (when there was no indication that the effects of pandemic would drag on for so long) than it does in March 2021. In spite of the lateness of the non-summer impact on the travel services industry, employment continues to rise year on year, and the early summer bump has returned to its previous pattern.
Stabilizing but Depressed
Taken together, these snapshots of the early summer bump across the various industry groups that make up tourism suggest that many of the patterns that dominate tourism employment have begun to stabilize, although the overall employment numbers remain lower than their pre-pandemic benchmarks. The different impacts of the pandemic across the industry groups illustrate the sensitivities of the different industries to external shocks, and the early summer bump may prove a valuable tool for estimating when and how well the different sub-groups within the tourism sector are able to respond to systems-wide disruptions.
View more employment charts and analysis on our Tourism Employment Tracker.
[1] As defined by the Canadian Tourism Satellite Account. The NAICS industries included in the tourism sector those that would cease to exist or would operate at a significantly reduced level of activity as a direct result of an absence of tourism.
[2] SOURCE: Statistics Canada Labour Force Survey, customized tabulations. Based on seasonally unadjusted data collected for the period of June 11 to 17, 2023.
[3] The labour force comprises the total number of individuals who reported being employed or unemployed (but actively looking for work). The total Canadian labour force includes all sectors in the Canadian economy, while the tourism labour force only considers those working in, or looking for work in, the tourism sector.
[4] Employment refers to the total number of people currently in jobs. Tourism employment is restricted to the tourism sector, while employment in Canada comprises all sectors and industries.
[5] Unemployment is calculated as the difference between the seasonally unadjusted labour force and seasonally unadjusted employment estimates. The percentage value is calculated against the labour force.