Sector starts to accelerate into the summer season
The tourism sector[1] in May 2023 saw improvement over the previous month[2], particularly in labour force and employment. It was also in a stronger position than this time last year, although unemployment was higher in May 2023 than in 2022. Unemployment was lower than in 2019, but labour force and employment were still substantially below their pre-pandemic levels. Overall, this paints a cautiously optimistic picture for the coming peak season.
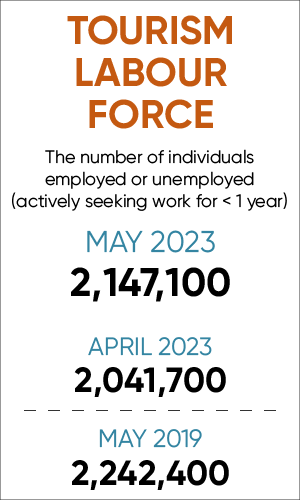
At the industry group level, the profile overall is relatively stable. Table 1 provides a snapshot of the industry groups’ performance across labour force, employment, and unemployment, as compared with April 2023 [MoM], May 2022 [YoY], and with May 2019 as a pre-pandemic baseline. Small arrows represent changes of less than 1%.

Accommodations continued its strong performance relative to the previous month, as did recreation and entertainment and travel services. Food and beverage services grew in labour force and employment, but also had higher unemployment. Transportation saw modest decreases across all three metrics. With respect to the previous year, labour force and employment were generally improved (with the exception of accommodations), while unemployment was higher for the two largest industry groups. Recreation and entertainment was the only industry group that was in a stronger position than in 2019, with all others coming in substantially below pre-pandemic levels on both labour force and employment.
Tourism Labour Force
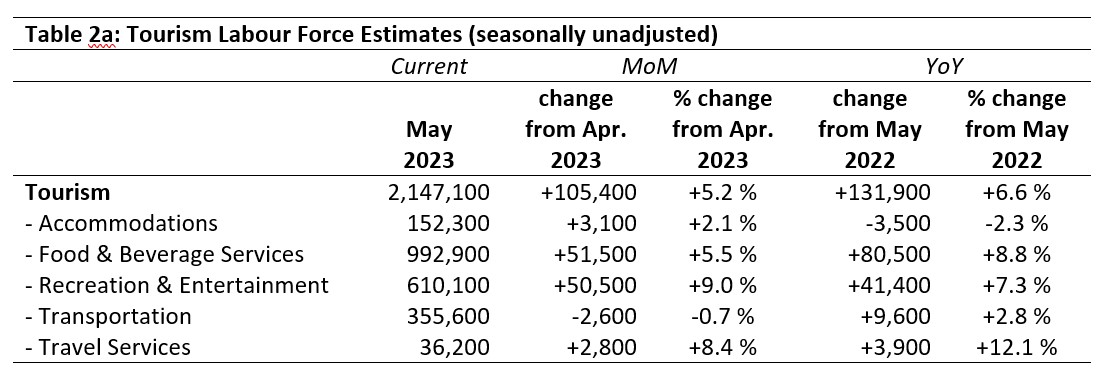
The tourism labour force[3] in May 2023 accounted for 10% of the total Canadian labour force, which is a modest increase on both last month (9.7%) and last May (9.6%). It remained below its pre-pandemic share of 11%, but continued the trend of narrowing the gap. Tables 2a and 2b provide a summary of the tourism labour force as of May 2023.
May: Month-over-Month
All industry groups except for travel services grew since April, with the strongest relative improvements seen in recreation and entertainment (+9.0%) and travel services (+8.4%). In absolute terms, food and beverage services saw the largest labour force gains (+51,500). Accommodations saw modest gains, while transportation saw a decrease of less than one percent. Overall, the sector’s labour force grew by over 100,000 since April 2023. This likely represents the beginning of the summer season growth in the tourism sector, as more people—particularly post-secondary students—enter the labour market.
May: Year-on-Year
The tourism sector’s labour force was in a substantially stronger position than it was in May 2022, with all industry groups except accommodations having grown. Accommodations, which has been struggling over the past few months and has recently started to turn the tide, is still suppressed relative to last year, in spite of recent improvements. Travel services has regained some of its losses from the pandemic, up 12.1% on last year. If the month-over-month numbers suggest that we are seeing the first foothills of the summer peak, then the year-on-year figures indicate that summer 2023 is on track for a larger pool of available workers than we saw in 2022.
May: Pre-pandemic Baseline
As has been the case for several months, all industry groups remained below pre-pandemic levels, except for recreation and entertainment, which saw impressive gains (+46,900, an increase of 8.3%). Travel services and accommodations saw the largest relative decreases, while food and beverage services and transportation saw more modest losses. Overall, the sector’s labour force remained 95,300 short of where it was in May 2019.

Tourism Employment
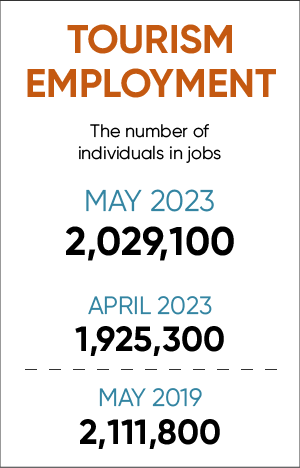
Tourism employment[4] accounted for 10% of all employment in Canada in May 2023, which represented 9.5% of the total Canadian labour force. This was higher on both counts than in April 2023 (9.7% and 9.2%, respectively), but still below 2019 levels (10.9% and 10.3%). The sector continued to regain lost ground as a share of the economy, but it had not yet returned to its pre-pandemic levels. Tables 3a and 3b provide a summary of tourism employment as of May 2023.

May: Month-over-Month
The tourism sector employed over 100,000 more people in May than in April this year, with the bulk of those gains in recreation and entertainment and food and beverage services. As these represent popular work destinations for many post-secondary students as the school year ends, this is not a big surprise. Accommodations and travel services likewise saw gains on April, hopefully easing some of the labour pressures that employers have been facing. However, it is unlikely that staffing levels have reached the necessary numbers to meet tourism demand over the coming months.
May: Year-on-Year
Employment in the tourism sector was up by 100,000 people relative to this time last year. Travel services saw particularly strong relative gains, which may signal an increased demand for these services as travellers plan their summer vacations. Accommodations showed the lowest growth over the past year (+2,500, or 1.7%), suggesting that, in spite of strong month-over-month performance so far this year, it is likely to continue to struggle to find enough staff through the summer.
May: Pre-pandemic Baseline
Employment in tourism in May 2023 was almost 83,000 below where it was in May 2019, operating at 96.1% of its pre-pandemic levels. Travel services (-30.3%) and accommodations (-16%) were the most depressed, while recreation and entertainment alone employed more people than in 2019. The past few months have seen some strong growth across the sector and its constituent industry groups, but tourism as a whole has yet to return to pre-pandemic levels of employment.

Part-time vs. Full-time Employment
As the sector starts to shift into summer mode, with an uptick in seasonal employment and a move among many younger workers from part-time work through the school year into full-time employment over the summer, we might expect to see shifts in the part-time (PT) to full-time (FT) ratio. Figure 1 provides an overview of the percentage of part-time employment across the industry groups, using Statistics Canada’s definition of full-time employment as 30 hours per week or more, and part-time employment as fewer than 30 hours per week.
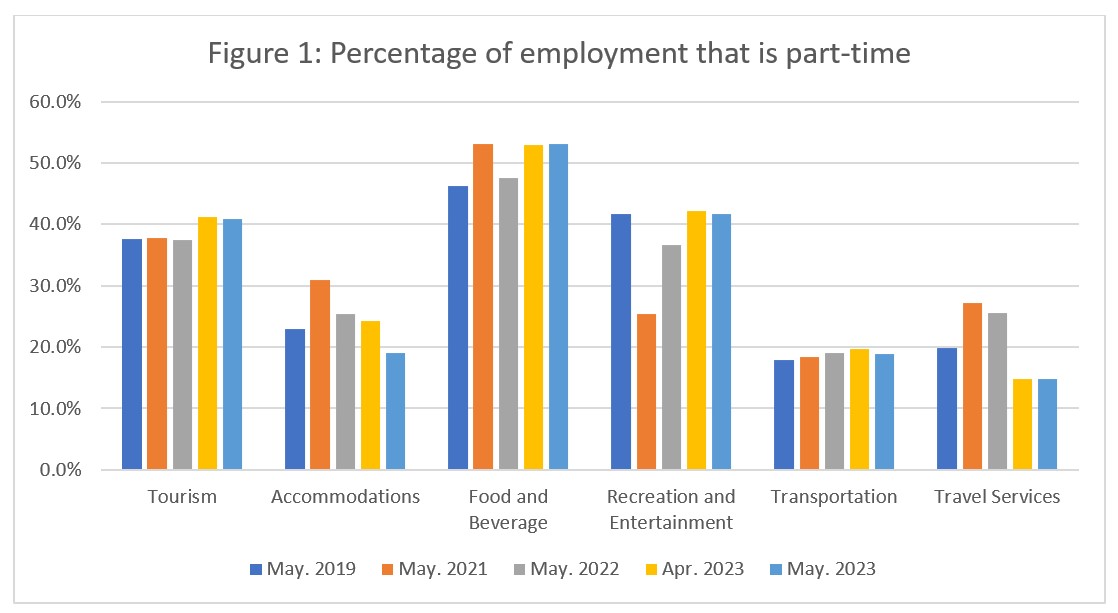
At the sector level, there has been a slight decrease (-0.4%) from April in part-time employment, although for most industries, there has been very little movement in the past month. The largest month-to-month change was seen in accommodations, which decreased part-time work by just over 5%. The two largest industry groups in terms of employment (food and beverage services and recreation and entertainment) saw much more modest changes. Taken together with the overall increases in employment during the same time period, the picture suggests that accommodations has taken on more full-time workers, while recreation and entertainment and food and beverage services have more or less maintained the FT/PT ratio as they’ve grown. This may indicate that younger workers (e.g., high school students) taking on part-time work for the summer balances out post-secondary students shifting into full-time work. Alternatively, it may be that post-secondary students are also taking on more part-time positions.
Relative to previous years, the sector as a whole has seen a moderate increase in 2023 in the part-time workforce, from around 38% across 2019, 2021, and 2022 to 41% in 2023 to date. This likely reflects increases in food and beverage services and recreation and entertainment, which tend to have substantially higher rates of part-time employment than the other industries, and also account for a large proportion of all employment in tourism. Accommodations and travel services were more reliant on full-time employment in May 2023 than in 2019, while transportation has remained relatively stable.
Hours worked
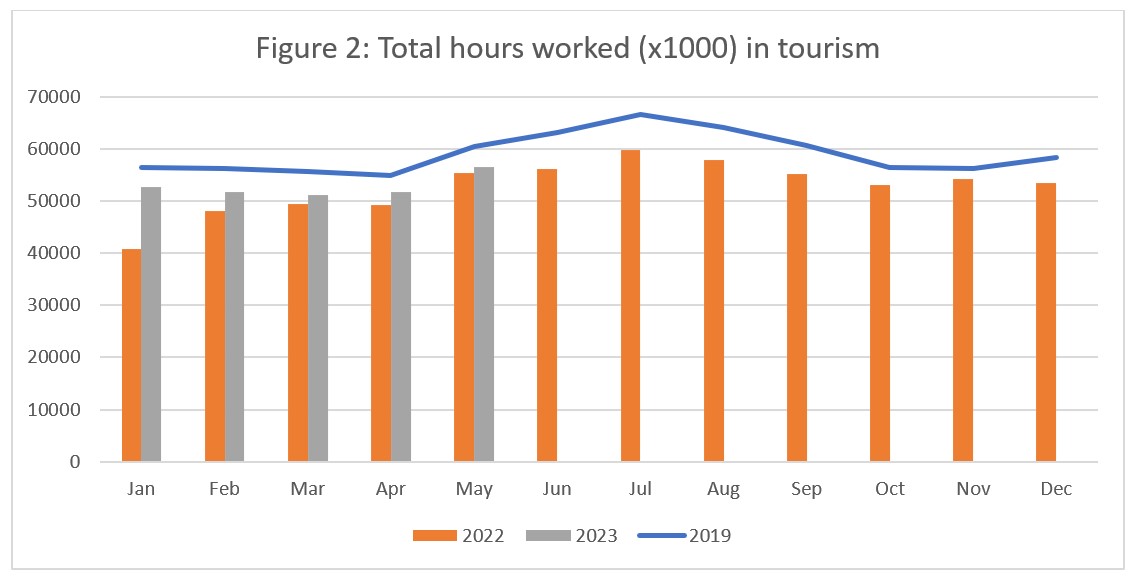
The total actual hours worked in the tourism sector is another useful metric by which to assess the health of the labour market (see Figure 2). While still lower than 2019, the number of hours worked in tourism in 2023 has been consistently higher than in 2022. This is in line with the overall employment numbers discussed above.
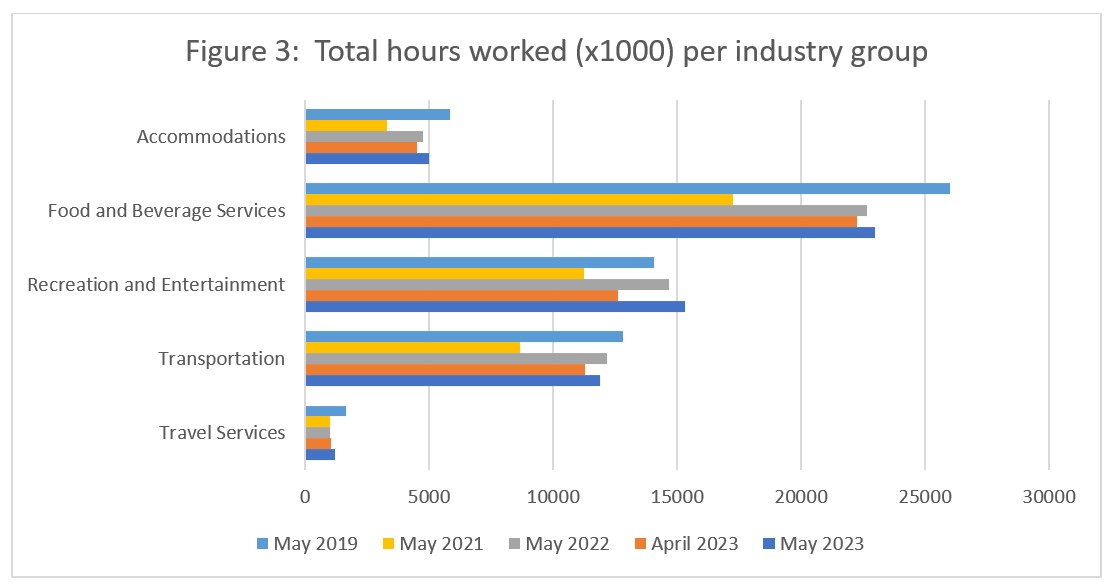
At the industry level (see Figure 3), all groups except recreation and entertainment posted fewer total hours worked in May 2023 than they did in May 2019. Travel services increased slightly on April and the previous two years, while transportation increased relative to April but remained below May 2022. Accommodations, food and beverage services and recreation and entertainment all improved on April and on May 2021 and May 2022. Across all industry groups, the sector showed the start of the seasonal increase month-on-month, and at higher levels than this time last year.
Unemployment
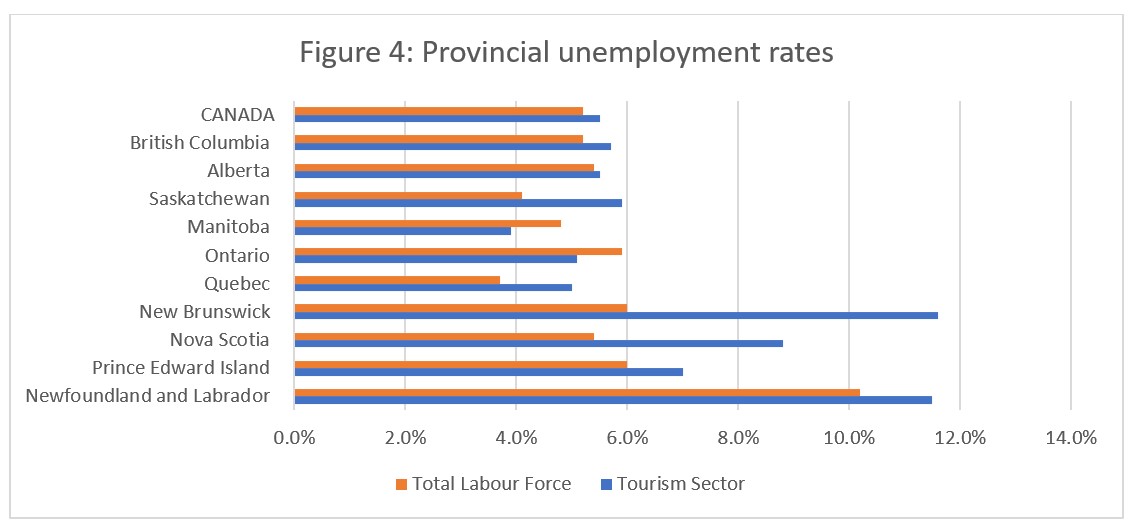
The unemployment[5] rate in the tourism sector in May 2023 was 5.5%, slightly higher than in the broader Canadian economy overall (5.2%, using seasonally unadjusted data) and slightly lower (-0.2%) than the sector’s rate in April. Table 4 provides a summary of tourism unemployment as of May 2023.

May: Month-over-Month
At the industry-group level, unemployment across most tourism industries was lower in May than in April, although food and beverage services saw an increase of 1.5%. This likely reflects the increase in the industry’s labour force, representing people looking for work who had not (yet) been hired anywhere. As the summer season unfolds and businesses ramp up their seasonal hiring, that number may fall. Unemployment in accommodations fell the most (-4.1%), followed by recreation and entertainment (-2.4%). Transportation unemployment remained low. No data was available for travel services.
May 2022 and 2019: Year-on-Year
As a sector, unemployment in tourism was higher (+1.2%) in May 2023 than it was in 2022, which may be an artefact of different labour force sizes: tourism has added over 130,000 people to its labour pool since then. The May 2023 unemployment figure was slightly lower (-0.3%) than it was in 2019, when the labour force was 95,000 larger. Unemployment in accommodations was substantially lower than it has been in several years, while the unemployment rate in recreation and entertainment was higher than in 2022 but lower than in 2019.
Provincial Tourism Unemployment
At the aggregate national level, unemployment in tourism was slightly higher than across the wider economy (see Figure 4). Tourism unemployment remained substantially higher in the Atlantic provinces than elsewhere in the country, although it is always worth noting that the difference in scale of the economy can have a distorting effect on percentages, where small absolute differences are amplified when normalized to percentages. Nevertheless, it is interesting that unemployment in Prince Edward Island has fallen substantially relative to previous months. Tourism unemployment in Saskatchewan was higher than that of the total provincial economy, but it was not out of line with most other (non-Atlantic) provinces. Tourism unemployment was lowest in Manitoba (3.9%) and highest in New Brunswick (11.6%).
Provincial Snapshots
As the sector begins the uphill climb into the peak summer season, it is useful to consider how the tourism labour market compares across the country in May. Tourism comprised the largest share of the provincial workforce in British Columbia (employing 11.6% of the provincial labour force) and the smallest share in New Brunswick (employing 7.6% of the provincial labour force).
For each province, the key indices of labour force, employment, and unemployment rate are provided in the tables below, along with a comparison to each province’s general economy.
Empty cells indicate data that is unavailable from Statistics Canada due to confidentiality or size limitations. A dash [-] represents an estimate that is smaller than the error margin on the sample, and so is unreliable (and thus not reported). All data is seasonally unadjusted.

In Alberta (Table 5a), tourism employment accounted for 9.4% of all employment in the province, and engaged 8.9% of the provincial labour force. Food and beverage services was the largest employer in the sector, and recreation and entertainment had the highest unemployment rate.

In British Columbia (Table 5b), tourism employment accounted for 12.2% of all employment in the province, and engaged 11.6% of the provincial labour force. Food and beverage services was the largest employer in the sector, and recreation and entertainment had the highest unemployment rate.
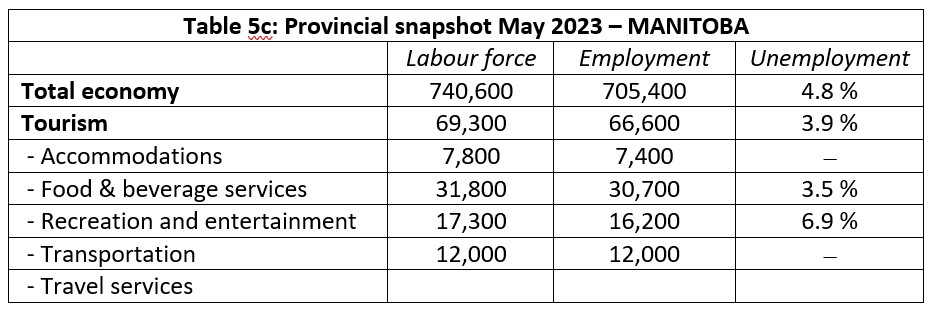
In Manitoba (Table 5c), tourism employment accounted for 9.4% of all employment in the province, and engaged 9.0 % of the provincial labour force. Food and beverage services was the largest employer in the sector, and recreation and entertainment had the highest unemployment rate.
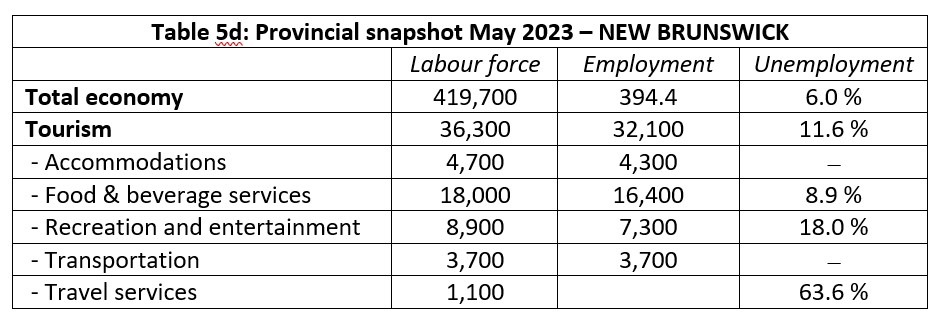
In New Brunswick (Table 5d), tourism employment accounted for 8.1% of all employment in the province, and engaged 7.6% of the provincial labour force. Food and beverage services was the largest employer in the sector, and travel services has the highest unemployment rate.
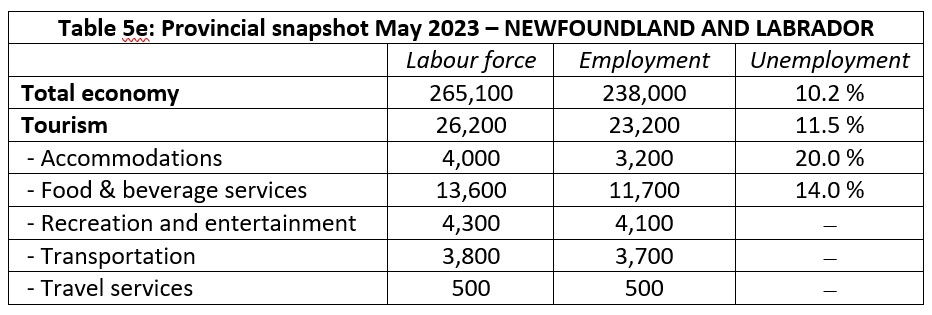
In Newfoundland and Labrador (Table 5e), tourism employment accounted for 9.7% of all employment in the province, and engaged 8.8% of the provincial labour force. Food and beverage services was the largest employer in the sector, and accommodations had the highest unemployment rate.

In Nova Scotia (Table 5f), tourism employment accounted for 9.7% of all employment in the province, and engaged 9.2% of the provincial labour force. Food and beverage services was the largest employer in the sector, and recreation and entertainment had the highest unemployment rate.
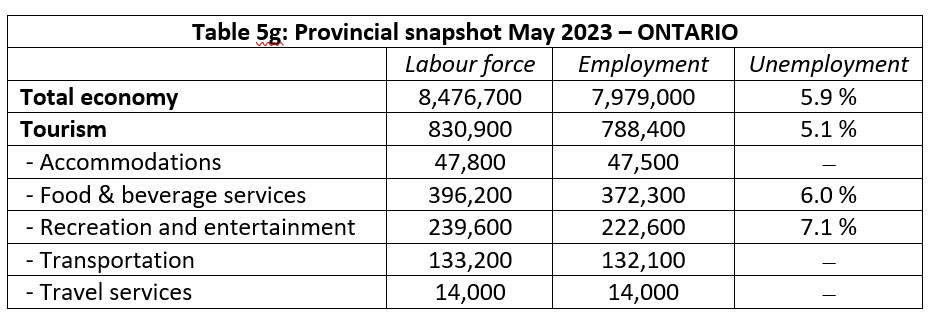
In Ontario (Table 5g), tourism employment accounted for 9.9% of all employment in the province, and engaged 9.3% of the provincial labour force. Food and beverage services was the largest employer in the sector, and recreation and entertainment had the highest unemployment rate.
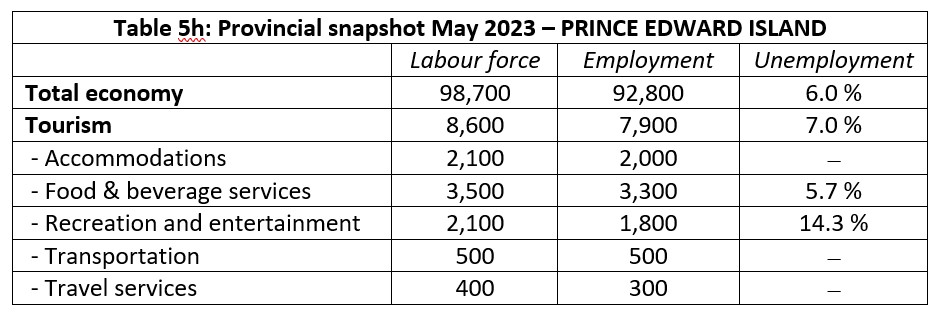
In Prince Edward Island (table 5h), tourism employment accounted for 8.5% of all employment in the province, and engaged 8.0% of the provincial labour force. Food and beverage services was the largest employer in the sector, and recreation and entertainment had the highest unemployment rate.

In Quebec (Table 5i), tourism employment accounted for 9.6% of all employment in the province, and engaged 9.3% of the provincial labour force. Food and beverage services was the largest employer in the sector, and recreation and entertainment had the highest unemployment rate.
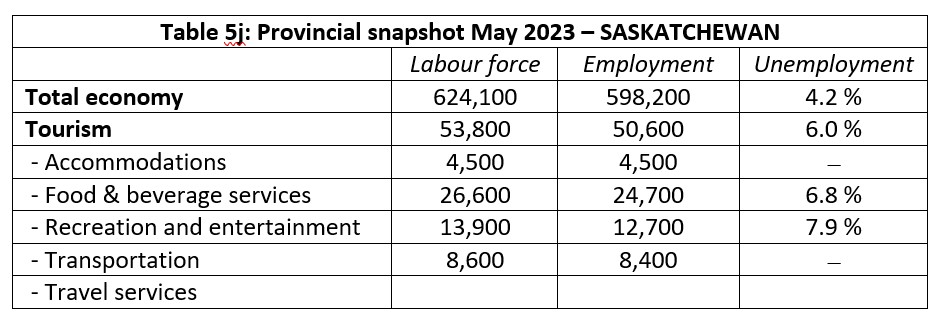
In Saskatchewan (table 5j), tourism employment accounted for 8.5% of all employment in the province, and engaged 8.1% of the provincial labour force. Food and beverage services was the largest employer in the sector, and recreation and entertainment had the highest unemployment rate.
View more employment charts and analysis on our Tourism Employment Tracker.
[1] As defined by the Canadian Tourism Satellite Account. The NAICS industries included in the tourism sector those that would cease to exist or would operate at a significantly reduced level of activity as a direct result of an absence of tourism.
[2] SOURCE: Statistics Canada Labour Force Survey, customized tabulations. Based on seasonally unadjusted data collected for the period of May 14 to 20, 2023.
[3] The labour force comprises the total number of individuals who reported being employed or unemployed (but actively looking for work). The total Canadian labour force includes all sectors in the Canadian economy, while the tourism labour force only considers those working in, or looking for work in, the tourism sector.
[4] Employment refers to the total number of people currently in jobs. Tourism employment is restricted to the tourism sector, while employment in Canada comprises all sectors and industries.
[5] Unemployment is calculated as the difference between the seasonally unadjusted labour force and seasonally unadjusted employment estimates. The percentage value is calculated against the labour force.

