Some stability, but tourism sector still below 2019 levels
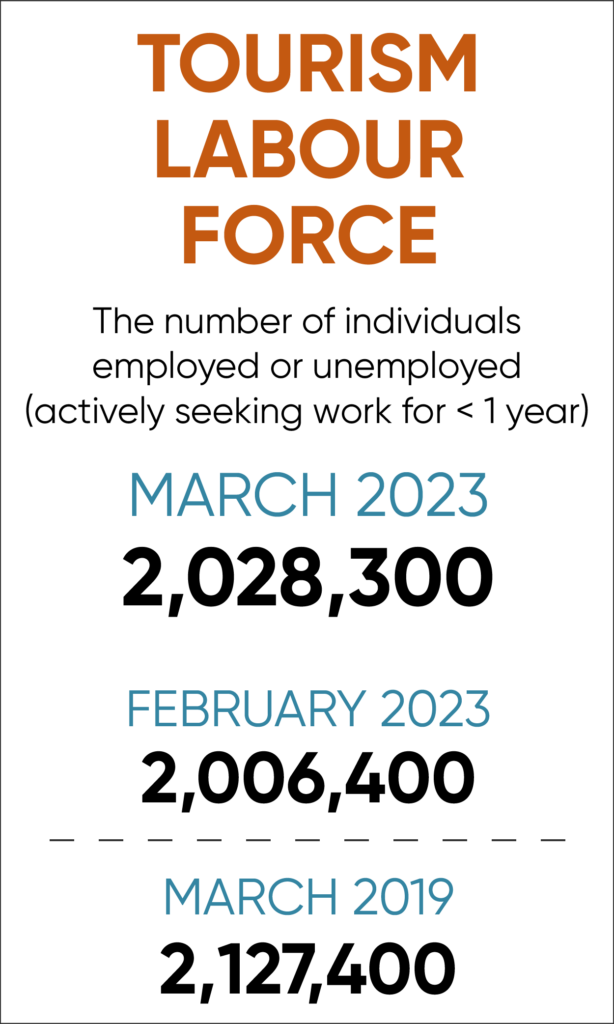
Overall, the tourism sector[1] in March saw modest growth over the previous month[2], but also a slight increase in unemployment. The labour force had grown by nearly 22,000, while employment grew only by 4,200. Unemployment increased from 5.2% in February to 6.0% in March. The sector was in a much stronger position than it was in March 2022, but still performing below the pre-pandemic baseline.
At the industry group level, the profile overall shows a more variable picture. Table 1 provides a snapshot of each industry group’s performance across labour force, employment, and unemployment, as compared with February 2023 [MoM], March 2022 [YoY], and with March 2019 as a pre-pandemic baseline. Small arrows represent changes of less than 1%.
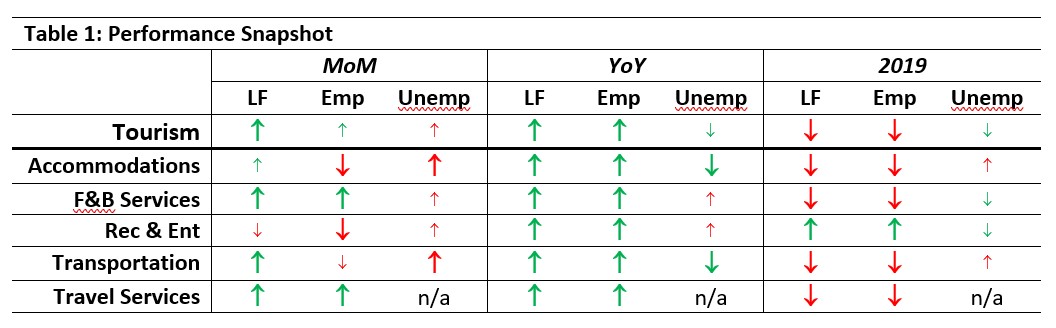
Recreation and entertainment saw decreases over February in both labour force and employment, while accommodations and transportation saw a decrease in employment but growth in labour force. Food and beverage services and travel services saw strong growth on both indices. Unemployment was up across the board, but this likely reflects the very low unemployment figures from February rather than a marked departure from the norm in March.
All industry groups were stronger compared to the previous year, with only slight increases in unemployment for food and beverage services and recreation and entertainment. In contrast, recreation and entertainment was in a stronger position than it was in 2019; for all other industry groups, both labour force and employment were substantially depressed.
Tourism Labour Force
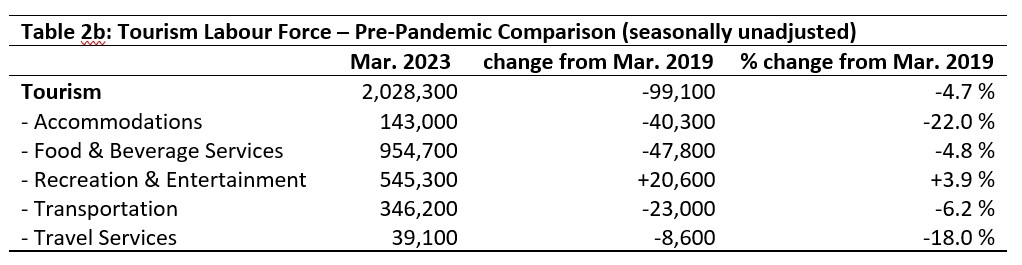
The tourism labour force[3] in March accounted for 9.7% of the total Canadian labour force, which is comparable to February (9.6%) but still a full percentage point below where it was in 2019. Although tourism continues to claw back its share of the overall national labour force, it still has a way to go. Tables 2a and 2b provide a summary of the tourism labour force as of March 2023.
March: Month-over-Month
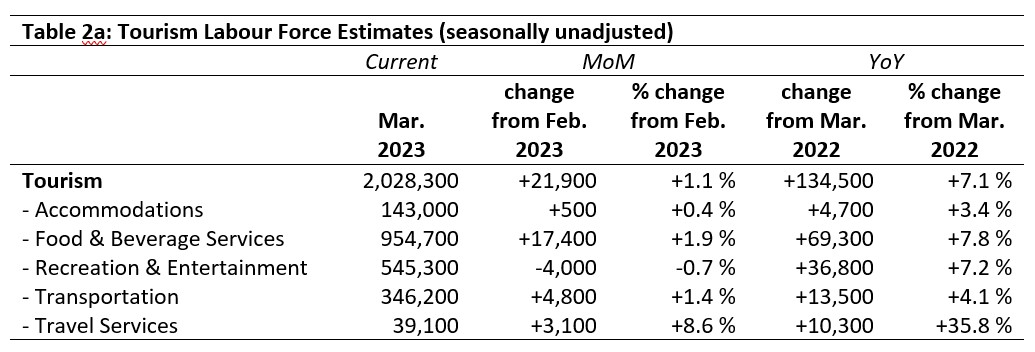
The sector as a whole gained 21,900 people in the labour force relative to February, with all industry groups (other than recreation and entertainment) showing growth. Gains were smallest in accommodations, which has been struggling for several months relative to the other industries. Travel services saw a small increase in absolute terms, but this represented a relatively large increase in its total labour force.
March: Year-on-Year
Across the sector, all industry groups had a substantially larger labour force this March than they did in 2022. Travel services saw the largest relative growth at nearly 36%, while accommodations saw the smallest (3.4%). Food and beverage services had the largest influx in absolute terms, likely due to changes in people’s confidence levels in eating out again over the past year.
March: Pre-pandemic Baseline
The tourism sector labour force in March remained nearly 5% below its pre-pandemic size, with just over 99,000 fewer people. Only recreation and entertainment showed any growth; all other sectors shrank, most notably accommodations (having over 40,000 fewer now than in 2019, a loss of 22%) and travel services (a loss of 8,600 people, 18%).
Tourism Employment
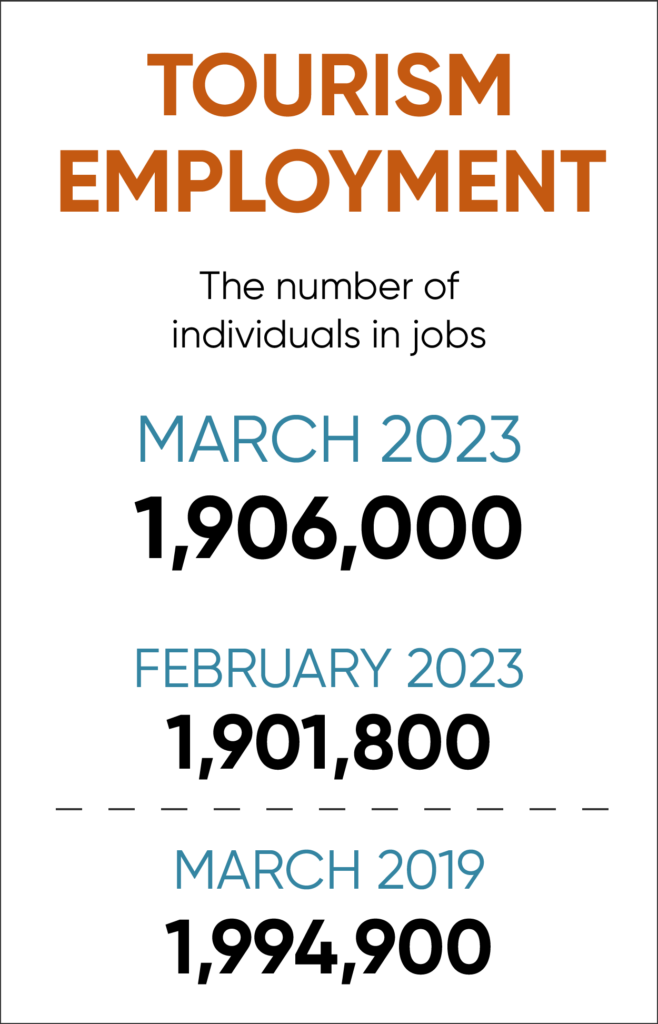
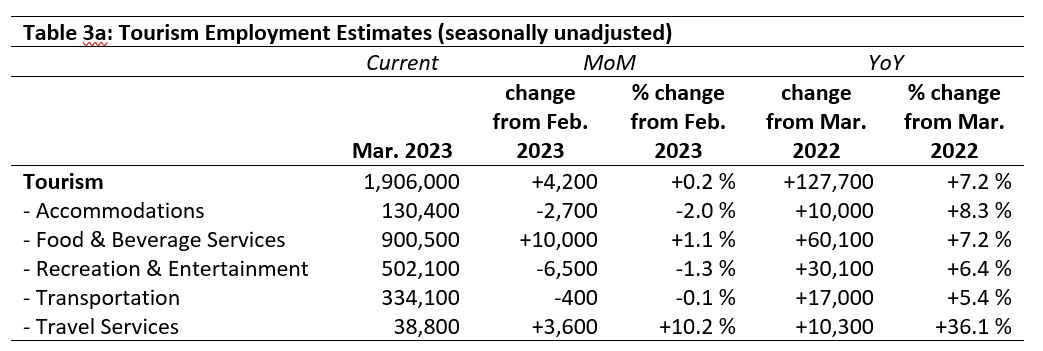
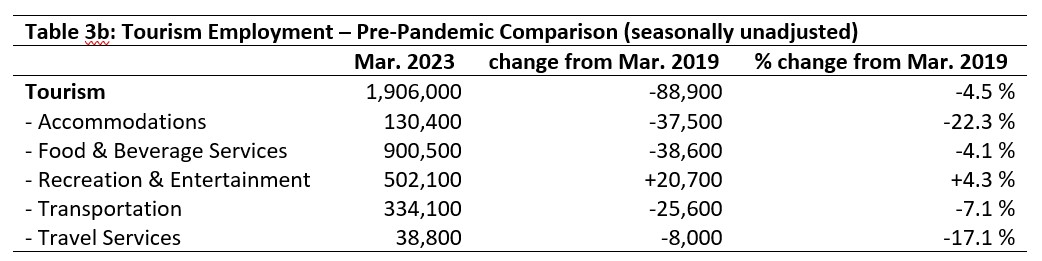
Tourism employment[4] in March accounted for 9.6% of all employment in Canada and employed 9.1% of the national available labour force. Both of these figures are below where they were in March 2019, but higher than they were in 2022 and unchanged from February. Tables 3a and 3b provide a summary of tourism employment as of March 2023.
March: Month-over-Month
Tourism employment overall stayed more or less static from February, showing an increase of 4,200 workers (accounting for only a 0.2% increase). Travel services saw substantial growth (just over 10%), while accommodations saw a modest decline of 2%. On the whole, however, the sector and its industry groups showed relative stability from the previous month.
March: Year-on-Year
As with the labour force, tourism employment was substantially stronger in March 2023 than it was in 2022: the sector as a whole saw an increase of nearly 130,000 workers. In absolute terms, the largest gains were seen in food and beverage services and in recreation and entertainment, which is unsurprising given the scale of these groups. In relative terms, travel services saw the strongest growth (+36.1%), followed by accommodations (+8.3%); these are encouraging to see, as both industry groups were especially impacted by the pandemic travel restrictions. The smallest gains were seen in transportation (+5.4%).
March: Pre-pandemic Baseline
Tourism employment remained below March 2019 levels in all industry groups except for recreation and entertainment. Accommodations in particular has remained depressed, with a continuing gap of 37,500 employees, representing a loss of over 22% during the pandemic. Travel services has likewise struggled to regain lost ground.
Part-time vs. Full-time Employment
Given the various strategies employed by different operations during the peak pandemic restrictions, tracking part-time versus full-time employment can provide further insight into the labour conditions in tourism. Figure 1 provides an overview of the percentage of part-time employment across the industry groups.
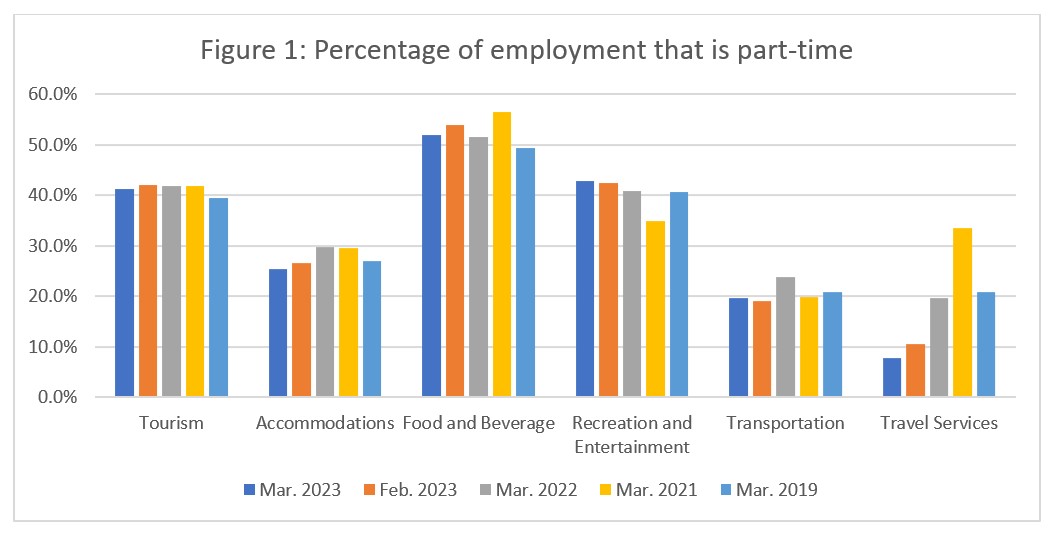
At the sector level, tourism has stayed relatively stable, although part-time employment is slightly higher now than it was pre-pandemic. Accommodations has seen a gradual reduction in part-time employment, meaning that it is employing proportionally more people full-time, while food and beverage services has seen some year-to-year fluctuations, although it has remained near the 50% mark. Recreation and entertainment saw a substantial drop in part-time employment in March 2021 relative to 2019, but has returned to a more typical pattern in 2023. Both food and beverage services and recreation and entertainment traditionally rely in large part on part-time employment, so these rates are not unexpected. Transportation and travel services tend to have more professional, full-time staff, and transportation has remained overall quite stable at around 20% part-time. Travel services has seen a substantial shift away from part-time work, which peaked at 34% in 2021 and fell below 10% in March 2023. This may reflect an increased demand in this industry, supporting a greater proportion of employees working full-time hours; the increase in both labour force and employment in this group suggest that it is growing rapidly relative to the pandemic squeeze.
Hours worked
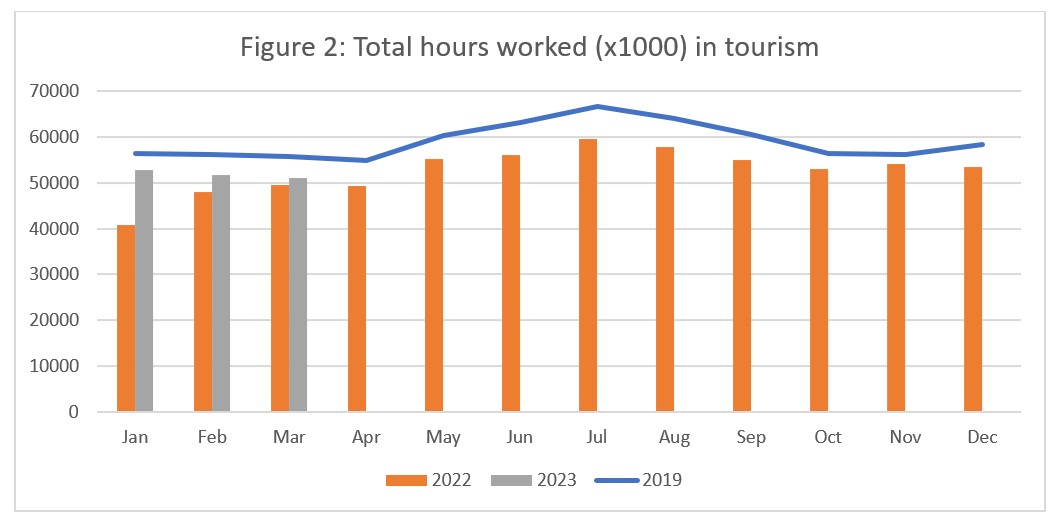
The total actual hours worked within the tourism sector is another useful metric by which to assess the health of the labour market (see Figure 2). Hours worked in March 2023 continued to parallel 2019, as it has since January, while still remaining around 7% below 2019 levels. Given that tourism employment in March 2023 was only around 4.5% below its 2019 levels, this relatively larger gap in hours worked suggests that, on average, people are working fewer hours. This possibility is supported by the trends in high-volume industry groups in Figure 1 above (part-time employment), and suggests that in spite of a tight labour market overall, tourism employees are not working as fully as they have in the past. This likely reflects a shift towards an increased prioritization of work-life balance as a result of the pandemic—another challenge facing businesses looking to fill vacancies.
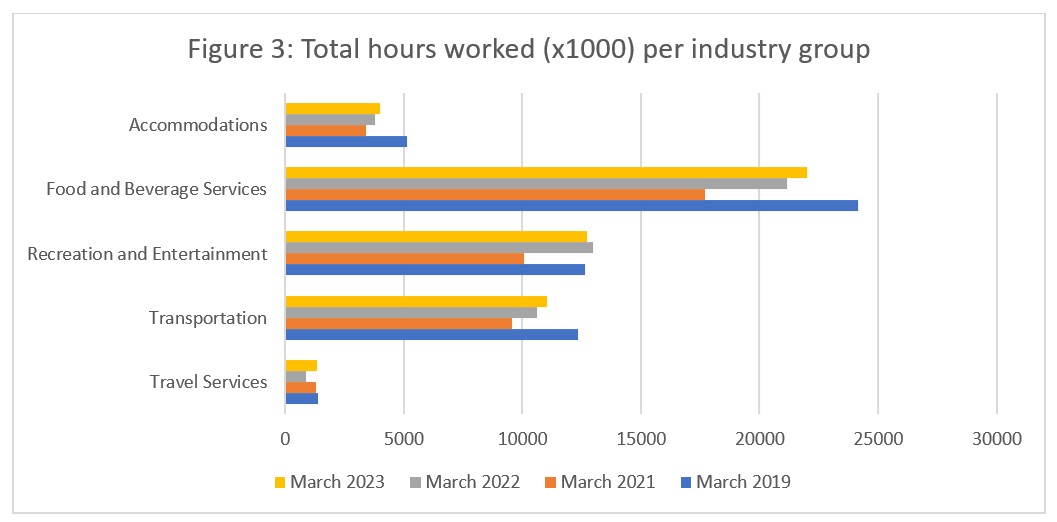
When considered across the industry groups that comprise tourism (see Figure 3), there was a fairly consistent pattern of regrowth following the sharp fall during the pandemic. Travel services and accommodations continued to post the fewest hours worked, which is unsurprising given their relatively small slice of the sector overall. Food and beverage services, as the largest industry group, posted the highest number of hours worked. Although transportation is a smaller group than recreation and entertainment in terms of number of employees, it skews more heavily towards full-time employment so its total hours worked in March were broadly comparable to those in recreation and entertainment. Accommodations, food and beverage services, and transportation continued to have a substantial gap between hours worked in March 2019 and those worked in 2023, while travel services and recreation and entertainment have returned to pre-pandemic levels.
Unemployment
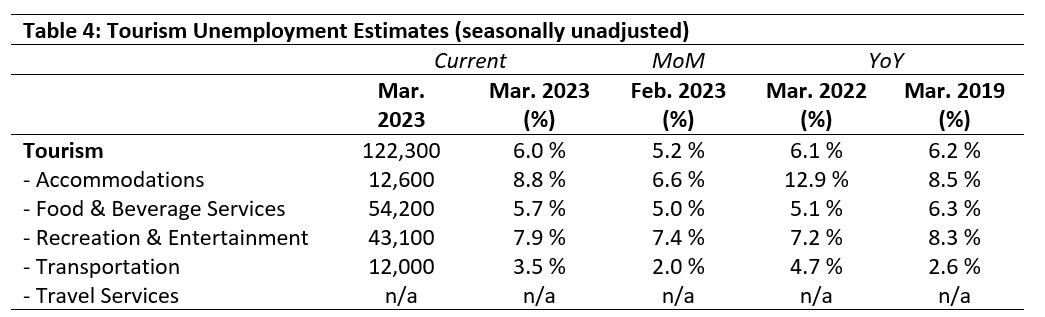
Unemployment[5] in the tourism sector in March was 6.0%, higher than the national economy average (5.4%, using seasonally unadjusted data) and higher than it was in February. Table 4 provides a summary of tourism unemployment in March 2023.
March: Month-over-Month
Unemployment was across-the-board higher in March 2023 than in February, with the largest increase being seen in accommodations (+2.2%) and smallest in recreation and entertainment (+0.5%). This increase during a period of tight labour market conditions likely reflects broader economic inflationary pressures that were driving prices up across most sectors, which was driving down some aspects of consumer spending, which in turn impacted on tourism business operations. Some employers may have been unable to meet the wage expectations of job-seekers.
March: Year-on-Year
At a sectoral level, unemployment in tourism was little changed in March from either 2022 or 2023, although there has been some movement at the industry level. Unemployment in accommodations was considerably lower in 2023 than in 2022, although slightly higher than in 2019. Transportation and recreation and entertainment followed similar general patterns: unemployment was lower than last year, but higher than 2019. Unemployment in food and beverage services was slightly higher than in 2022, but slightly lower than 2019. On the whole, the unemployment rate across the industry groups was not wildly out of step with what it was pre-pandemic.
Provincial Tourism Unemployment
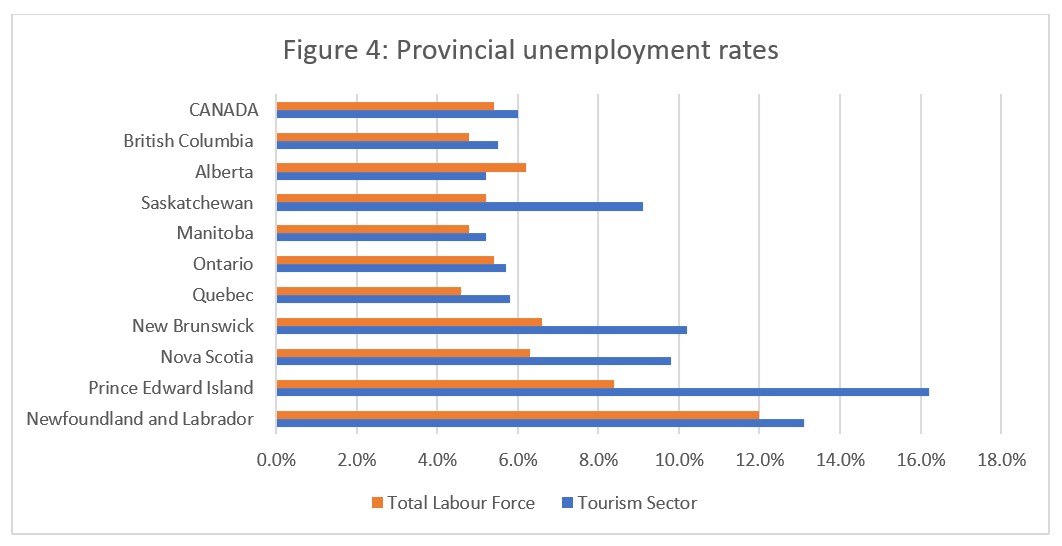
At the aggregate national level, unemployment in tourism was slightly higher than across the wider economy (see Figure 4), although as always this masked some stark regional contrasts. Tourism unemployment remained higher in the Atlantic provinces than across most of the rest of the country, although unemployment in Saskatchewan’s tourism sector was a closer match to New Brunswick and Nova Scotia than to the other central provinces. Prince Edward Island (16.2%) and Newfoundland and Labrador (13.1%) had the highest unemployment rates, both in tourism and across the broader economy. The lowest tourism unemployment rates were in Manitoba and Alberta (5.2% for both provinces), and Alberta was the only province whose tourism unemployment rate was lower than that of the broader provincial economy (6.2%, using seasonally unadjusted data).
View more employment charts and analysis on our Tourism Employment Tracker.
[1] As defined by the Canadian Tourism Satellite Account. The NAICS industries included in the tourism sector those that would cease to exist or would operate at a significantly reduced level of activity as a direct result of an absence of tourism.
[2] SOURCE: Statistics Canada Labour Force Survey, customized tabulations. Based on seasonally unadjusted data collected for the period of March 12 to 18, 2023.
[3] The labour force comprises the total number of individuals who reported being employed or unemployed (but actively looking for work). The total Canadian labour force includes all sectors in the Canadian economy, while the tourism labour force only considers those working in, or looking for work in, the tourism sector.
[4] Employment refers to the total number of people currently in jobs. Tourism employment is restricted to the tourism sector, while employment in Canada comprises all sectors and industries.
[5] Unemployment is calculated as the difference between the seasonally unadjusted labour force and seasonally unadjusted employment estimates. The percentage value is calculated against the labour force.