Canadian Tourism Labour Market Snapshot
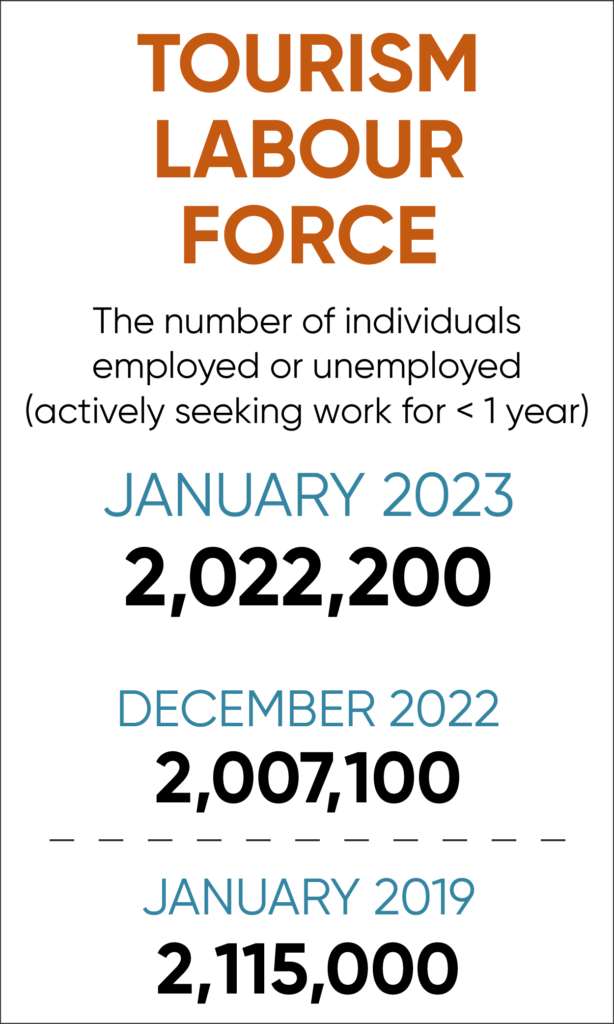
The tourism sector[1] in January 2023 saw an increase in its labour force (+15,100) over the previous month[2], but a slight decrease in employment (-8,500). Both indices remained below the 2019 benchmark. This drop in employment reflected a decrease of 1.2% in the number of hours worked, although the ratio of part-time to full-time work changed very little.
Unemployment was 1% higher in January than in December, but significantly lower than in January 2022, and overall tourism unemployment matched the broader Canadian unemployment rate of 5.5% (using seasonally unadjusted data).
At the industry group level, the profile overall showed some variability, with an across-the-board improvement on last year, and some industry-group-level variation relative to December 2022.
Table 1 provides a snapshot of the industry groups’ performance across labour force, employment, and unemployment, as compared with December 2022 [MoM], January 2022 [YoY], and January 2019 (pre-pandemic baseline). Small arrows represent changes of less than 1%.
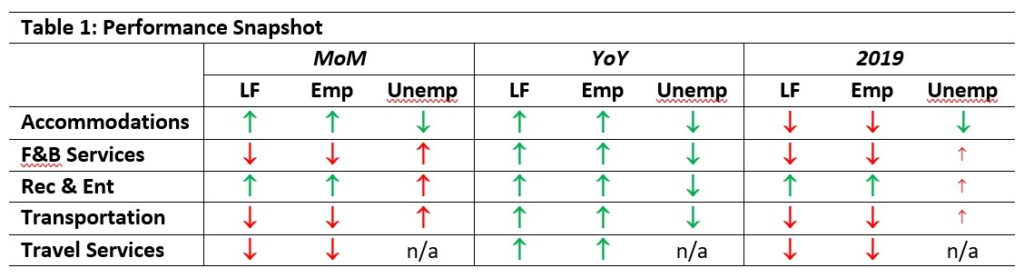
Most of the industries saw some decline over their performance in December 2022, with the exception of accommodations, which saw improvement in labour force, employment, and unemployment. Recreation and entertainment also saw growth in labour force and employment, but experienced a hike in unemployment. Although there were some isolated improvements over January 2019, overall the sector and its constituent industry groups remained below their pre-pandemic levels.
Tourism Labour Force
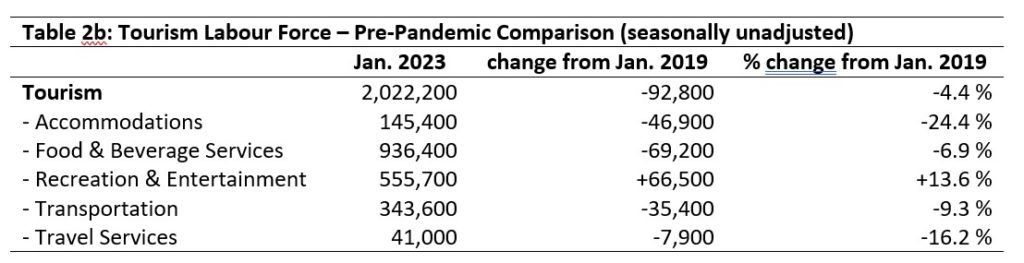
The tourism labour force[3] in January 2023 accounted for 9.7% of the total Canadian labour force, unchanged from the previous month and still below the 2019 rate of 10.7%. Tables 2a and 2b provide a summary of the tourism labour force as of January 2023.
January: Month-over-Month
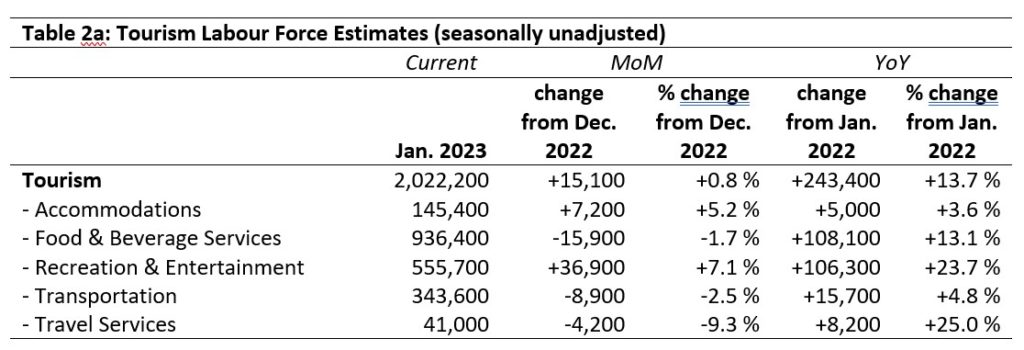
The tourism sector saw a slight overall increase in the labour force (+0.8%), but this accounts for some substantial differences at the industry group level. Recreation and entertainment and accommodations saw growth (+7.1% and +5.2%), while the other groups shrank. Travel services saw the largest relative fall (-9.3%). Recreation and entertainment saw the largest absolute gain, with almost 37,000 people entering the labour force in this industry.
January: Year-on-Year
Compared to January 2022, the sector had grown considerably: all industry groups improved over the past year, with travel services and recreation and entertainment showing the largest proportionate improvement. This likely reflects increased confidence in these industries, as health concerns related to the pandemic continued to abate; the accompanying lower unemployment rates for both groups corroborate this interpretation.
January: Pre-pandemic Baseline
The tourism labour force remains generally below 2019 levels, although recreation and entertainment had grown by 13.6%. Accommodations remained the most depressed industry group, in spite of a strong month-over-month and year-on-year performance. Workers who left the industry during the pandemic have not returned, nor have they been replaced, although the picture is starting to improve.
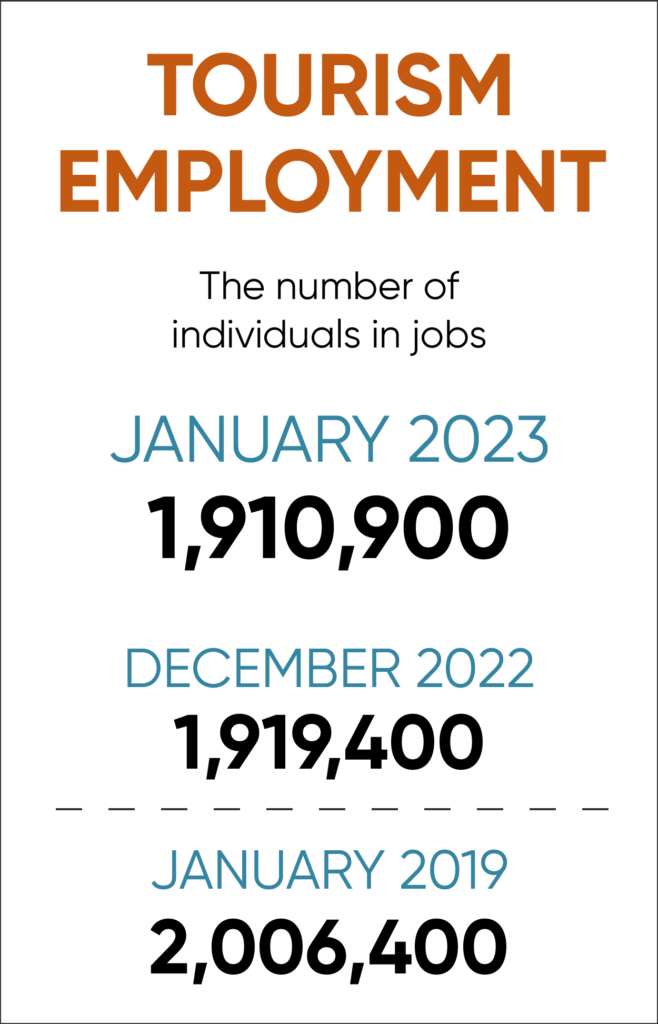
Tourism Employment
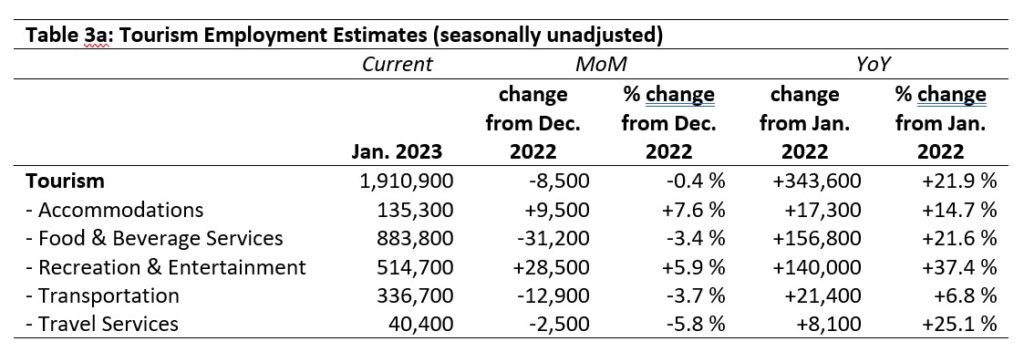
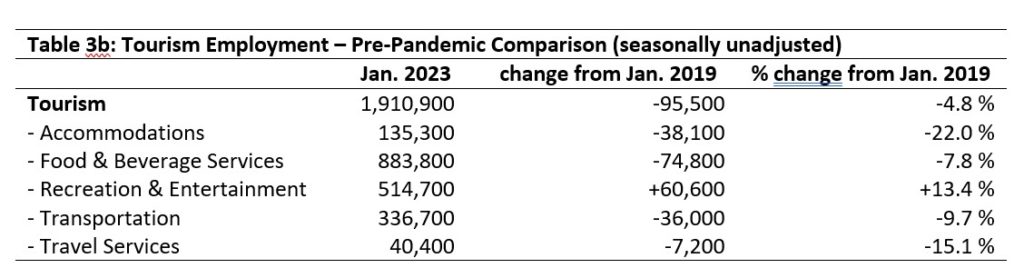
Tourism employment[4] accounted for 9.7% of all employment in Canada, unchanged from December 2022 but still below the January 2019 rate of 10.9%. The tourism sector employed 9.2% of the available national workforce. Tables 3a and 3b provide a summary of tourism employment as of January 2023.
January: Month-over-Month
Employment in tourism shrank at the sector level, but by less than half a percentage point, and this data point incorporates strong gains in recreation and entertainment and accommodations as well as considerable losses in food and beverage services, transportation, and travel services. The mismatch between labour force growth and employment loss is reflected in the increased month-over-month unemployment rate for the sector.
January: Year-on-Year
As with the labour force, tourism employment was considerably higher than it was in January 2022, with employment showing a much stronger improvement than the labour force. This is reflected in lower unemployment rates, and parallels some of the trends across the wider Canadian economy of high job vacancies and low unemployment.
January: Pre-pandemic Baseline
With the exception of recreation and entertainment, the tourism sector as a whole had not returned to pre-pandemic levels of employment in January 2023. This likely reflects fewer, and leaner, businesses in operation, as travel continues to be disrupted for a number of reasons. The growth in recreation and entertainment may be linked to changes in how Canadians spend their leisure time as the pandemic recovery continues.
Part-time vs. Full-time Employment
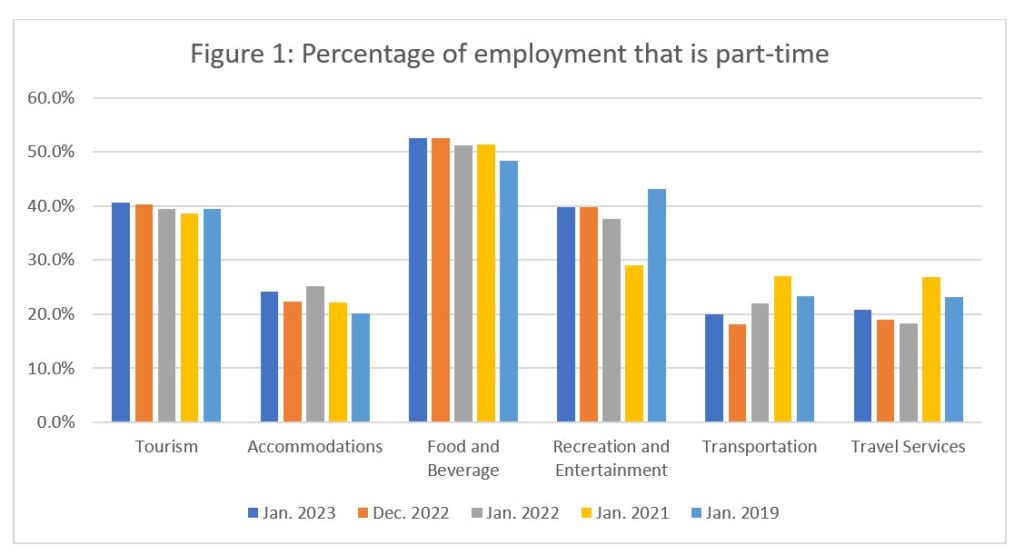
As tourism employment necessarily draws on both full-time (FT) and part-time (PT) employees, the ratio of FT to PT workers is a useful metric to gauge the stability of the workforce. Figure 1 provides an overview of the percentage of part-time employment across the industry groups.
Overall, the sector has remained stable at around 40% PT, but there is some volatility at the industry group level. Recreation and entertainment, transportation, and travel services remained below their 2019 rates in January, while food and beverage services and accommodations had surpassed January 2019 levels. Food and beverage services was the only industry group that had more PT workers than FT ones, while accommodations, transportation, and travel services had approximately 80% of their workforce as FT employees.
Hours worked
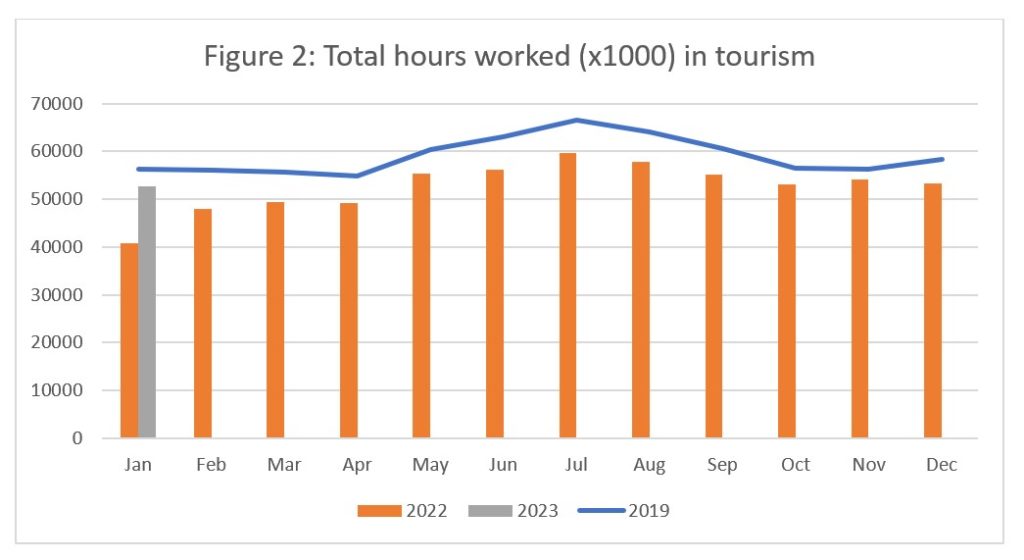
The total actual hours worked within the tourism sector is another useful metric by which to assess the health of the labour market (see Figure 2). As the calendar year has only begun, it is difficult to make any observations about long-term trends, but January 2023 showed more hours worked than January 2022, presenting a more robust labour situation than last year. The overall trajectory of 2022 closely paralleled 2019, so hopefully 2023 will continue to narrow the gap with this pre-pandemic baseline.
The average hours worked across the sector was 27.6 hours per week, meaning that, on average, tourism workers worked fewer hours than the Statistics Canada definition of full-time work (30 hours per week).
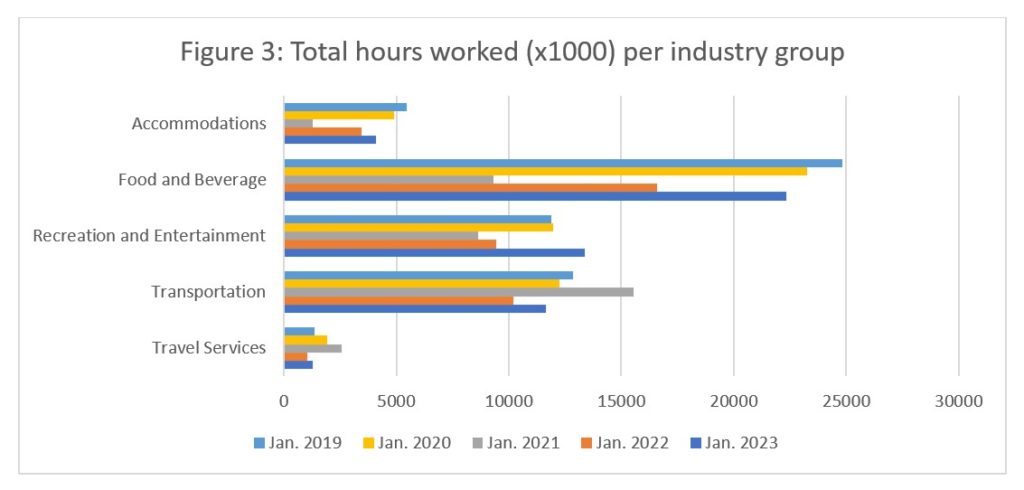
When considered across the different industry groups (see Figure 3), only recreation and entertainment had surpassed its 2019 baseline in January, showing industry group growth from year to year. As expected given the ratio of FT to PT work noted above, food and beverage services and recreation and entertainment posted an average number of hours worked per week that fell comfortably within the PT range (25.3 and 26 hours per week, respectively), while the other industry groups were on average into the FT range (30.3 hours per week in accommodations, 31.9 in travel services, and 34.6 in transportation). This distribution suggests that transportation was more reliant on full-time workers than the other industry groups, and as employment was down in January relative to December in transportation, this reflects more hours being worked by fewer people.
Unemployment
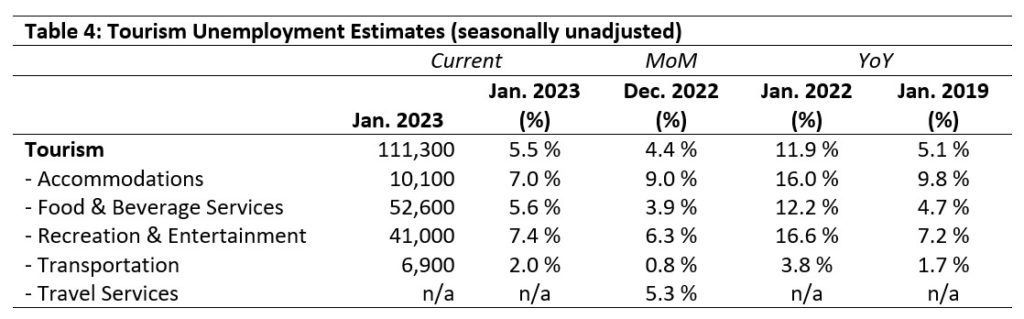
Unemployment[5] in the tourism sector in January was 5.5%, just over a full percentage point higher than in December (4.4%) and slightly higher than in January 2019 (5.1%). Tourism unemployment in January 2023 was equal to that in the larger Canadian economy, using seasonally unadjusted data.
Table 4 provides a summary of tourism unemployment in January 2023. Unemployment data for travel services was unavailable for January 2023.
January: Month-over-Month
At the sector level, January unemployment was up relative to December, and this pattern held across most industry groups. Only accommodations bucked this trend, showing a decrease in unemployment from 9% in December to 7% in January. This correlates with accommodation’s strong gains in employment, which is an encouraging start to the year for an industry group that has been having a particularly hard time recovering from the pandemic disruptions.
January: Year-on-Year
Unemployment rates in January 2023 were around half of what they were in January 2022, showing substantial overall improvement on employment in the past year. Current rates were also generally comparable to those seen in January 2019; the biggest difference between 2023 and the pre-pandemic baseline was seen in accommodations, which fell by 2.8%.
Provincial Tourism Unemployment
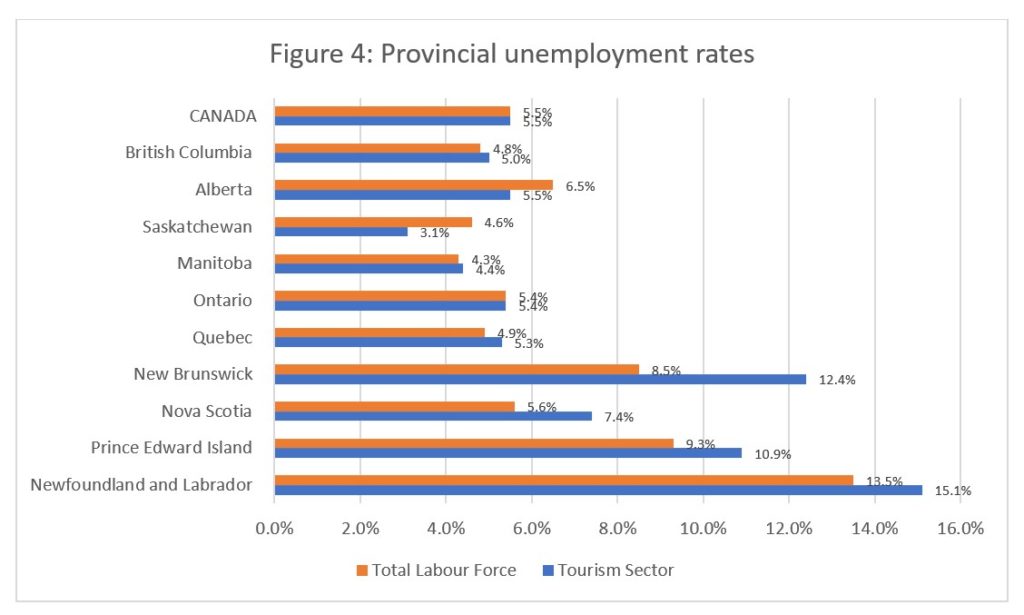
At the aggregate national level, January unemployment in tourism was on par with that in the wider economy (see Figure 4), but there was regional and provincial variation that underpinned this parity.
Tourism unemployment was lower than that of the larger provincial economy in Alberta and Saskatchewan; it was equal in Ontario; and it was higher elsewhere. Unemployment remained high across the Atlantic provinces, and tourism unemployment was highest in Newfoundland and Labrador (15.1%) and New Brunswick (12.4%); it was lowest in Saskatchewan (3.1%) and Manitoba (4.4%). Outside of the Atlantic provinces and Saskatchewan, tourism unemployment rates were near the national average, and the difference between the tourism and larger economic rates was generally small.
View more employment charts and analysis on our Tourism Employment Tracker.
[1] As defined by the Canadian Tourism Satellite Account. The NAICS industries included in the tourism sector those that would cease to exist or would operate at a significantly reduced level of activity as a direct result of an absence of tourism.
[2] SOURCE: Statistics Canada Labour Force Survey, customized tabulations. Based on seasonally unadjusted data collected for the period of January 15 to 21, 2023.
[3] The labour force comprises the total number of individuals who reported being employed or unemployed (but actively looking for work). The total Canadian labour force includes all sectors in the Canadian economy, while the tourism labour force only considers those working in, or looking for work in, the tourism sector.
[4] Employment refers to the total number of people currently in jobs. Tourism employment is restricted to the tourism sector, while employment in Canada comprises all sectors and industries.
[5] Unemployment is calculated as the difference between the seasonally unadjusted labour force and seasonally unadjusted employment estimates. The percentage value is calculated against the labour force.