
Canadian Tourism Labour Market Snapshot
The tourism sector[1] in December saw an overall slight increase in both labour force and employment over the previous month[2], but was still substantially below 2019 levels on both indices. It is clear, however, that this relative strengthening is almost entirely carried by food and beverage services, which saw strong improvement in across all key indices.
The total number of hours worked in tourism fell by 1.4% from November, and the ratio of full-time to part-time work decreased slightly.
At the industry group level, the profile overall is not much different than what was seen in November’s Labour Force Survey (LFS) estimates. Table 1 provides a snapshot of the industry groups’ performance across labour force, employment, and unemployment, as compared with November 2022 [MoM], December 2021 [YoY], and with December 2019 as a pre-pandemic baseline. Small arrows represent changes of less than 1%
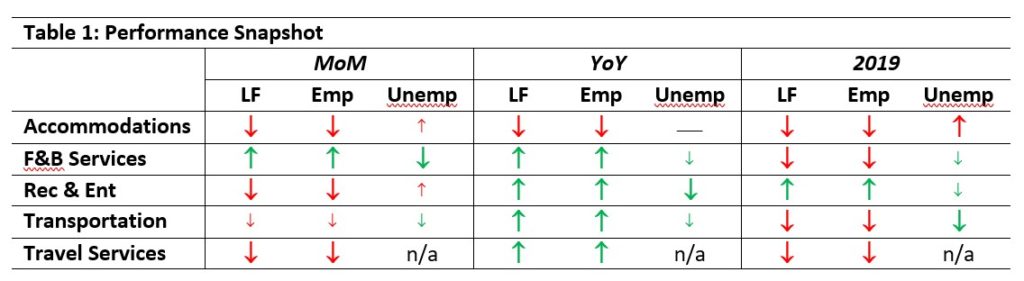
For the most part, the industry groups showed poorer performances than in November, but had generally improved on December 2021. Accommodations showed the weakest performance across the three snapshots, and the continued labour difficulties experienced in this industry group suggest a more complex landscape than what can be fully mapped from the LFS data alone.
On the other hand, recreation and entertainment outperformed its pre-pandemic labour force benchmark, operating at 103.1% of December 2019 levels.
Unemployment changes were generally small from November, and better than last year.
Tourism Labour Force
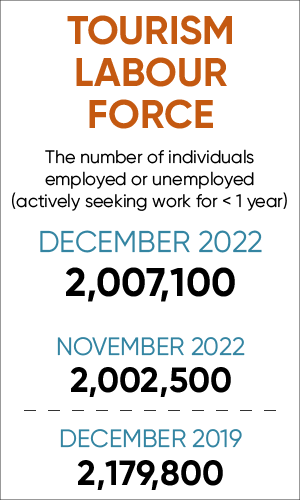
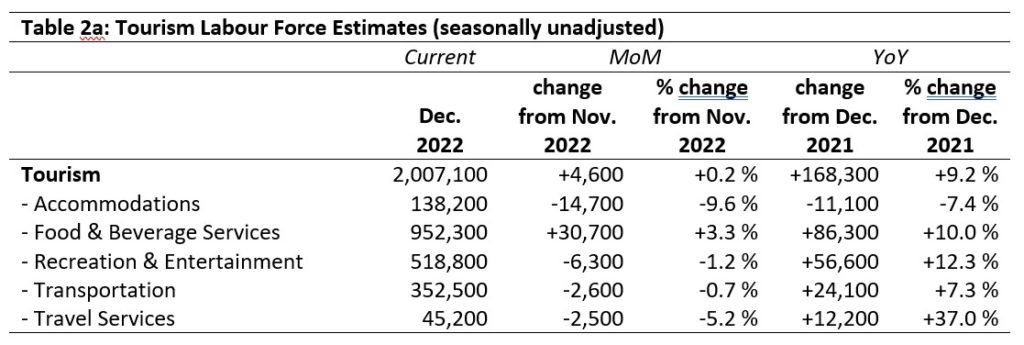
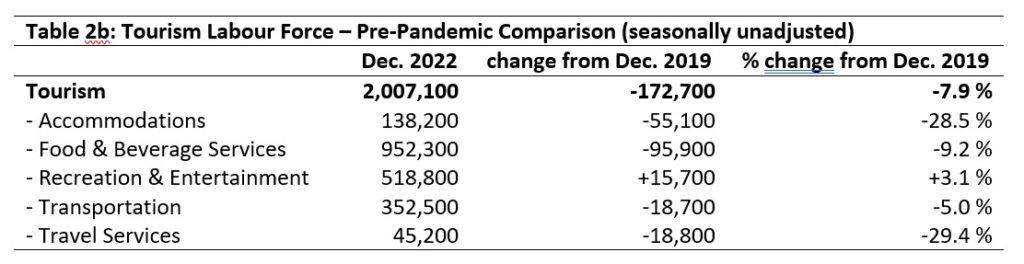
The tourism labour force[3] in December accounted for 9.7% of the total Canadian labour force, unchanged since November but still below the pre-pandemic rate of 10.9%. Tables 2a and 2b provide a summary of the tourism labour force as of December 2022.
December: Month-over-Month
Relative to November, only food and beverage services saw an increase in the labour force, gaining 3.3%. Because this is such a large industry group, the tourism sector as a whole saw an overall growth, but all other industry groups saw declines. Accommodations was hit the hardest (-9.6%), followed by travel services (-5.2%).
December: Year-on-Year
Compared to December 2021, the sector overall has seen strong improvement (+9.2%), reflected across most industry groups. Accommodations saw a substantial decline, while the other industries saw considerable improvement. Travel services in particular showed strong growth (+37%), and recreation and entertainment and food and beverage services also saw a large influx of new people entering (or re-entering) the labour force.
December: Pre-pandemic Baseline
With the exception of recreation and entertainment, the labour force for all tourism industry groups remained substantially below December 2019 levels. Travel services and accommodations saw the biggest losses, indicating that people who left those industries during the pandemic have not returned in large numbers. Increasing use of online booking services may be slowing recovery in travel services in particular, in spite of month-over-month improvement.
Tourism Employment
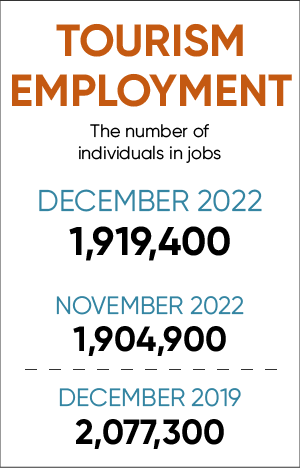
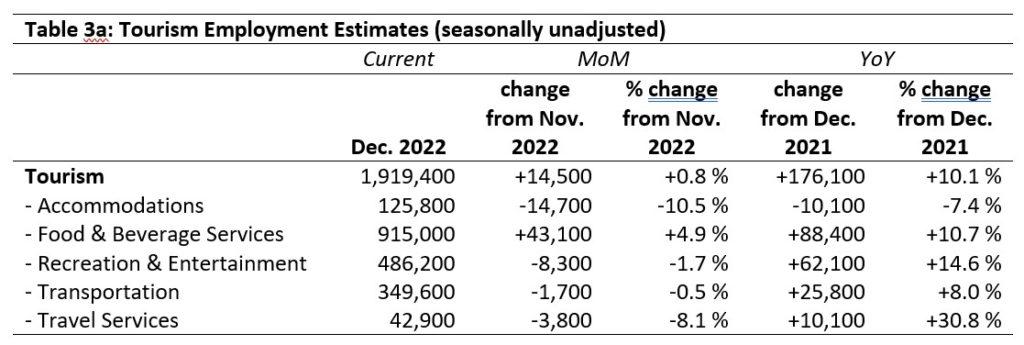
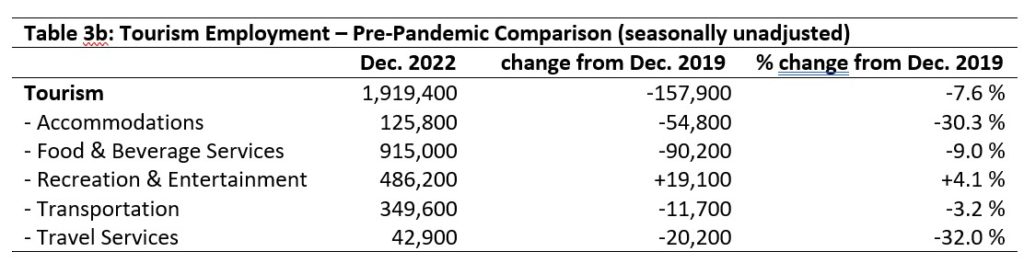
Tourism employment[4] accounted for 9.8% of all employment in Canada, only marginally up on November 2022 (9.7%) and December 2021 (9.0%), but still below the 10.9% observed in December 2019. The sector employed 9.3% of the available workforce. Tables 3a and 3b provide a summary of tourism employment as of December 2022.
December: Month-over-Month
Gains in employment in the sector overall were entirely down to employment growth in the food and beverage services industry group, which saw an improvement of 4.9%. Transportation remained largely unchanged, while accommodations and travel services were the hardest hit. Employment losses were generally lower than labour force losses, reflecting December’s tight labour market.
December: Year-on-Year
The sector as a whole saw a 10.1% improvement in employment relative to December 2021, with travel services and recreation and entertainment showing the strongest relative growth. Accommodations alone saw a decline of 7.4%, which matched the decline observed in the labour force.
December: Pre-pandemic Baseline
Overall, employment in tourism was substantially lower in December 2022 than in December 2019, with the largest losses incurred in accommodations and in travel services. Given the dependence of these two industry groups on travel—they cannot be supported in the same way by local residents as other industries can—this drop is not entirely surprising, but it shows a generally hard road to recovery for these industries. In contrast, employment in recreation and entertainment was up 4.1% on pre-pandemic levels.
Part-time vs. Full-time Employment
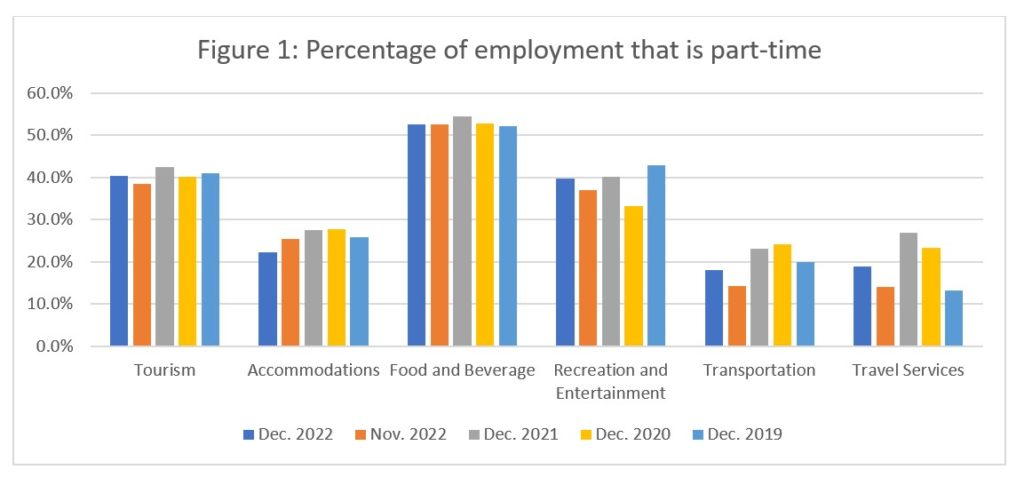
As tourism employment relies on both full-time (FT) and part-time (PT) employees, the ratio of FT to PT workers provides useful insights on workforce composition. Figure 1 provides an overview of the percentage of part-time employment across the industry groups. Food and beverage services was the most stable industry group over time, with PT employment consistently around 52% within this window. The part-time share of the accommodations workforce has fallen month over month and year on year, while in recreation and entertainment, transportation, and travel services, the picture has been more volatile. Many PT employees are younger (e.g., students working around their other commitments), but in increasingly fraught economic conditions, PT employees likely also include people picking up second jobs and older workers (e.g., those over 65) returning to the workforce to make ends meet.
Hours worked
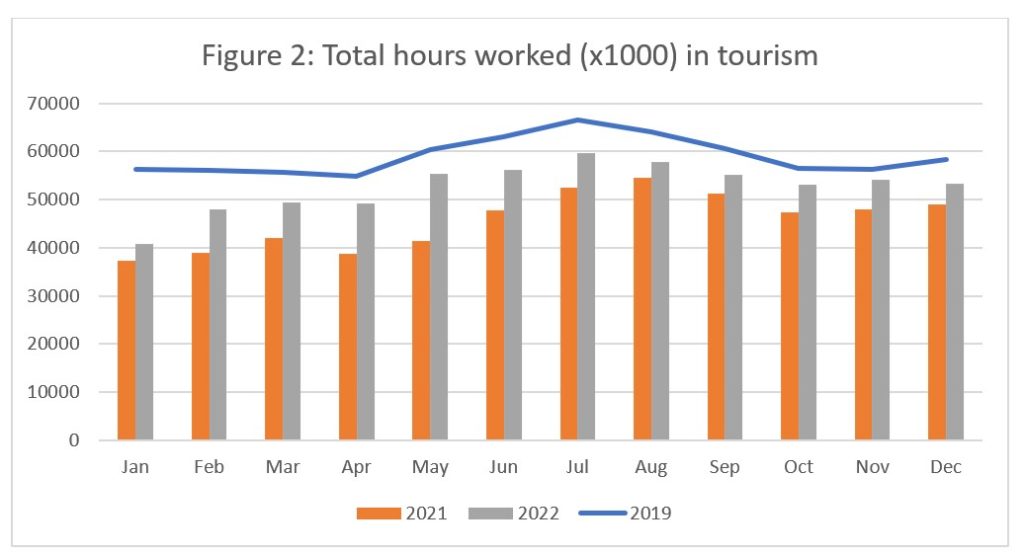
The total actual hours worked within the tourism sector is another useful metric by which to assess the health of the labour market (see Figure 2), particularly when taken into consideration alongside other indices. Throughout 2022, the number of hours worked generally paralleled the numbers from 2019 and gradually narrowed over the course of the year. This pattern was slightly disrupted in December, when the total number of hours worked dropped from November, but the hours worked remained higher than in 2021.
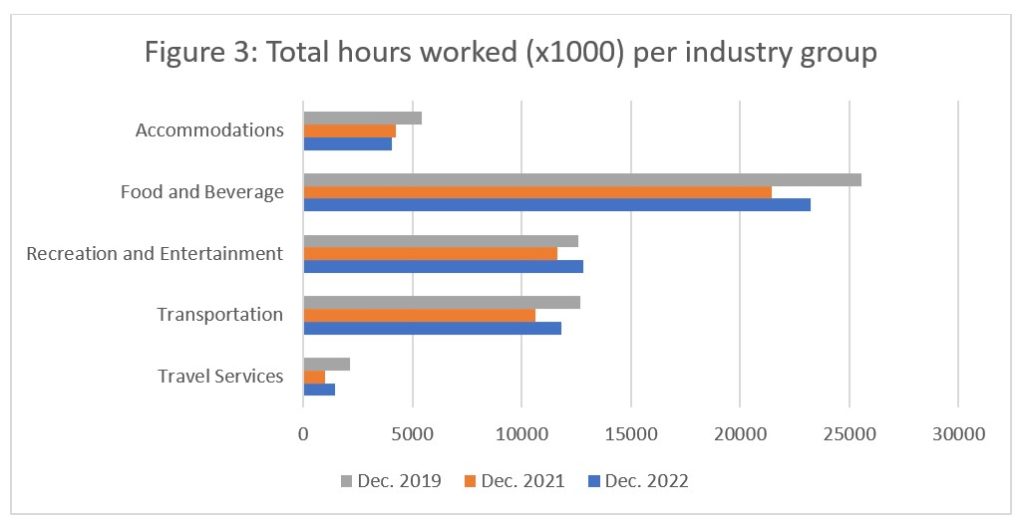
Across the industry groups, total hours worked (Figure 3) increased on last year, and in many cases, were also higher than in 2019. In accommodations, total hours worked have been increasing, which is interesting given that employment and labour force have dropped over the same time period: more work is being done by a smaller workforce, which is also reflected in the shift in accommodations towards fewer PT employees. In contrast, recreation and entertainment is showing fewer total hours worked than in 2019, in spite of employment being higher in December 2022 than in December 2019: this shows an increase in PT work during this time frame.
Unemployment
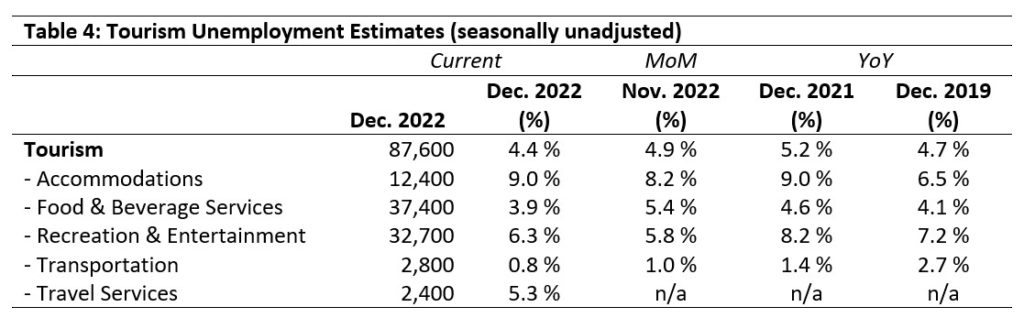
Unemployment[5] in the tourism sector in December was 4.4%, which was the same as that in the broader Canadian economy (using seasonally unadjusted data). Provincial trends are discussed below. Table 4 provides a summary of tourism unemployment in December 2022. Because unemployment data for travel services has not been available from Statistics Canada in previous cycles, the only observation possible at this point is that it was higher in December than the sector average, but not as high as some other industry groups.
December: Month-over-Month
At the sector level, unemployment was down from November, but at the industry group level, the picture is more complex. Food and beverage services saw a sizeable drop, which goes hand-in-hand with the relative changes in labour force and employment for this industry. Transportation also saw a drop over the past month, but it was much more modest. On the other hand, in accommodations and in recreation and entertainment, there was a small increase (less than 1%). In recreation and entertainment, this may be an inevitable by-product of growth in the industry (increases in both labour force and employment), but in accommodations it suggests a reluctance on the part of accommodations workers to fully (re-)engage with employers.
December: Year-on-Year
Generally, unemployment rates were lower in December 2022 than in 2021 or 2019, with the exception of the accommodations industry group, which rose from 6.5% in 2019 to 9.0% in 2021, and has stayed steady across Decembers. Given the twin pressures of a tight labour market and the current period of financial stress, this high rate of unemployment suggests deeper labour issues within this industry group. The labour force has shrunk, meaning there are fewer potential workers for each available job, but unemployment has also increased: people are reluctant to accept work in this field, for reasons that are not immediately evident from the LFS data alone.
Provincial Tourism Unemployment
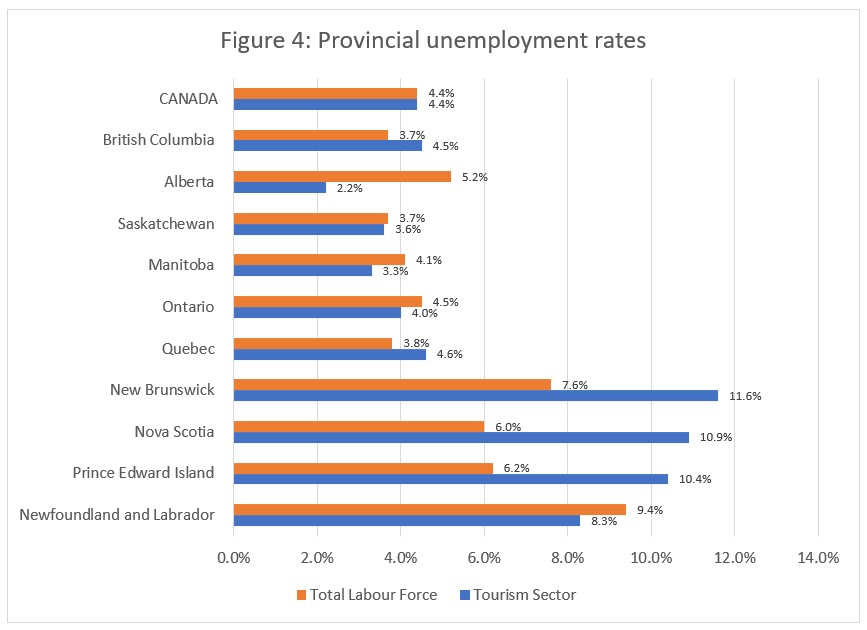
At the aggregate national level, unemployment in tourism was equal to that of the larger Canadian labour force (see Figure 4), but there was variety at the provincial level. Tourism unemployment was lowest in Alberta and Manitoba, and highest in the Atlantic provinces. In New Brunswick, Nova Scotia, and Prince Edward Island, tourism unemployment far outstripped unemployment in the larger economic sphere, but this pattern was reversed for Newfoundland and Labrador. Unemployment rates across the central and western provinces were broadly comparable to the national averages.
Some Observations on the Atlantic Provinces
In recent months, unemployment numbers have been higher in the Atlantic provinces than elsewhere in the country. Partly this has to do with scale: the economies of the Atlantic provinces are generally smaller than in the other provinces, and there is a distorting effect when small numbers are used to calculate percentages. Differences that are not enormous in absolute terms can become amplified, so when big percentages are presented, it is worth looking at the raw numbers to contextualize the reported figures. Tables 5a to 5d present a snapshot of each of the four Atlantic provinces.
A second consideration is the intersection of seasonality, travel conditions, and weather. This past summer and autumn have seen several big storms impact the Atlantic provinces, sometimes with devastating effects on infrastructure and resource allocation. These disruptions can close businesses, draw employees into other sectors, and dissuade tourists from visiting. This kind of reduction in business—entirely understandable in the wake of a lengthy storm cleanup—can be particularly difficult for businesses in off seasons, when numbers of visitors are already depressed. In this sense, 2022 has been a particularly trying year for Atlantic Canada, and this is reflected in the LFS data.
Prince Edward Island
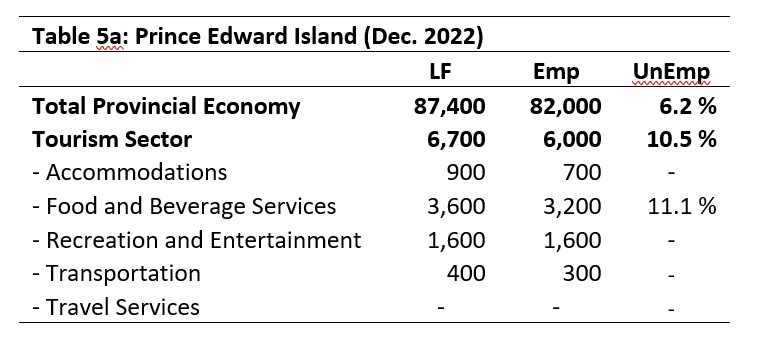
Tourism employment accounted for 7.3% of all employment in the province. Unemployment in tourism in PEI in December was substantially higher than in the province more generally (using seasonally unadjusted data). Data was suppressed for travel services and considered unreliable (due to estimation processes in the data collection and aggregation) for most other industry groups.
Newfoundland and Labrador
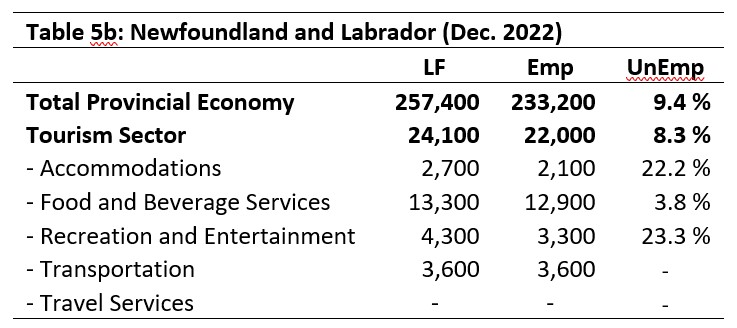
Tourism employment in NL accounted for 9.4% of all employment in the province. Unemployment in tourism in NL was lower in December than it was in the provincial economy more generally, using seasonally unadjusted data. This is largely an effect of low unemployment in food and beverage services, which is the largest tourism industry group by a considerable margin. Unemployment was above 20% for both accommodations and recreation and entertainment.
Nova Scotia
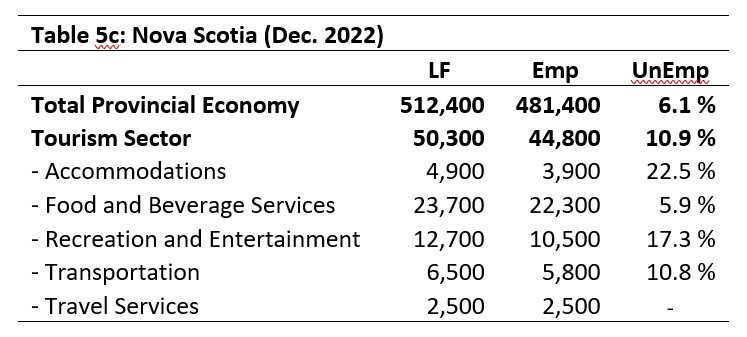
Tourism employment in NS accounted for 9.3% of all employment in the province. Tourism unemployment in NS in December was higher than in the provincial economy (using seasonally unadjusted data), and followed a similar pattern as was seen nationally and across other provinces at the industry group level. Low unemployment in food and beverage services masked considerably higher rates in other industry groups.
New Brunswick
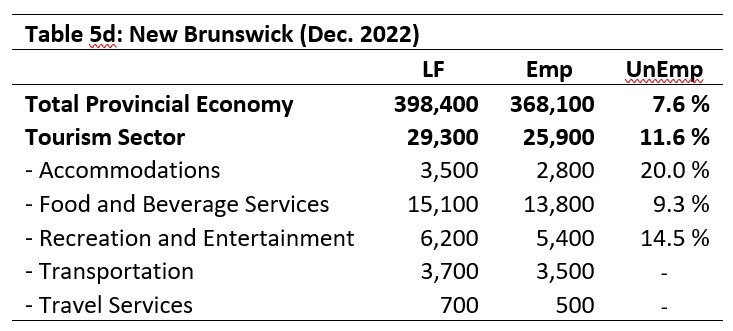
The picture in NB is also similar to what we have observed elsewhere, although the relatively low unemployment rate in food and beverage services was still higher than the provincial economy-wide average. Tourism employment in NB accounted for 7.0% of all employment in the province, and accommodations posted the highest unemployment rate.
View more employment charts and analysis on our Tourism Employment Tracker.
[1] As defined by the Canadian Tourism Satellite Account. The NAICS industries included in the tourism sector those that would cease to exist or would operate at a significantly reduced level of activity as a direct result of an absence of tourism.
[2] SOURCE: Statistics Canada Labour Force Survey, customized tabulations. Based on seasonally unadjusted data collected for the period of December 4 to 10, 2022.
[3] The labour force comprises the total number of individuals who reported being employed or unemployed (but actively looking for work). The total Canadian labour force includes all sectors in the Canadian economy, while the tourism labour force only considers those working in, or looking for work in, the tourism sector.
[4] Employment refers to the total number of people currently in jobs. Tourism employment is restricted to the tourism sector, while employment in Canada comprises all sectors and industries.
[5] Unemployment is calculated as the difference between the seasonally unadjusted labour force and seasonally unadjusted employment estimates. The percentage value is calculated against the labour force.