Canadian Tourism Labour Market Snapshot
On the whole, the tourism sector[1] remained relatively stable compared to September, although that sectoral stability is masking some shifts at the industry group level[2]. Across the sector, there were modest increases in the labour force and in employment, and the total hours worked continued to narrow the gap between pre-pandemic levels and more recent estimates. Unemployment was up slightly from September, but remained lower than both 2021 and 2019 rates.
At the industry group level, performances varied, and there was no consistent relationship between labour force availability, employment, and unemployment. Table 1 provides a snapshot of the industry groups’ performance across labour force, employment, and unemployment, as compared with September 2022 [MoM], October 2021 [YoY], and with October 2019 as a pre-pandemic baseline.
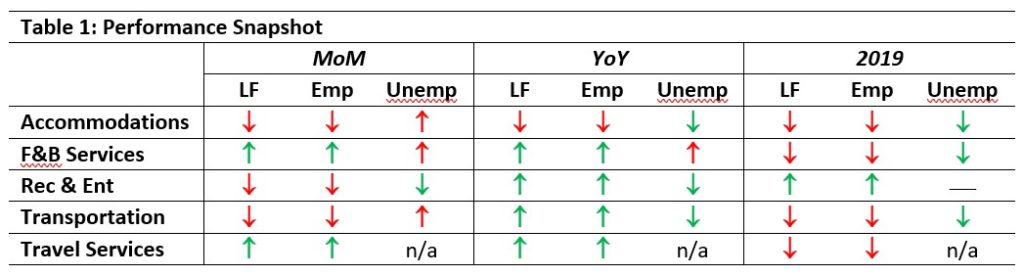
Food and beverage services and travel services showed growth across the past month and the past year. Recreation and entertainment and transportation fell relative to September, but grew since last year. Recreation and entertainment is also the only group that showed an improvement over pre-pandemic (2019) levels. On the other hand, accommodations showed lower numbers in terms of both labour force and employment across all comparisons, and is discussed in more detail in the final section of this summary report.
Tourism Labour Force
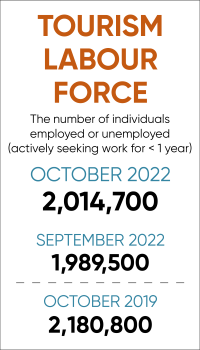
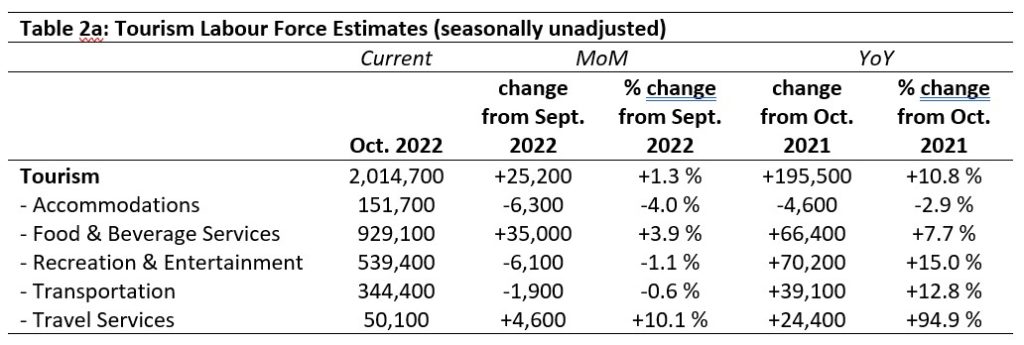
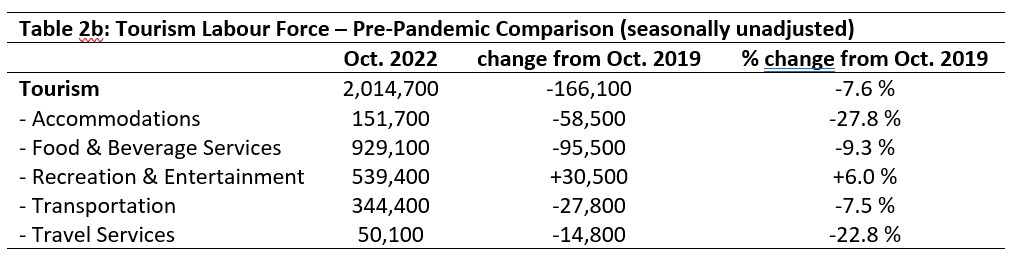
The tourism labour force[3] iin October accounted for 9.8% of the total Canadian labour force, a very slight increase from September (9.7%) but still below the pre-pandemic level of 10.8%. Tables 2a and 2b provide a summary of the tourism labour force as of October 2022.
October: Month-over-Month
The total labour force in Canada remained static from September to October this year (+0.4%), while the tourism sector saw modest growth (+1.3%, or 25,200 people). This growth was driven by substantive gains in the food and beverage services industry group and in travel services. All other industry groups saw a decrease, with accommodations being the hardest hit.
October: Year-on-Year
Compared to October 2021, the tourism labour force has grown considerably, showing an increase of just over 10%. All industry groups showed gains in the tens of thousands, except for accommodations, which saw a substantial decrease. Travel services in particular was doing remarkably well, having nearly doubled its share of the labour force since 2021.
October: Pre-pandemic Baseline
On the whole, the labour force in tourism remained lower than it was in 2019 (92.4% of its 2019 size), with accommodations again showing the biggest gap (as a percentage: given the disparity in industry group sizes, this normalized approach allows the most meaningful comparisons to be made). Travel services was also depressed, in spite of the growth in recent periods. Recreation and entertainment alone has grown beyond its 2019 levels.
Tourism Employment
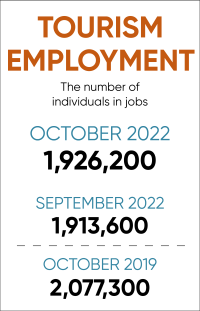
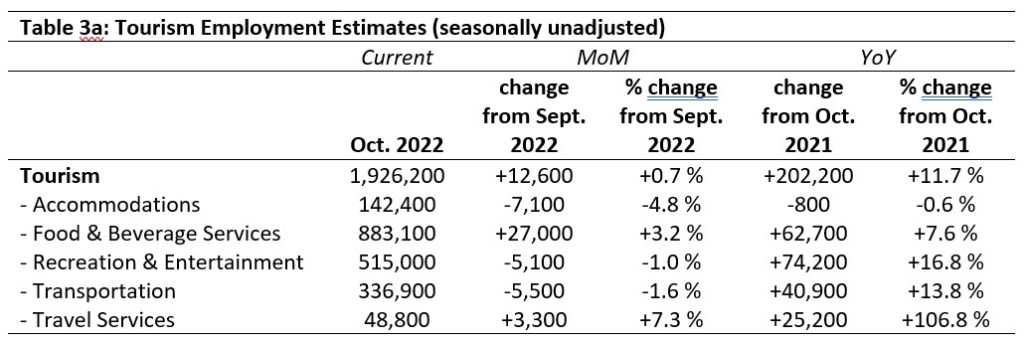
In October, tourism employment[4] accounted for 9.8% of all employment in Canada, and the sector employed 9.3% of the total available labour force—these figures are unchanged from last month. This remains below the pre-pandemic tourism employment rate of 10.3% of the total available labour force (October 2019), but continues to improve year-on-year. Tables 3a and 3b provide a summary of tourism employment as of October 2022.
October: Month-over-Month
Employment in the sector stayed about the same level as in September, with a net gain of less than one per cent. However, that growth was due to substantial employment increases in food and beverage services and in travel services, which balanced out losses elsewhere. Accommodations remained the hardest-hit industry group, in employment as well as in the labour force.
October: Year-on-Year
Tourism employment was up on October 2021, with almost all industry groups showing impressive gains. Employment in accommodations remained static on last year, while employment in travel services more than doubled.
October: Pre-pandemic Baseline
As with the labour force data, employment data on tourism shows an overall drop from 2019. Accommodations and travel services showed the largest percentage difference, although food and beverage services showed the largest absolute difference in number of workers. Recreation and entertainment industries alone have grown since before the pandemic.

Part-time vs. Full-time Employment
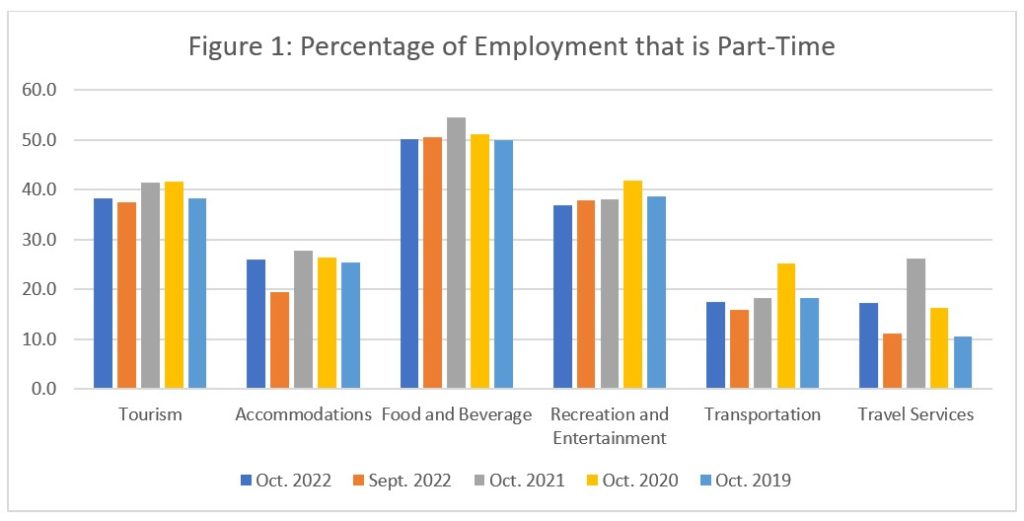
The ratio of part-time to full-time employment is a useful snapshot of the workforce as a whole (see Figure 1). In most industry groups, there was little change in the ratio of part-time to full-time work between September and October, although both accommodations and travel services saw a modest jump. Year-on-year, there tended to be relative stability across Octobers, although all industry groups saw the highest rates of part-time employment during the peak pandemic years (2020 and/or 2021). Travel services alone showed a substantive uptick in part-time employment relative to 2019.
Hours worked
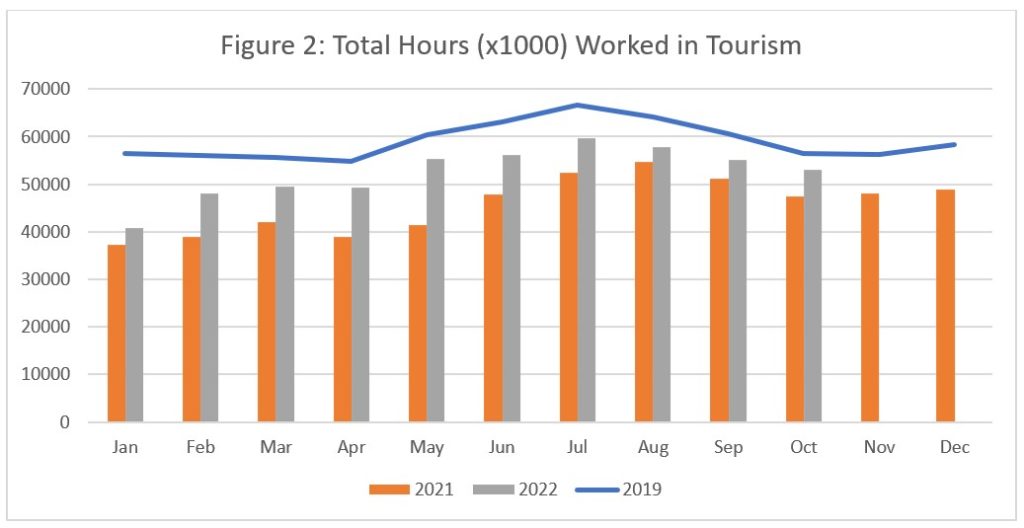
The total number of hours worked in tourism remained below the 2019 baseline (see Figure 2), but the gap continued to narrow, with the total for October 2022 higher than for 2021.
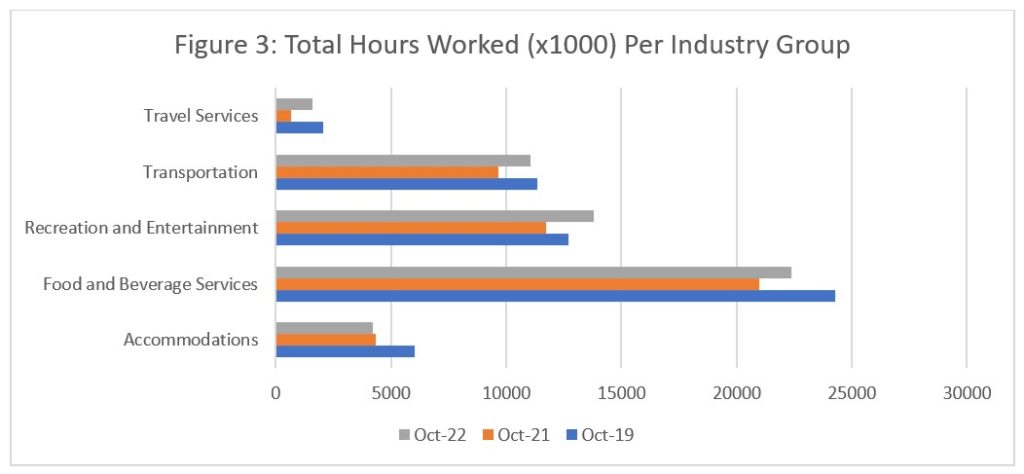
Across the industry groups, total hours worked (Figure 3) generally increased on last year, with recreation and entertainment also showing more hours worked in October 2022 than in 2019. Only accommodations showed a continued decrease from pre-pandemic levels.
Unemployment
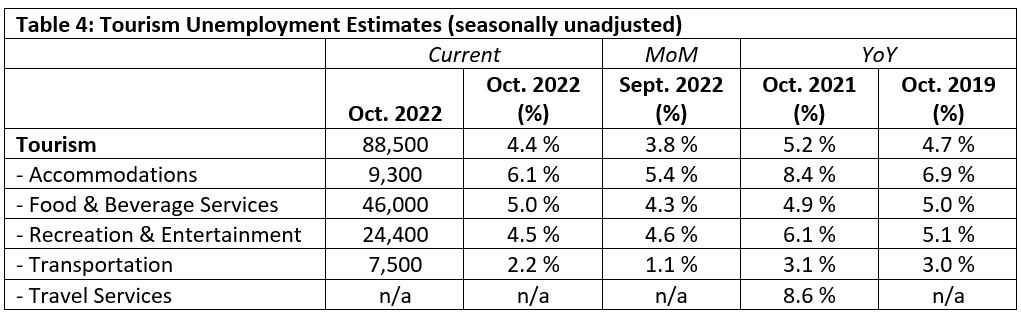
October unemployment[5] in the tourism sector (4.4%) was slightly lower than that reported in the Canadian economy generally (4.6%). Provincial trends are discussed below. Table 4 provides a summary of tourism unemployment as of October 2022.
October: Month-over-Month
There was an increase in unemployment from September across the sector as a whole, which was echoed across the industry groups, with the exception of recreation and entertainment, which remained essentially static.
October: Year-on-Year
Tourism unemployment was lower this month than last year, across the industry groups except for food and beverage services, which remained essentially unchanged. Although accommodations had the highest unemployment rate in October 2022, it nevertheless represented a substantial decrease from 2021, and is even lower than in 2019. In fact, all industry groups in the tourism sector have either lower, or the same, unemployment rates compared to October 2019.
Provincial Tourism Unemployment
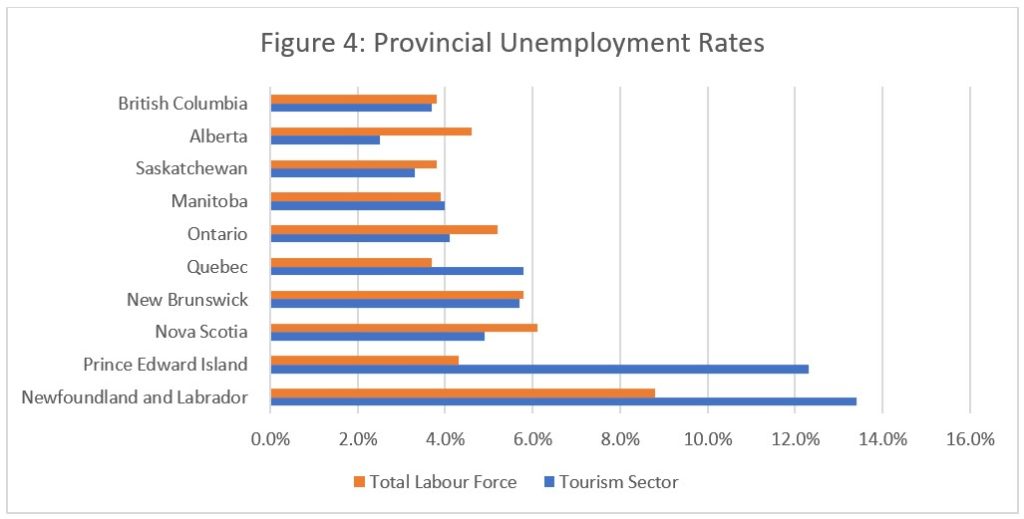
Rates of unemployment across the provinces vary (see Figure 4). Generally, unemployment in tourism is comparable to that in the broader economic sphere, although that is notably not the case in Prince Edward Island and Newfoundland and Labrador, where tourism unemployment is substantially higher than in other sectors. This is likely affected by the slow cleanup and recovery from storm Fiona, although it is impossible to accurately identify the key drivers from this data alone.
Focus on Accommodations
The Labour Force Survey (LFS) estimates for October 2022 suggest that the accommodations group is facing more labour force pressures than other industry groups in the sector. It is not immediately clear why, and indeed the full answer may not lie in the data from the LFS. That said, it may be useful to probe a bit further into the regional distribution and demographics for this industry group. The following discussion focuses only on the labour force, but in this industry, labour force and employment tend to be very closely related.
Figure 5 shows the relative share of the tourism labour force that comprises the accommodations industry group, disaggregated by province, over the past four Octobers. Most provinces have seen a decrease since 2019, with only the Maritime provinces (New Brunswick, Nova Scotia, and Prince Edward Island) showing a general trend of growth. PEI’s precipitous drop from October 2021 may be a product of storm Fiona. So while accommodation in the Maritimes is slowly increasing, it seems to be dropping off throughout most of the rest of the country, which includes provincial markets that are simply larger in scale.
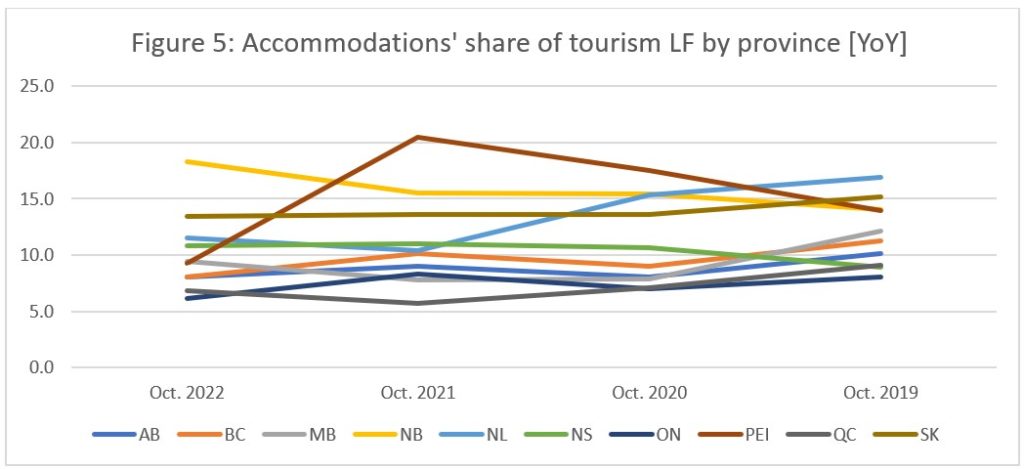
Figure 6 shows the breakdown of the labour force by age group, across the sector as a whole and by industry group. On the whole, tourism draws from a fairly young workforce, with over 50% of the labour force being under 35. However, accommodations (along with transportation and travel services) draws the majority of its labour force (>60%) from those aged 35 and older.
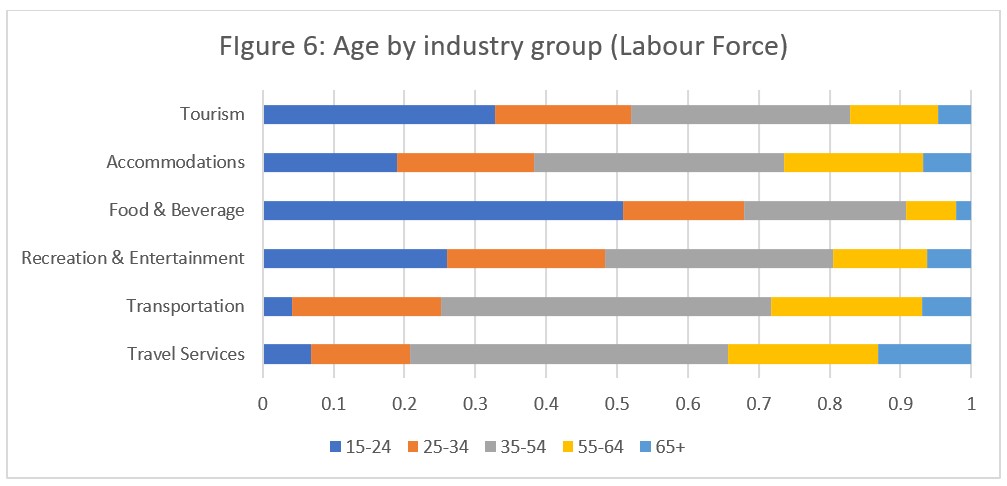
These three industry groups are also the ones which rely the most on full-time employees (see Figure 1 above). In other words, these three groups have predominantly mature, permanent, full-time workers, and may inherently find it difficult to recruit younger or part-time staff. However, where travel services is seeing strong growth (due no doubt at least in part to an easing of travel restrictions) and transportation has likewise seen an improvement over last year, accommodations has continued to struggle.
The nature of the jobs themselves may be a contributing factor in workers moving out of the field of accommodations. With transportation often requiring a technical certification of some kind (e.g., licence), and travel services offering office- or home-based work with a regular schedule, perceptions of work in accommodations may be inhibiting people from looking for work in this industry. Where COVID encouraged many people to change careers, and the current economic landscape favours job-seekers, the core problem may be young people are finding part-time work in other industries or sectors and full-time workers have taken up full-time work elsewhere in the economy and are not returning to their old jobs as the accommodations industry continues its slow trajectory of recovery.
View more employment charts and analysis on our Tourism Employment Tracker.
[1] As defined by the Canadian Tourism Satellite Account. The NAICS industries included in the tourism sector those that would cease to exist or would operate at a significantly reduced level of activity as a direct result of an absence of tourism.
[2] SOURCE: Statistics Canada Labour Force Survey, customized tabulations. Based on seasonally unadjusted data collected for the period of October 9 to 15, 2022.
[3] The labour force comprises the total number of individuals who reported being employed or unemployed (but actively looking for work). The total Canadian labour force includes all sectors in the Canadian economy, while the tourism labour force only considers those working in, or looking for work in, the tourism sector.
[4] Employment refers to the total number of people currently in jobs. Tourism employment is restricted to the tourism sector, while employment in Canada comprises all sectors and industries.
[5] Unemployment is calculated as the difference between the seasonally unadjusted labour force and seasonally unadjusted employment estimates. The percentage value is calculated against the labour force.