Canadian Tourism Labour Market Snapshot
With summer firmly over for another year, the landscape of Canada’s tourism sector[1] shifted in September, as the peak travel season drew to a close and students (who comprise a substantial portion of younger workers) returned to full-time studies. There were decreases in both labour force and employment figures from August, although looking across previous years, the sector as a whole continued to improve[2].
Overall, tourism employment accounted for 9.3% of the Canadian labour force in September, a slight decrease relative to August (9.5%) but continuing the year-over-year trend back towards pre-pandemic levels.
September unemployment was lower in the tourism sector (3.8%) than across the Canadian economy generally (4.7%), using seasonally unadjusted data. This was largely also true at the provincial level, except for Quebec and Manitoba, where sector unemployment was higher than the overall provincial levels.
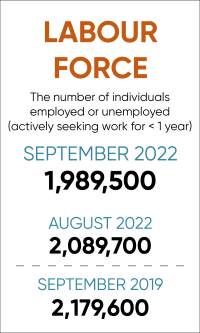
The tourism labour force shrank by 100,000 workers from August, and remained lower than pre-pandemic levels: September 2022’s labour force was 92% that of September 2019.
However, employment in the sector was generally higher last month than in September 2021 (+9.6%), except in the accommodations and food and beverage services industries, which remained static. Transportation had grown since August, showing gains in employment (around 30,900 workers, +9.9%) and an increase in total number of hours worked (around +12%). The other industries shrank slightly over the same period.
Tourism Labour Force
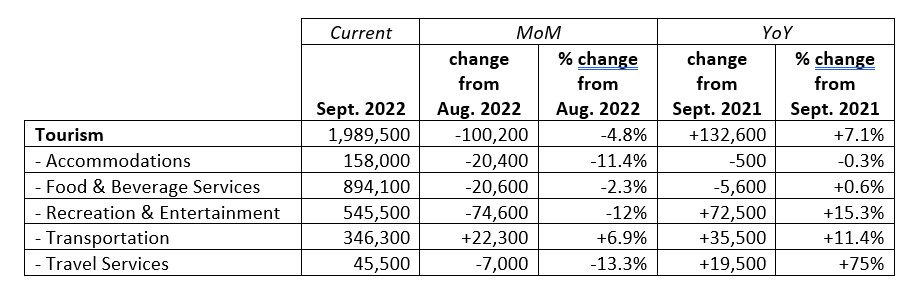
The tourism labour force[3] in September accounted for 9.7% of the total Canadian labour force, a slight decrease from August (9.9%), and still below the pre-pandemic level (10.8%). Table 1 provides a summary of the Tourism Labour Force as of September 2022.
Table 1: Tourism Labour Force Estimates (seasonally unadjusted)
September: Month-over-Month
The total labour force in Canada shrank from August to September this year, and the tourism sector was no exception, falling by 100,200 workers (-4.8%). The different industries that make up tourism generally followed this pattern, with losses ranging from 2.3% (food & beverage services) to 13.3% (travel services). Transportation alone saw a modest growth.
September: Year-on-Year
Relative to September 2021, the tourism labour force showed healthy improvement across the board, except for accommodation and food & beverage services, which remained essentially unchanged. The largest increase was in travel services: although there was a drop relative to August, the annual perspective suggests that, seasonal changes notwithstanding, the industry group continued to rebound.
Pre-pandemic Baseline
The tourism labour force in September 2022 was 91% that of September 2019 (2,179,600), so it has not yet fully recovered from the discontinuities of COVID-19. Accommodations and travel services remained the most heavily impacted, at 72% and 71% of their respective pre-pandemic levels. Recreation & entertainment alone improved overall, with this group reaching 106% of its September 2019 size.
Tourism Employment
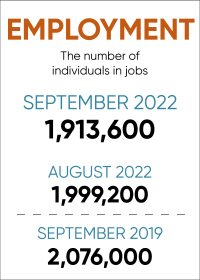
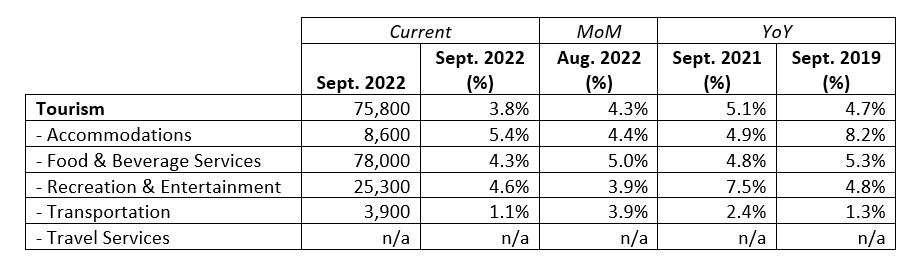
In September, tourism employment[4] accounted for 9.8% of all employment in Canada, and the sector employed 9.3% of the total available labour force. This remains below the pre-pandemic tourism employment rate (10.3% of the total available labour force in September 2019), but continues to improve year-on-year. Table 2 provides a summary of tourism employment as of September 2022.
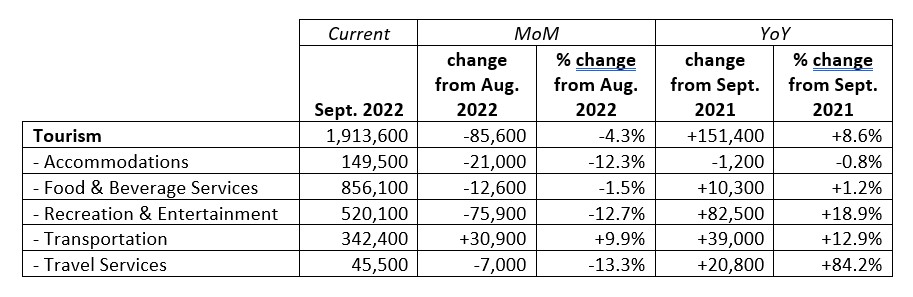
Table 2: Tourism Employment Estimates (seasonally unadjusted)
September: Month-over-Month
Employment in the sector shrank from August to September, dropping by 4.3%. This was substantially higher than the overall loss of only 0.7% in the wider Canadian economy. However, with tourism being more susceptible to seasonal fluctuations than many other sectors, this is not necessarily unexpected. Accommodations, recreation & entertainment, and travel services experienced the most substantial losses, while food & beverage services remained relatively stable, and transportation grew.
September: Year-on-Year
Compared to last year, September saw an overall growth in tourism employment. The accommodations and food & beverage services industries stayed more or less level, but recreation & entertainment, transportation, and travel services all saw growth. Travel services in particular showed very strong growth, with employment growth (84%) outpacing labour force growth (75%) in this industry.
Pre-pandemic Baseline
Employment in the tourism sector as a whole remained substantially below where it was in September 2019, with around 163,000 fewer people employed. It constituted 92% of pre-pandemic employment (2,076,900). Travel services and accommodations showed the lowest relative levels of employment, and although both industries have shown gradual improvement over the past couple years, they remained heavily impacted by the effects of the pandemic.
Part-time vs. Full-time Employment
The ratio of part-time to full-time employment is a useful snapshot of the workforce as a whole (see Figure 1). As might be expected with students returning to full-time study, there was an increase in part-time employment across the sector from August. The overall PT:FT ratio is comparable with September last year, as well as with the pre-pandemic estimates from September 2019. Accommodations alone saw a relative increase in full-time employment, in an industry that already relies heavily on full-time employees, and this trend has been increasing slowly since 2019.
Hours worked
The total number of hours worked in tourism remained below the 2019 baseline (see Figure 2), but was higher than in 2021. There was a slight drop from August to September 2022, although the gap between 2021 and 2022 has narrowed since spring.
Across the industry groups comprising the tourism sector (see Figure 3), the total hours worked were below 2019 levels for accommodations, food & beverage services, and travel services, and had returned to pre-pandemic levels in recreation & entertainment and transportation.
Unemployment
September unemployment[5] in the tourism sector (3.8%) was lower than that reported in the Canadian economy generally (4.7%). This pattern held across most of the provinces as well, with only Quebec and Manitoba showing higher unemployment in tourism than in the provincial economy overall.
Table 3: Tourism Unemployment Estimates (seasonally unadjusted)
September: Month-over-Month
There was a drop in unemployment from August to September in the tourism sector as a whole, although some industries—notably accommodations and recreation & entertainment—saw an increase in unemployment rates. Transportation saw the largest drop in relative in unemployment.
September: Year-on-Year
Tourism unemployment was also lower than it was in September 2021. Recreation & entertainment showed the largest relative improvement. Compared to the pre-pandemic baseline of September 2019, all of the industries comprising the tourism sector had lower unemployment rates. The national unemployment rate for all sectors in September 2019 was 5.1%, so the drop in tourism parallels that in the larger economic sphere as well.
Provincial Tourism Unemployment
Rates of unemployment across the provinces varied (see Figure 4). With the exceptions of Quebec and Manitoba, tourism unemployment was lower than the overall provincial economic rates. Tourism unemployment was lowest in British Columbia (2%) and Nova Scotia (2.6%), and highest in Prince Edward Island (5.7%) and Newfoundland and Labrador (8.2%).
View more employment charts and analysis on our Tourism Employment Tracker.
[1] As defined by the Canadian Tourism Satellite Account. The NAICS industries included in the tourism sector those that would cease to exist or would operate at a significantly reduced level of activity as a direct result of an absence of tourism.
[2] SOURCE: Statistics Canada Labour Force Survey, customized tabulations. Based on seasonally unadjusted data collected for the period of September 11 to 17, 2022.
[3] The labour force comprises the total number of individuals who reported being employed or unemployed (but actively looking for work). The total Canadian labour force includes all sectors in the Canadian economy, while the tourism labour force only considers those working in, or looking for work in, the tourism sector.
[4] Employment refers to the total number of people currently in jobs. Tourism employment is restricted to the tourism sector, while employment in Canada comprises all sectors and industries.
[5] Unemployment is calculated as the difference between the seasonally unadjusted labour force and seasonally unadjusted employment estimates. The percentage value is calculated against the labour force.