Canadian Tourism Labour Market Snapshot
August 2022 Labour Force Survey data reveals that tourism sector employment and labour force levels declined as Canada’s summer season—a peak period of tourism activity across all five industry groups—came to a close.
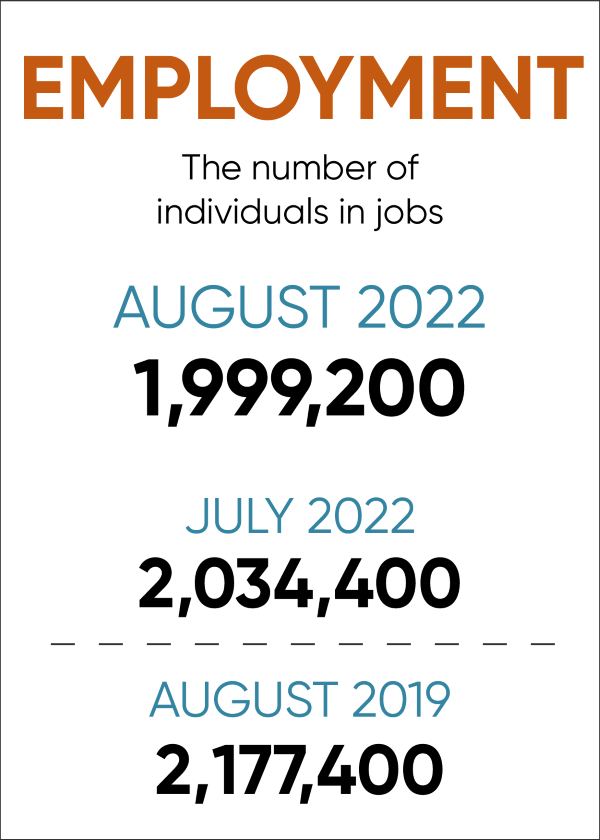
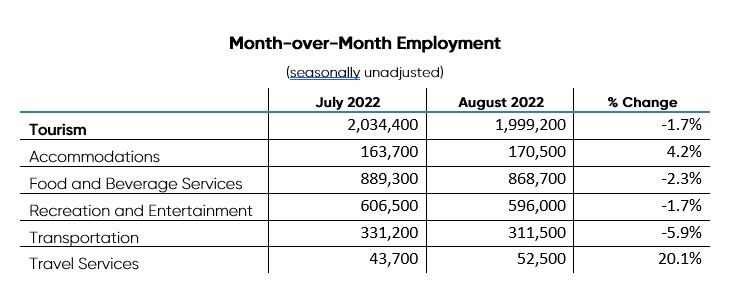
Overall, the tourism sector saw a month-over-month employment change of -35,200 workers or -1.7% as employment levels decreased from 2,034,400 in July to 1,999,200 for August.
Employment significantly increased this month in the travel services industry (up 20.1% or 8,800 workers over last month), while accommodations recovered this month (up 4.2% or 6,800) from unanticipated employment losses the industry had experienced between June and July 2022. Employment declines were seen in three industry groups: transportation (-5.9% or -19,700 workers), food and beverage services (-2.3% or -20,600), and recreation and entertainment (-1.7% or -10,500).
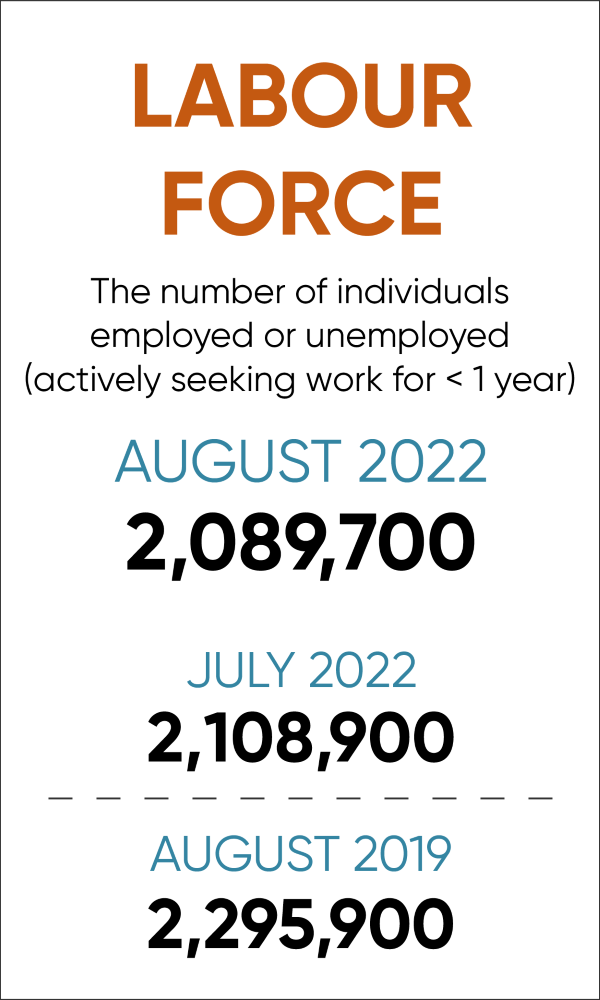
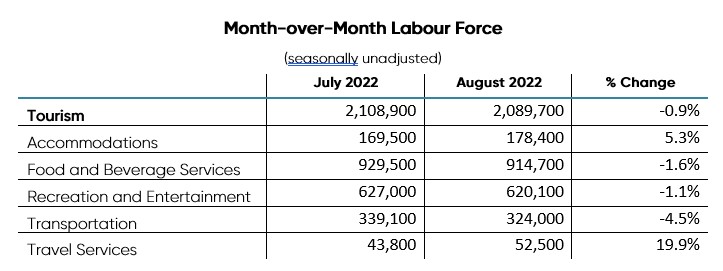
In line with pre-pandemic seasonal trends, the sector’s total labour force also slightly declined this month, to 2,089,700 (by -0.9% or -19,200), compared to July 2022 (2,108,900).
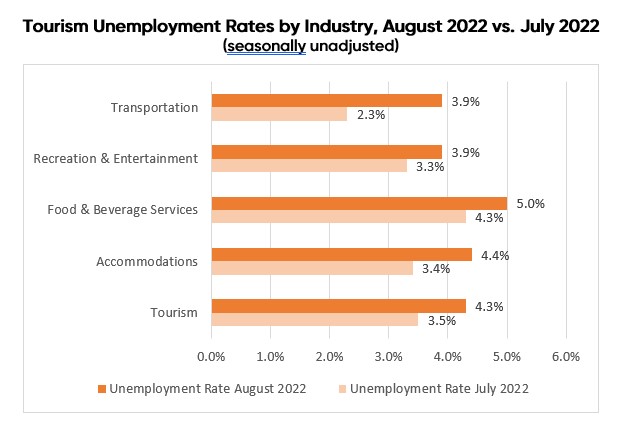
The tourism unemployment rate for August (4.3%) was slightly higher than the previous month (3.5%).
Meanwhile, data on total hours worked by tourism employees this month illustrates the persistent labour market volatility in the sector, as the total actual hours worked in tourism declined from July to August 2022, by 3.2%, while the number of hours worked was 9.9% lower this month than in pre-pandemic August 2019.
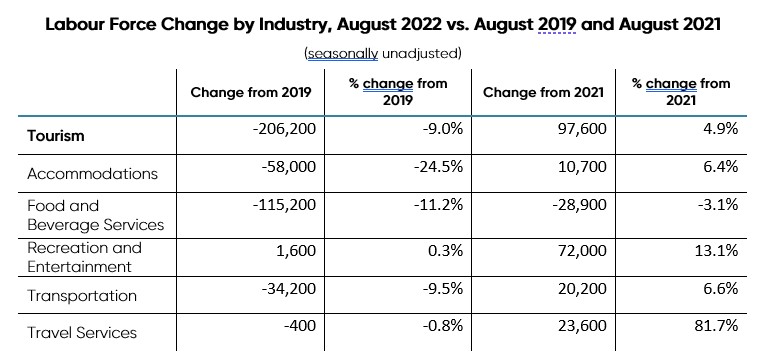
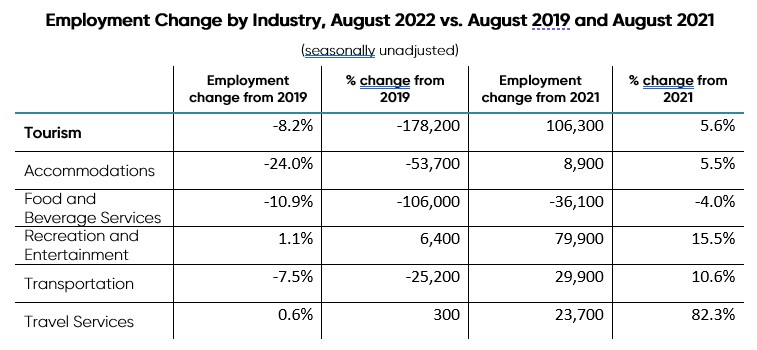
Overall, positive signs for tourism labour market recovery from the impacts of the COVID-19 pandemic can be seen when comparing August 2022 employment indicators to the same month in the previous year. When compared to August 2021, significant improvements in employment levels can be seen across the majority of tourism industry groups, with food and beverage services being a key exception. Employment grew significantly in travel services (82.3% or 23,700 workers), recreation and entertainment (15.5% or 79,900), and transportation (10.6% or 29,900), while accommodations (5.5% or 8,900) saw moderate gains when compared to August 2021 levels. Employment in the food and beverage services industry, however, remained suppressed (-4.0% or -36,1000) compared to last August.
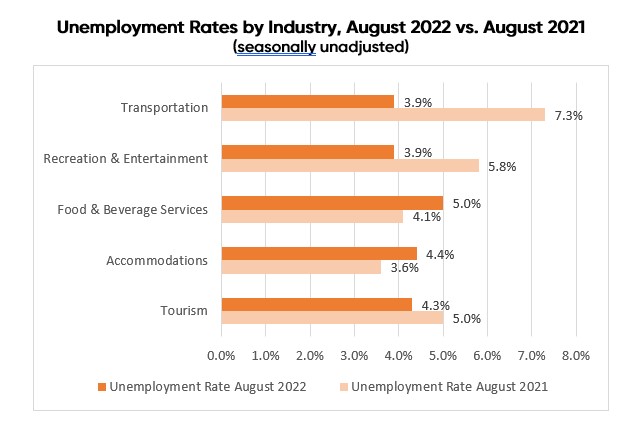
With the exception of the accommodations and food and beverage services industries, all tourism industry groups have reported lower unemployment rates than the same month last year.
When compared to the same month pre-pandemic (August 2019), tourism employment remains down 8.2% or 178,200 workers against the pre-pandemic baseline, while this month’s overall tourism labour force (2,089,700) accounted for 206,200 fewer workers (or -9.0%) than in August 2019 (2,295,900).
Tourism Labour Force Saw a Slight Decline (-0.9%) in August 2022
Canada’s tourism sector[1] labour force[2] declined between July and August, according to Statistics Canada’s Labour Force Survey data[3] released for August 2022. At 2,089,700 participants, the tourism labour force had 19,200 fewer participants (-0.9%) than July 2022 (2,108,900).
The labour force grew by 4.9% when compared to August 2021—gaining 97,600 members. Though this is a positive sign for tourism’s labour force recovery efforts, the current labour force has 206,200 fewer participants than the pre-pandemic total tourism labour force of August 2019.
While significant monthly labour force gains were seen in the travel services and accommodations industries, they could not balance out declines in the transportation, recreation and entertainment, and food and beverages services industries this month.
August 2022 Tourism Employment = 9.9% of Canadian Workforce
At 1,999,200 total workers, tourism comprised 9.9% of total Canadian employment in August 2022 (down slightly from 10.1% the previous month). Total tourism employment for August declined (-1.7%) when compared to last month—though significant employment gains were seen in the travel services industry (up 20.1% or 8,800 workers over last month) and accommodations (up 4.2% or 6,800). Employment declines were seen in three industry groups: transportation (-5.9%), food and beverage services (-2.3%), and recreation and entertainment (-1.7%).
Looking at the same month in previous years reveals that employment in the tourism sector has grown since August 2021 (up 5.6% overall), but continues to lag behind levels seen pre-pandemic (August 2019), with close to 178,200 fewer workers (a change of -8.2%).
August 2022 Tourism Unemployment Rate = 4.3%
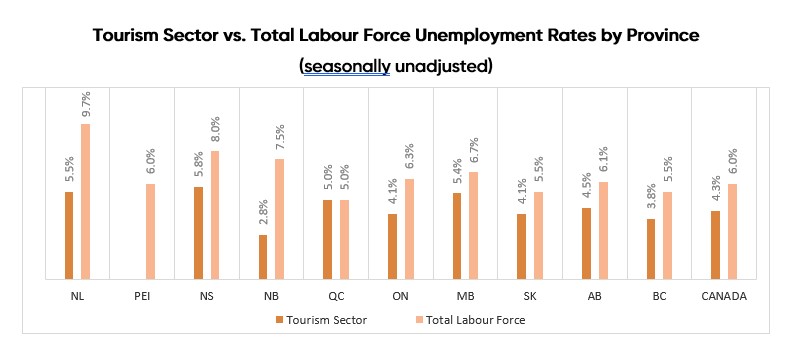
In August 2022, the unemployment rate in the tourism sector was at 4.3%, which is 0.8 percentage points higher than the rate reported in July, when the unemployment rate stood at 3.5%. At 4.3%, tourism’s unemployment rate was below Canada’s seasonally unadjusted unemployment rate for August (6.0%).
With the exception of accommodations and food and beverage services, all tourism industry groups have reported lower unemployment rates than the same month last year.
On a provincial basis, tourism unemployment rates ranged from 2.8% in New Brunswick to 5.8% in Nova Scotia.[4]
The seasonally unadjusted unemployment rates for tourism in each province were below the rates reported for the provincial economy.
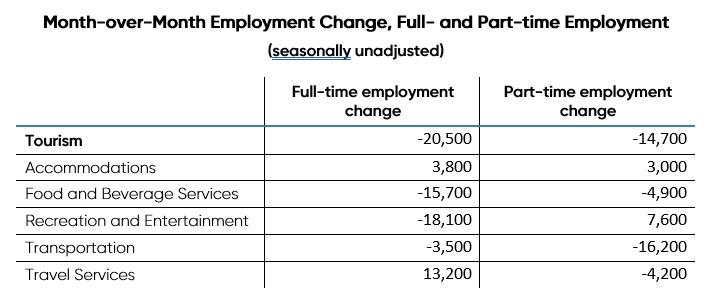
Looking at full- and part-time employment this month, tourism saw declines shared almost evenly between these employment types. Part-time employment in the tourism sector declined sharply (-14,700), while full-time employment also fell (-20,500).
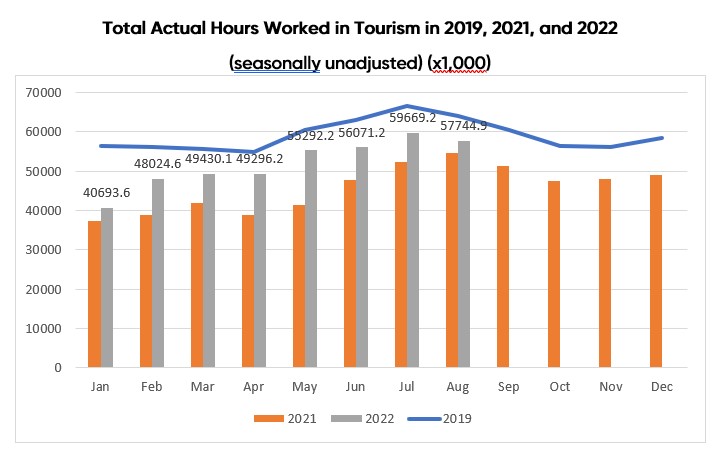
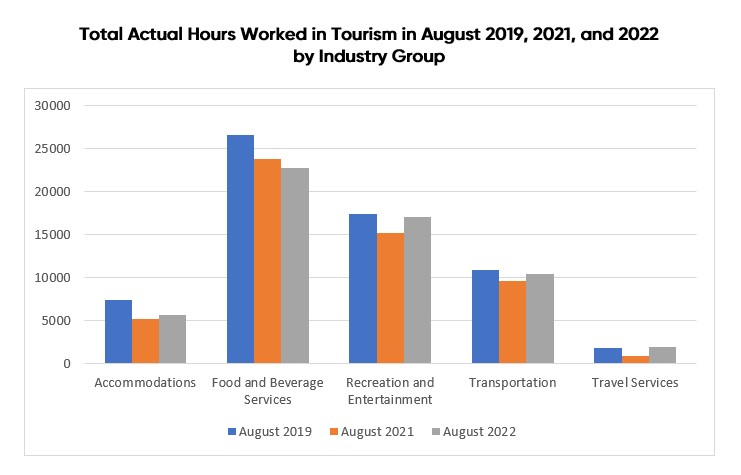
Total Actual Hours Worked in Tourism Decreased from July to August
The end of summer 2022 saw a month-over-month decline in the total actual hours worked in the tourism sector. From July to August 2022, the total actual hours worked decreased by 3.2%. While it was 5.7% higher than in August 2021, it was 9.9% lower than in August 2019. Over the summer of 2022, the total actual hours worked went up in general—it was elevated by 4.4% from May to August.
Looking at the five tourism industries, two saw an increase in the total hours worked from July 2022, while three saw a decrease, as the overall tourism sector did. Notably, the total hours worked in the travel services industry was up dramatically, with an increase of 37.0% from July. The accommodations industry also saw gains (3.6%) in the total actual hours worked. On the contrary, the total hours worked declined by 1.0%, 6.1%, and 7.3%, in the recreation and entertainment, transportation, and food and beverage services industry, respectively.
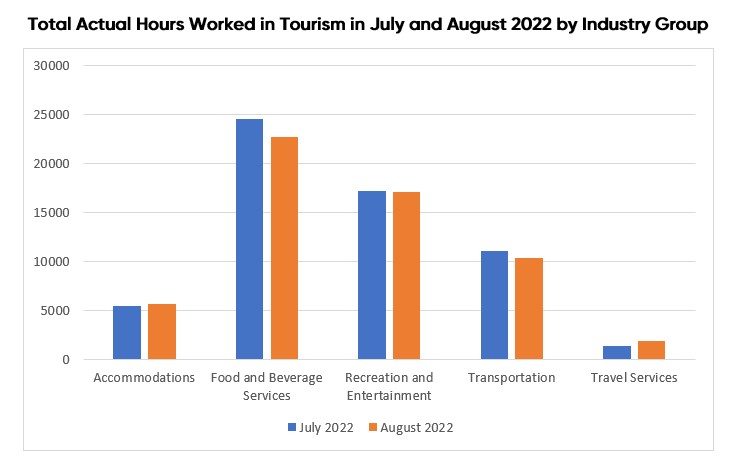
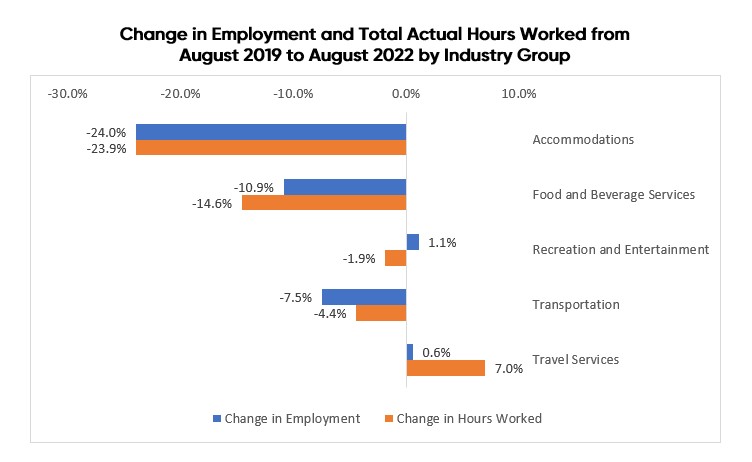
On a year-over-year basis, the total actual hours worked in four tourism industries was elevated from August 2021 to 2022, except for the food and beverage services industry, which saw a decrease of 4.5% over the one-year period. Compared to August 2021, the travel services industry saw the biggest gain in the total actual hours worked (115.6%). In addition, travel services is the only tourism industry that has recovered to the August 2019 levels for total actual hours worked. The accommodations industry and the food and beverage services industry, however, have the longest way to go towards recovery, with a decline of 23.9% and 14.6% in the total actual hours worked from August 2019, respectively.
As of August 2022, the hours worked in the travel services industry had recovered to pre-pandemic levels but in hours worked the recreation and entertainment industry was still suppressed. When compared to the past three years, employees in the transportation industry and the travel services industry worked more hours on average than they did in August 2019. On the contrary, employees in the food and beverage services industry and the recreation and entertainment industry worked fewer hours on average than they did in August 2019. Employees in the accommodations industry worked similar hours compared to August 2019.
For a full look at the latest tourism workforce trends, please visit the Tourism Employment Tracker.
[1] As defined by the Canadian Tourism Satellite Account. The NAICS industries included in the tourism sector are those that would cease to exist or would operate at a significantly reduced level of activity as a direct result of an absence of tourism.
[2] The labour force comprises the total of number of individuals who reported being employed and unemployed (but actively looking for work) in the tourism industries.
[3] SOURCE: Statistics Canada Labour Force Survey, customized tabulations. Based on seasonally unadjusted data collected for the period of August 14 to 20, 2022.
[4] Unemployment data for PEI are suppressed by Statistics Canada this month.