Canadian Tourism Labour Market Snapshot
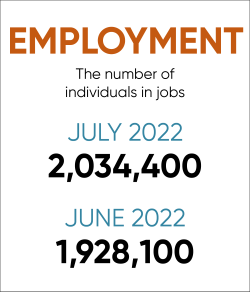
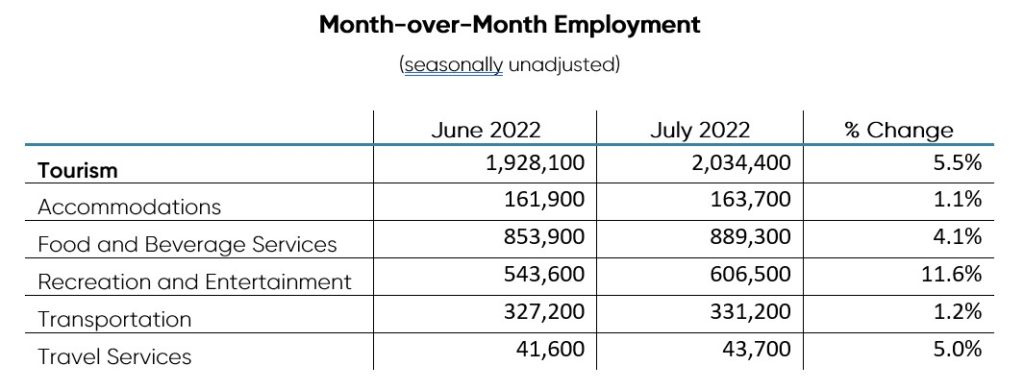
Tourism employment saw positive gains this July, growing to 2,034,400 workers (representing a month-over-month increase of 106,300 or 5.5%). The sector’s total labour force grew to 2,108,900 (a nearly identical increase of 106,300 or 5.3%). This marks the first time since February 2020 that monthly tourism sector employment has topped the 2 million mark—which it had consistently done pre-pandemic, throughout 2018 and 2019.
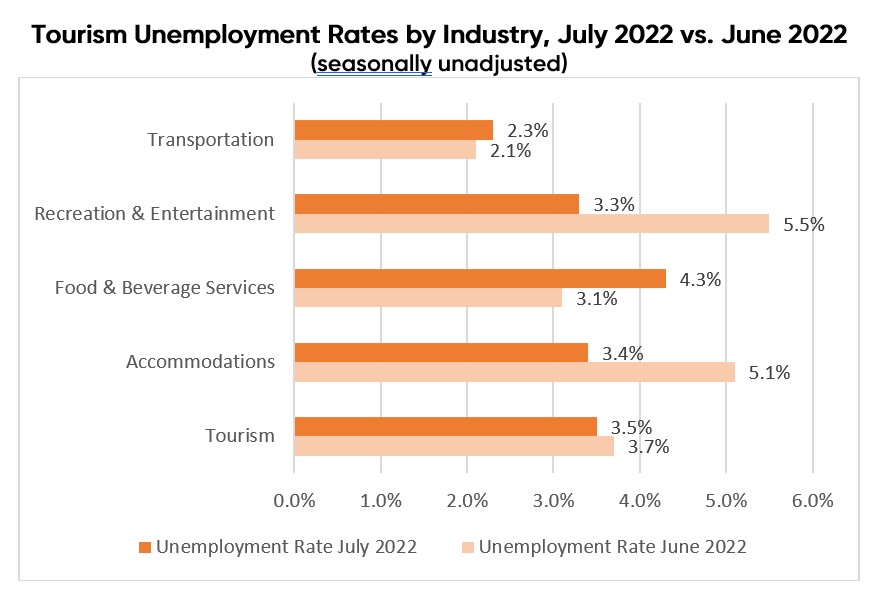
The tourism unemployment rate for July (3.5%) improved slightly over the previous month (3.7%). Employment increased for all tourism industries but was significantly higher in three of the five industry groups when compared to the previous month. Employment increased by 11.6% for recreation and entertainment, to 606,500 workers, while the employment level in travel services and food and beverage services increased by 5.0% and 4.1%, respectively. Employment in accommodations (1.1%) and transportation (1.2%) grew slightly but remained relatively flat.
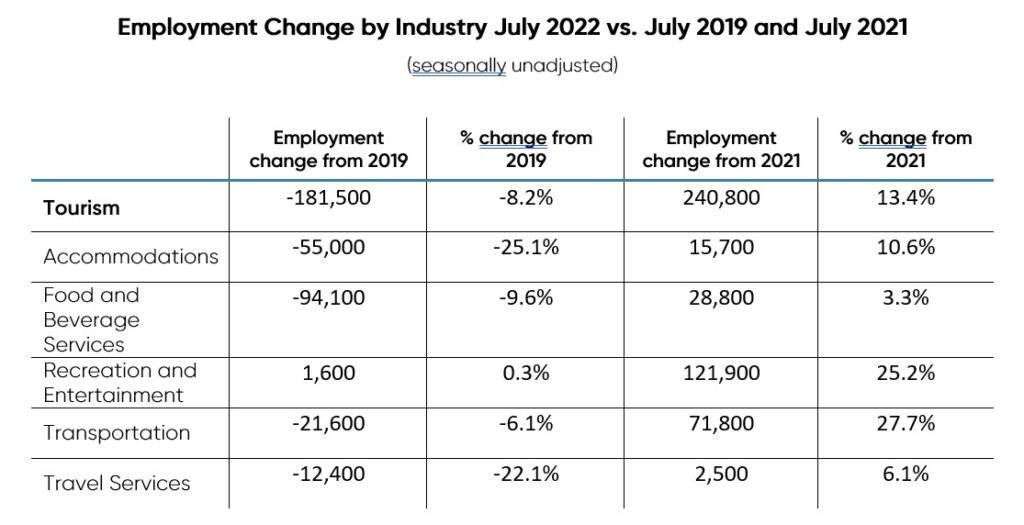
Additional positive signs for the tourism labour market can be seen when comparing July 2022 employment indicators to the same month in the previous year. When compared to July 2021, there were significant improvements in employment levels and the unemployment rate across all tourism industry groups. Employment in the transportation and recreation and entertainment industry groups grew by 27.7% and 25.2%, respectively.
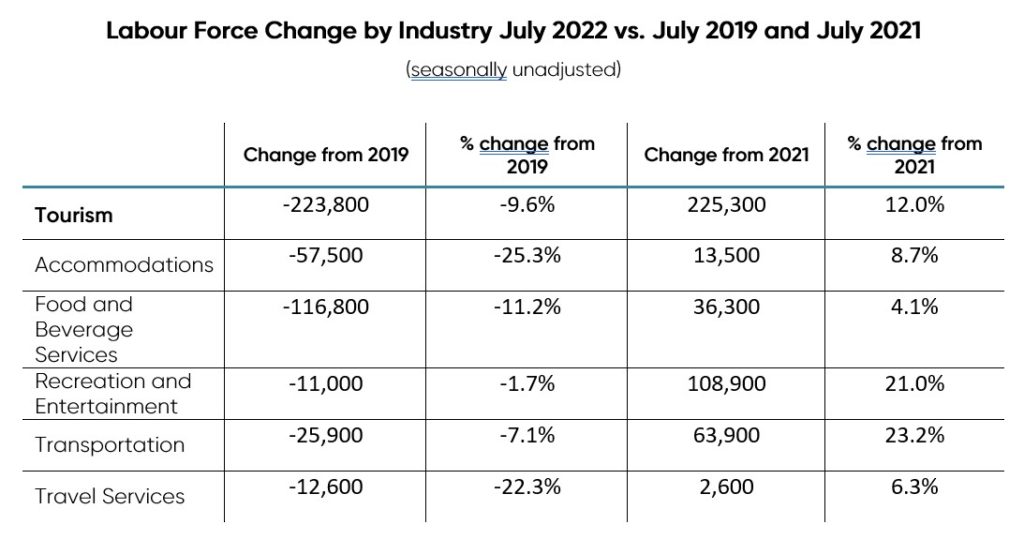
However, looking at the same month pre-pandemic, this month’s overall tourism labour force (2,108,900) accounted for 223,800 fewer workers (or -9.6% growth) than it did in July 2019 (2,332,700). And, when compared to July 2019, tourism employment continues to lag, with overall employment data this month revealing a decline of -181,500 workers (or -8.2%) from the pre-pandemic baseline. Meanwhile, job vacancies in the spring of 2022 remained elevated for the accommodation and food services industry and the arts, entertainment, and recreation industry, with May 2022 job vacancies reaching 161,115 and 18,845, respectively.
In sum, July Labour Force Survey (LFS) data reveals an eagerly anticipated positive uptick in tourism sector labour force and employment levels; however, with many signs of increased consumer demand for tourism products and services, job vacancies remain a significant challenge for the sector. As consumer demand and the number of travellers rise during the peak tourism summer period of late July and August, a heightened need for workers should be anticipated across all five tourism industry groups.
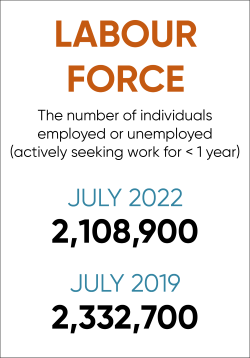
Tourism Labour Force Saw Positive Growth (5.3%) in July 2022
Labour Force Survey data[1] released for July 2022 reveals that, at 2,108,900 participants, Canada’s tourism labour force[2] saw positive growth after declining between May and June.
The labour force grew by 5.3% (or 106,300 participants) from last month; it grew by 12.0% when compared to July 2021—gaining 225,300 members.[3] Though this is a positive sign for tourism’s labour force in the coming months, the current level has 223,800 fewer participants than the pre-pandemic total tourism labour force of July 2019.
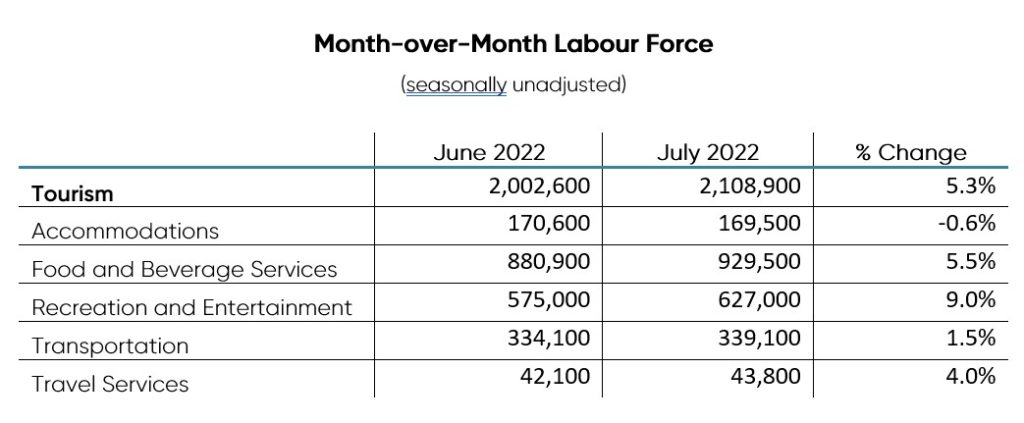
While significant monthly labour force gains were seen in the food and beverage services, travel services, and recreation and entertainment industries this month, accommodations proved to be an outlier, with -0.6% change between June and July 2022.
July 2022 Tourism Employment = 10.1% of Canadian Workforce
With a total of 2,034,400 workers, tourism comprised 10.1% of total Canadian employment for July 2022 (up from 9.6% the previous month). Total tourism employment increased by 5.5%, with growth across all five industry groups this month.
The most significant employment gains were in the recreation and entertainment and travel services industries. Looking at the same month in previous years reveals that employment in the tourism sector has grown significantly since July 2021 (up 13.4% overall) but continues to lag behind the levels seen pre-pandemic (July 2019) with close to 181,500 fewer workers (a change of -8.2%).
July 2022 Tourism Unemployment Rate = 3.5%
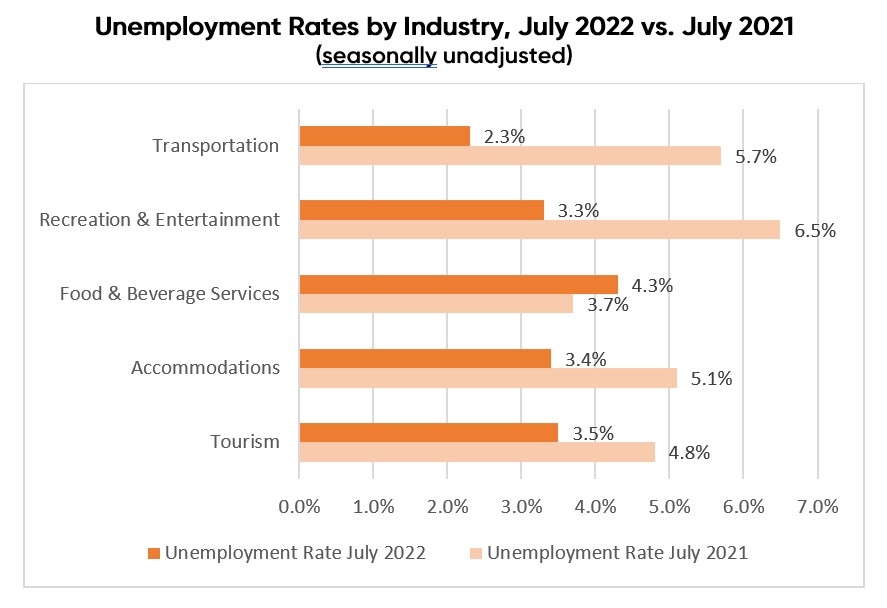
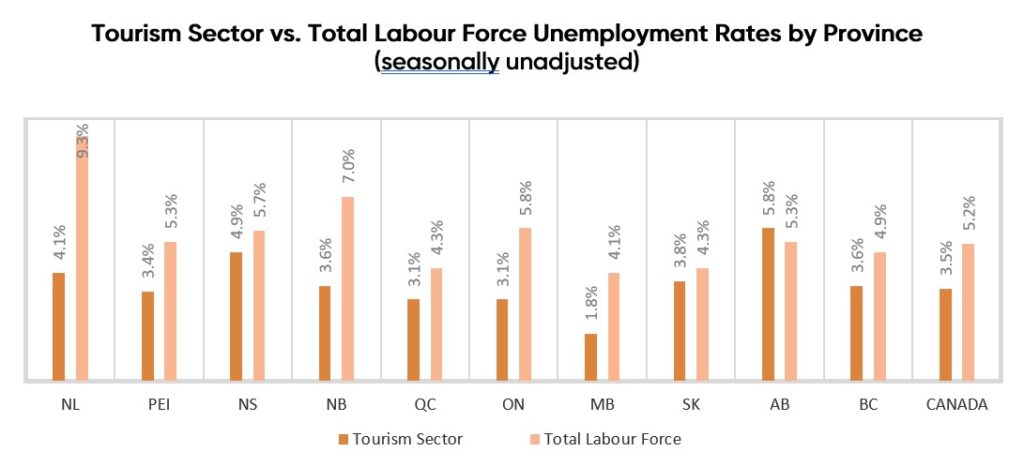
In July 2022, the unemployment rate in the tourism sector was at 3.5%, which is 1.3% percentage points lower than the rate reported in July 2021, and lower than the previous month (June), when the unemployment rate stood at 3.7%. At 3.5%, tourism’s unemployment rate was well below Canada’s seasonally unadjusted unemployment rate of 5.2%.
With the exception of food & beverage services, all tourism industry groups have reported lower unemployment rates than in the same month last year.
On a provincial basis, tourism unemployment rates ranged from 1.8% in Manitoba to 5.8% in Alberta. The seasonally unadjusted unemployment rates for tourism in each province, with the exception of Alberta, were below the rates reported for the provincial economy.
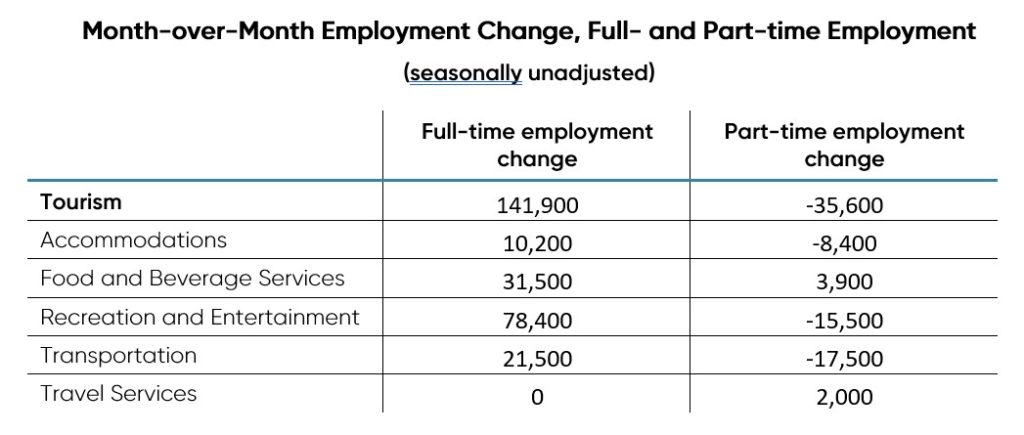
Looking at full- and part-time employment this month, tourism saw a significant shift between these employment types. Part-time employment in the tourism sector declined sharply (-35,600), while full-time employment increased by 141,900.
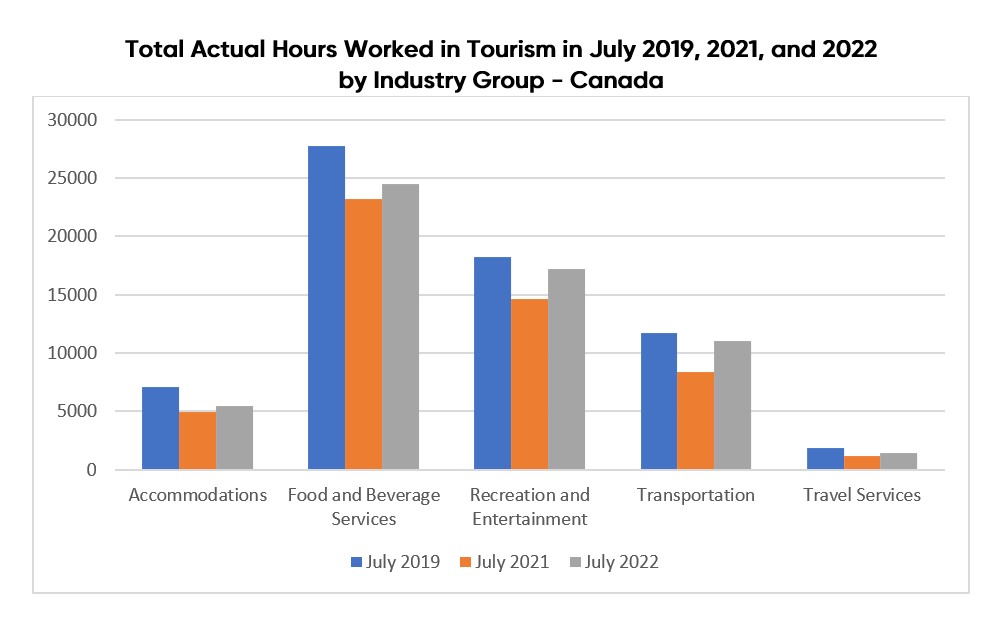
Total Actual Hours Worked in Tourism Increased in July
The total actual hours worked in the tourism sector continued to increase over the summer months. In July 2022, the total actual hours worked increased by 6.4% from June 2022. However, this number remains below pre-pandemic levels: while it was 13.7% higher than in July 2021, it was 10.4% lower than July 2019’s totals.
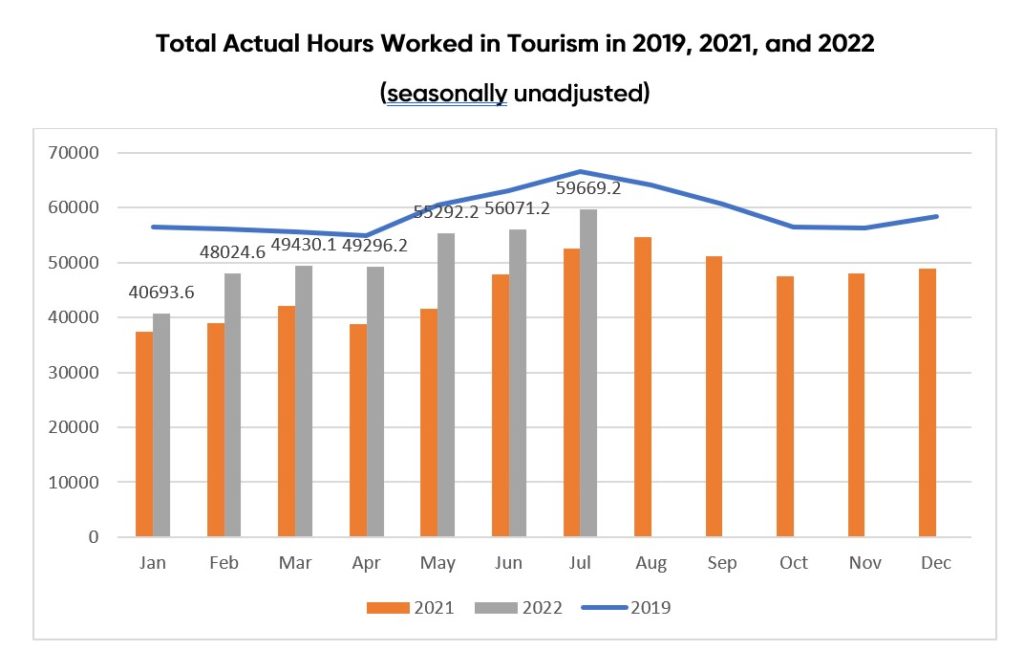
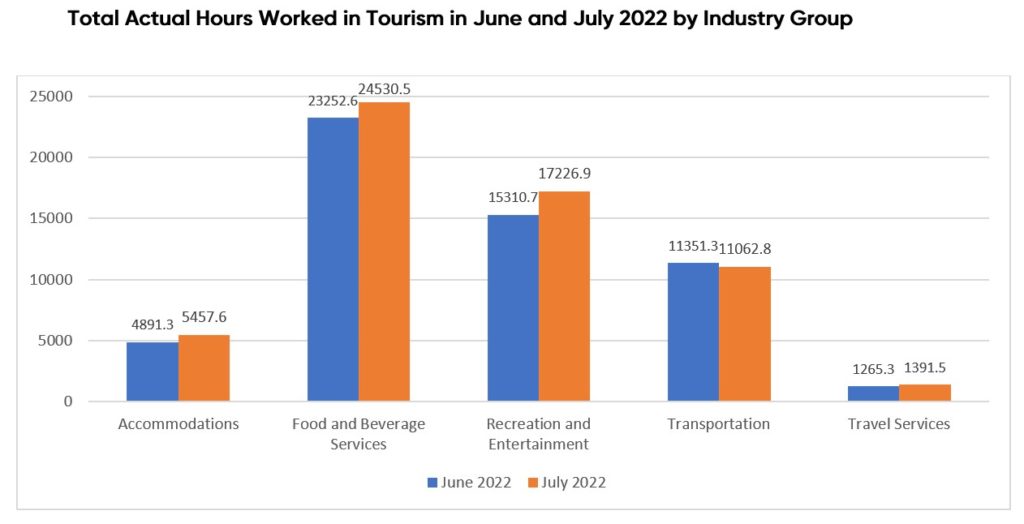
Most tourism industry groups saw a month-over-month increase in the total hours worked. The recreation and entertainment industry saw the biggest gains in the total hours worked, with an increase of 12.5% from June, followed by the accommodations industry (11.6%), the travel services industry (10.0%), and the food and beverage services industry (5.5%). The transportation industry was the exception, with a decrease of 2.5% in the total hours worked.
On a year-over-year basis, the total actual hours worked in the five tourism industries grew from July 2021 to July 2022, among which the transportation industry saw the biggest gains (31.6%). However, no tourism industries have recovered to July 2019 levels regarding the total actual hours worked. The travel services industry and accommodations industry, in particular, are 25.4% and 22.6% lower, respectively, than the total actual hours worked in July 2019.
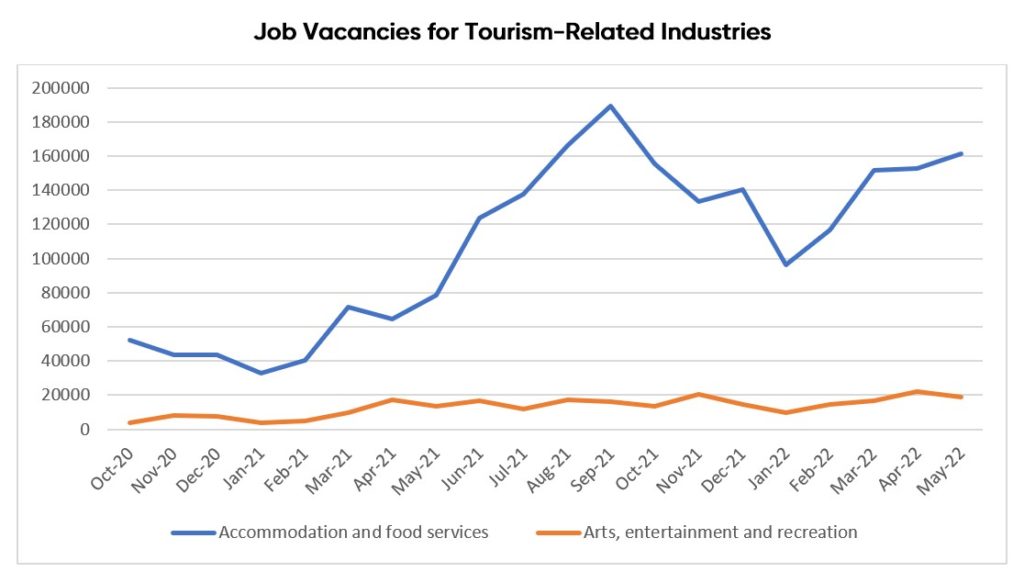
Job Vacancies for Tourism Show Hiring Challenges
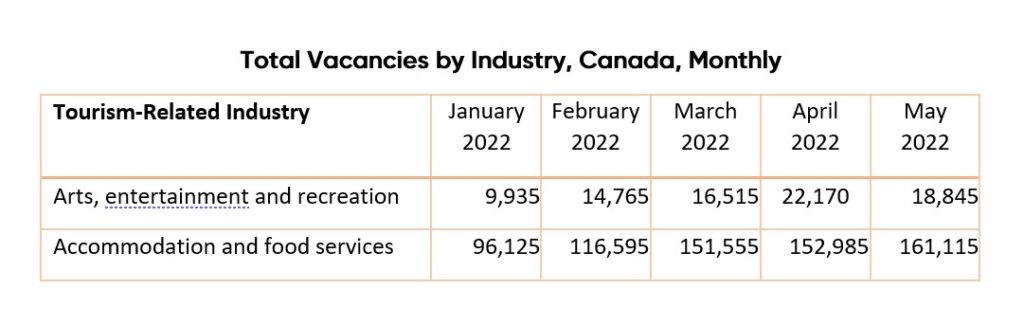
Job vacancy data for April and May 2022 was recently released by Statistics Canada. Job vacancies remained high for the accommodation and food services industry and the arts, entertainment, and recreation industry. In May 2022, the total number of job vacancies for the accommodation and food services industry and the arts, entertainment, and recreation industry reached 161,115 and 18,845, respectively. Typically, job vacancies for tourism-related industries are the highest in off-peak months. The most recent data signals that tourism businesses faced difficulty in hiring employees throughout the spring of 2022—a crucial ramp-up period for the sector.
For a full look at the latest tourism workforce trends, please visit the Tourism Employment Tracker.
[1] Source: Statistics Canada Labour Force Survey, customized tabulations. Based on seasonally unadjusted data collected for the period of July 10 to 16, 2022.
[2] The labour force comprises the total of number of individuals who reported being employed and unemployed (but actively looking for work) in the tourism industries.
[3] As defined by the Canadian Tourism Satellite Account. The NAICS industries included in the tourism sector are those that would cease to exist or would operate at a significantly reduced level of activity as a direct result of an absence of tourism.
[4] Source: Statistics Canada. Table: 14-10-0372-01. Job vacancies, payroll employees, and job vacancy rate by industry sector, monthly, unadjusted for seasonality