Canadian Tourism Labour Market Snapshot
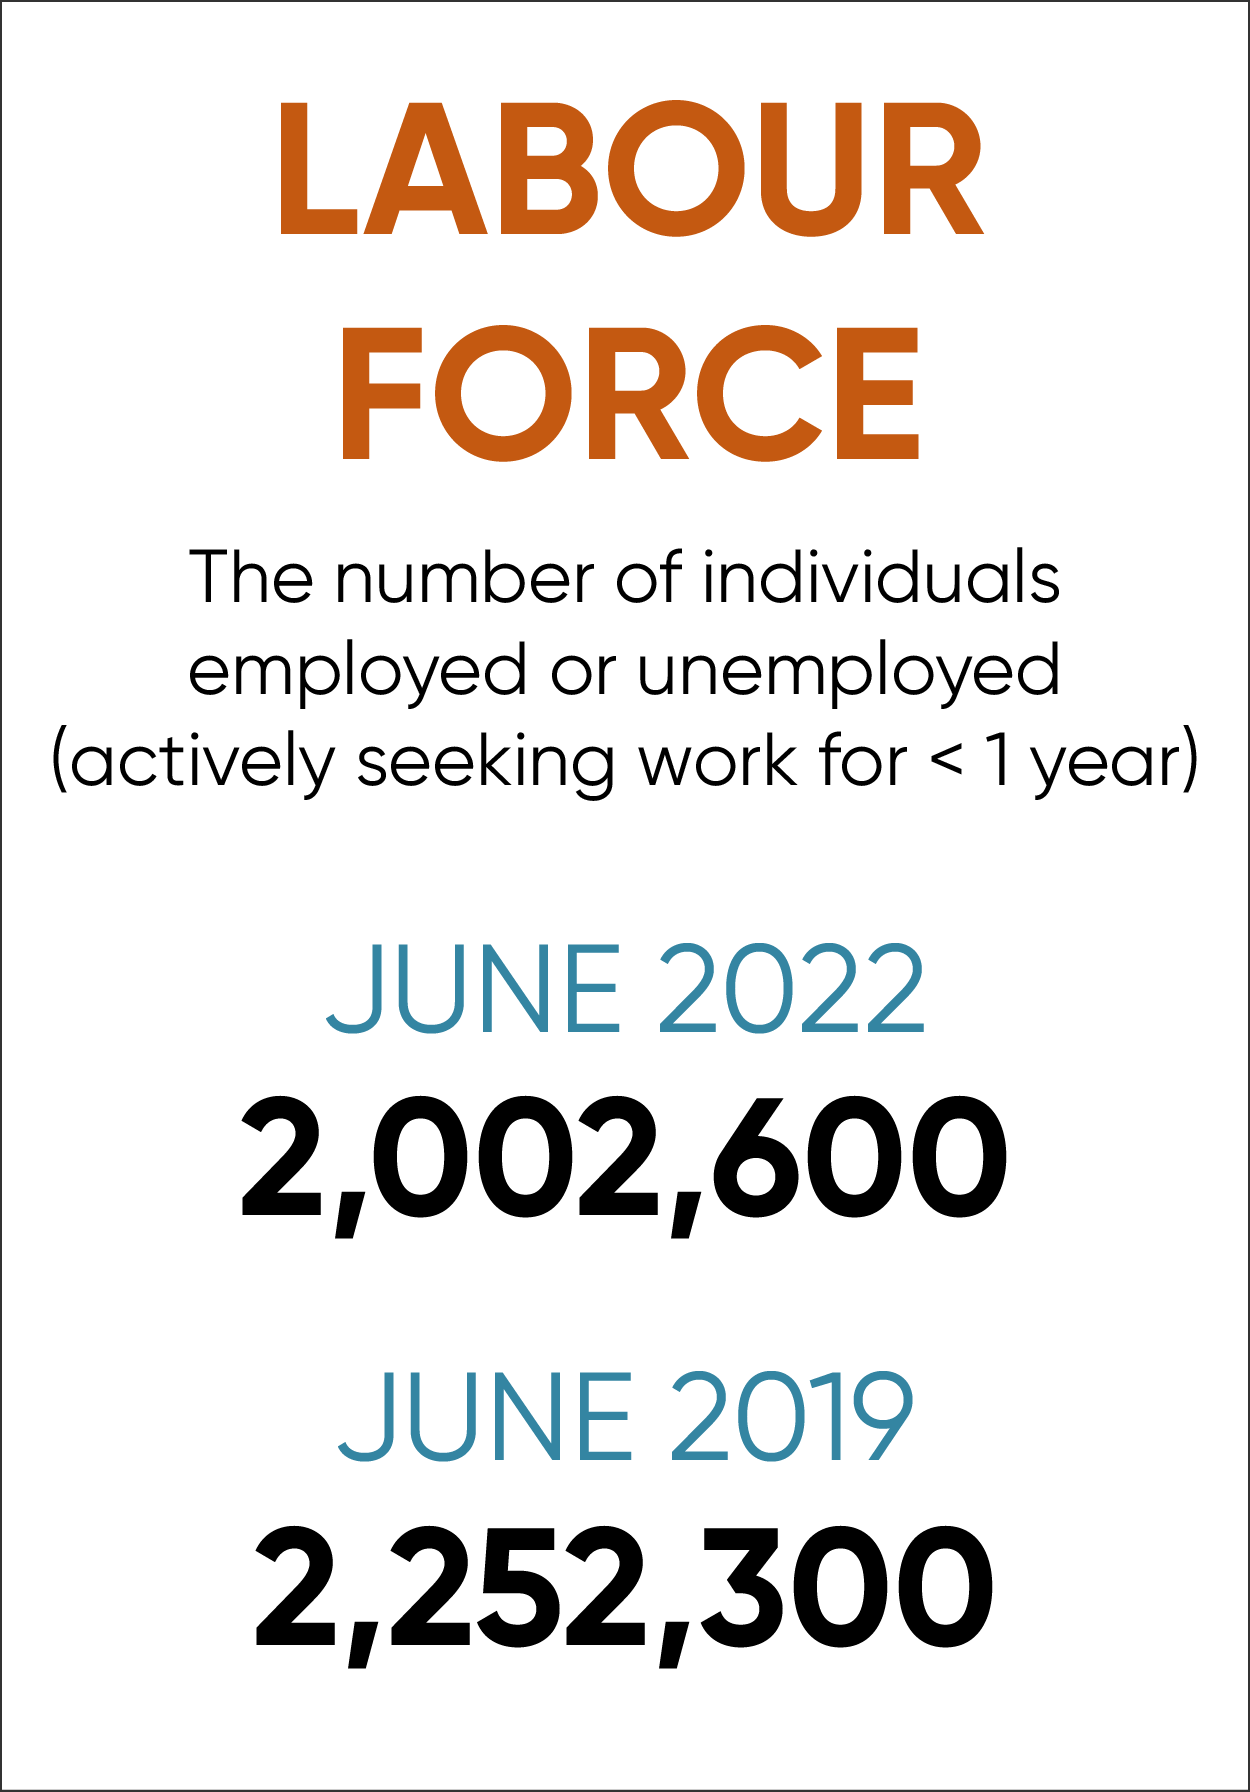
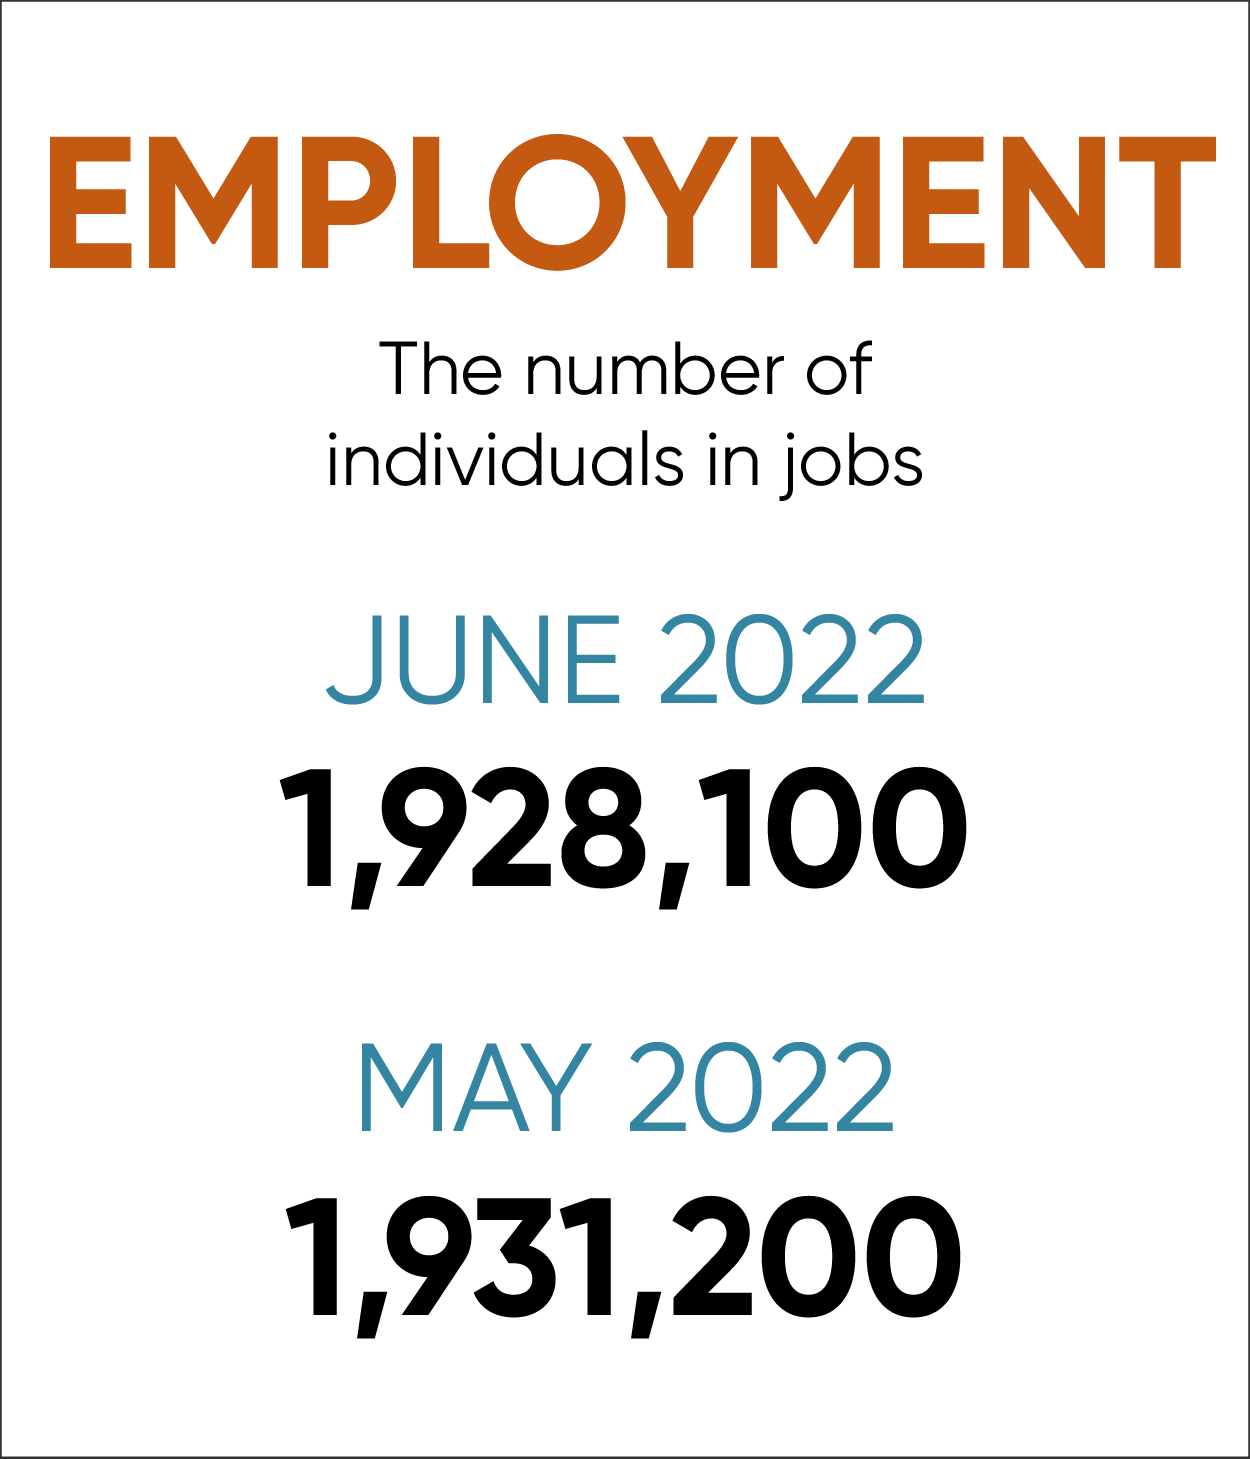
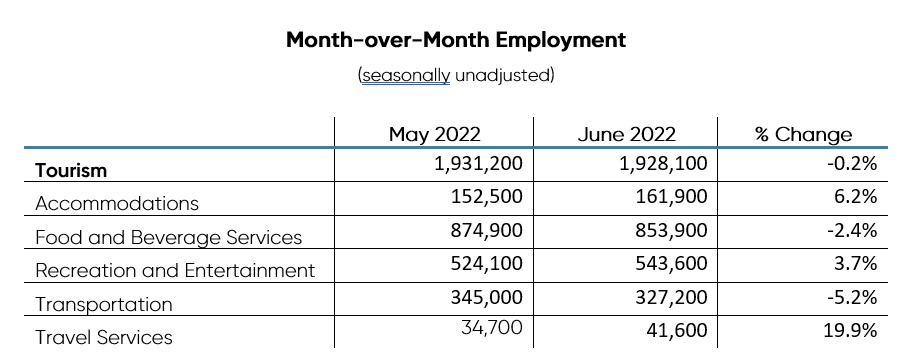
Tourism employment declined slightly to 1,928,100—representing a loss of 3,100 workers or -0.2% growth when compared to last month. The sector’s total labour force was reduced to 2,002,600 in June—a decline of 7,400 workers or -0.4%.
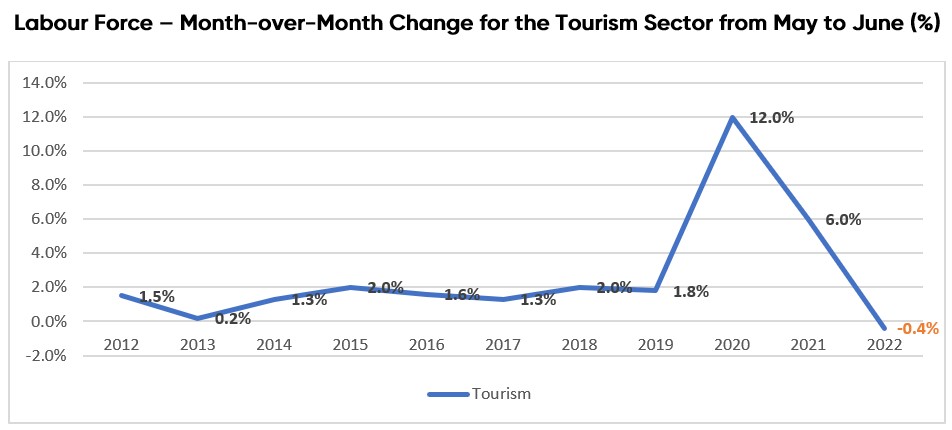
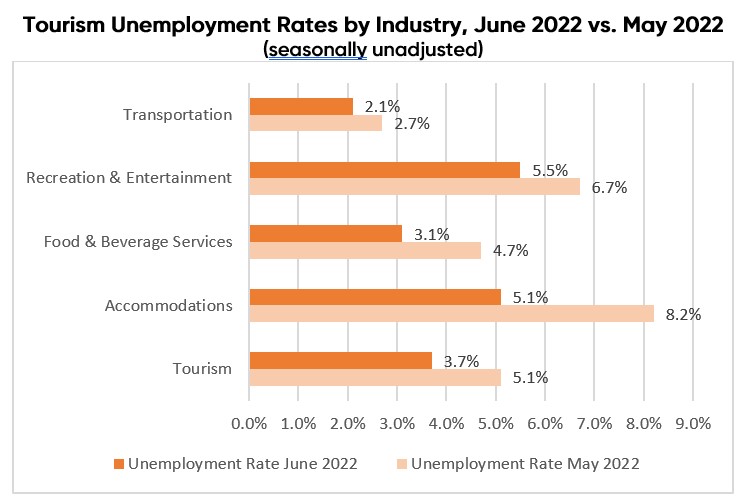
The tourism unemployment rate for June (3.7%) improved over the previous month (5.1%); however, this was largely influenced by the stagnant employment level and the decline in the size of the overall labour force. Though the month of June typically signifies the start of the peak summer travel season and therefore an important period of economic activity for the tourism sector, 2022 marks the only year between 2012 and 2022 in which there has been negative month-over-month growth between May and June in either the labour force or employment level.
This unusual labour market activity underscores that the sector remains in a period of volatility. It also highlights the diverse nature of the five tourism industry groups, which face differing structural factors and labour challenges. This makes near-term predictive analysis of trends difficult, though industry efforts to curb labour shortages have resulted in gains beyond the historic low points of the previous two years.
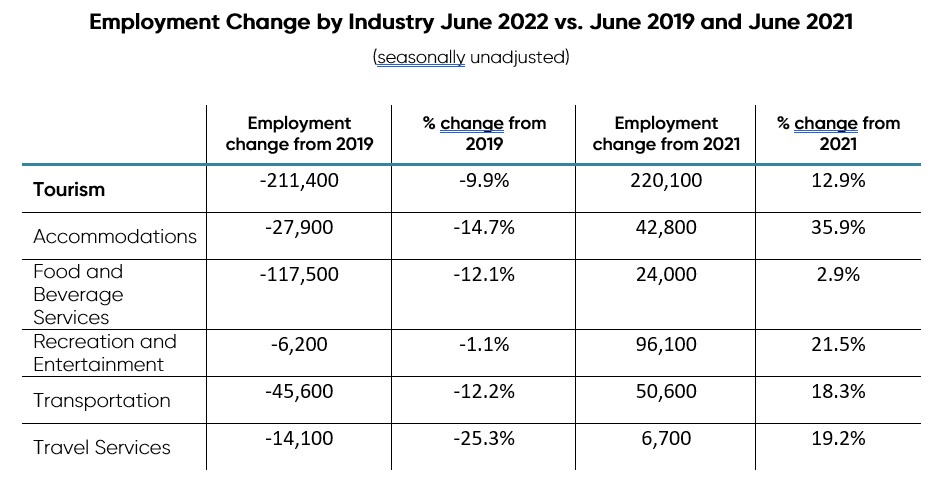
Despite surprising month-over-month figures, positive signs of labour market recovery can be seen when comparing current employment indicators to this same month in the previous two years. When compared to June 2020 and 2021, there were significant improvements in employment levels and the unemployment rate across all tourism industry groups. Employment was significantly higher in the accommodations industry and recreation and entertainment industry compared to this time last year—growing by 35.9% and 21.5%, respectively.
However, compared to pre-pandemic data from June 2019, the tourism labour force has shed nearly 250,000 participants and 211,000 fewer workers are employed in the sector. Not only are there fewer tourism employees than in June 2019, but overall these employees are working fewer hours.
In sum, the tourism sector is faced with persistent labour market volatility at a time when stakeholders are entering the summer tourism season with hopes of rebounding from unprecedented labour shortages exacerbated by the COVID-19 global pandemic.
Tourism Labour Force Saw Negative Growth (-0.4%) in June 2022
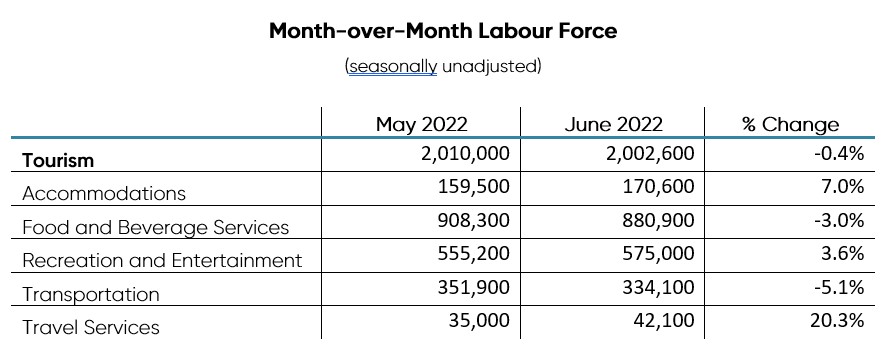
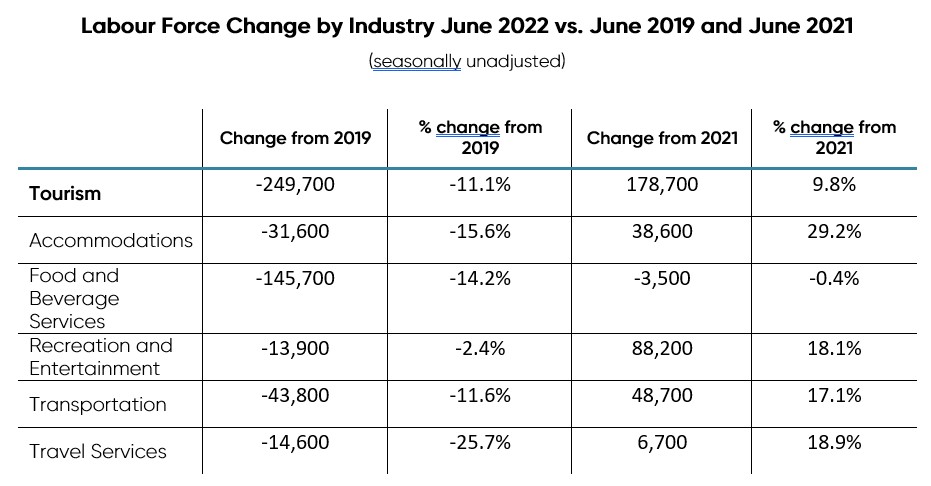
Labour Force Survey data[1] released for June 2022 reveals that, at 2,002,600 participants, Canada’s tourism labour force[2] saw negative growth after posting gains throughout the spring months.
Though the labour force declined by 0.4% (or 7,400 participants) from last month, it grew by 9.8% when compared to June 2021—gaining 178,700 members.[3] While this is a very positive sign for the recovery of tourism’s labour force, the impacts of the COVID-19 pandemic persist as the tourism labour force remains nearly 250,000 workers fewer than the sizeable pre-pandemic total of 2,252,300 from June 2019.
While monthly labour force gains in the travel services, accommodations, and recreation and entertainment industries are evident this month, the overall tourism sector decline between May and June 2022 is surprising as it is unprecedented to see negative month-over-month labour force growth between these months in the previous decade.
June 2022 Tourism Employment = 9.6% of Canadian Workforce
With a total of 1,928,100 workers, tourism comprised 9.6% of total Canadian employment for June 2022. Employment numbers declined slightly (-0.2%) overall and results were mixed across the five industry groups this month.
The most significant employment gains were in the travel services, accommodations, and recreation and entertainment industries. Looking at the same month in previous years reveals that employment in the tourism sector has grown significantly since June 2021 (up 12.9% overall) but continues to lag behind the levels seen pre-pandemic (June 2019) with close to 211,000 fewer workers (a change of -9.9%).
June 2022 Tourism Unemployment Rate = 3.7%
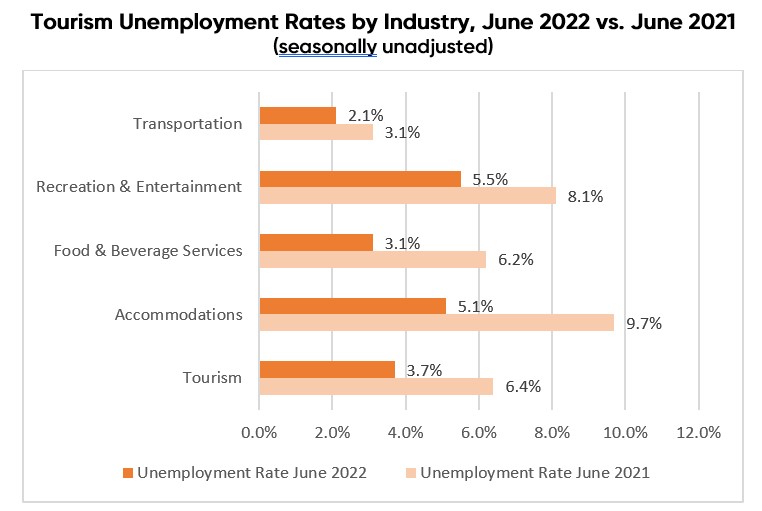
In June 2022, the unemployment rate in the tourism sector was at 3.7%, which is 2.7 percentage points lower than the rate reported in June 2021, and lower than the previous month when the unemployment rate stood at 3.9%. At 3.7%, tourism’s unemployment rate was well below Canada’s seasonally unadjusted unemployment rate of 4.7%. All tourism industry groups have reported lower unemployment rates than the same month last year.

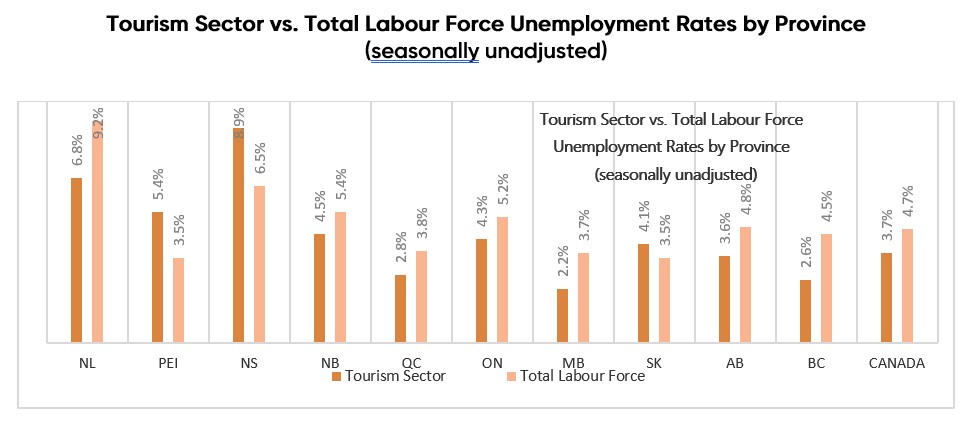
On a provincial basis, tourism unemployment rates ranged from 2.2% in Manitoba to 8.9% in Nova Scotia. The seasonally unadjusted unemployment rates for tourism in each province—with the exceptions of Prince Edward Island, Nova Scotia, and Saskatchewan—were below the rates reported for the provincial economy.
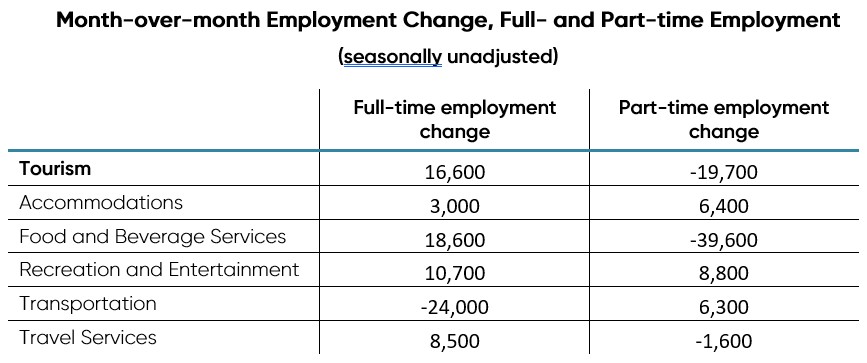
The overall employment change in June is principally due to declines in part-time employment. Part-time employment in the tourism sector declined sharply (-19,700) while full-time employment increased by 16,600 workers.
Total Actual Hours Worked in Tourism Increased
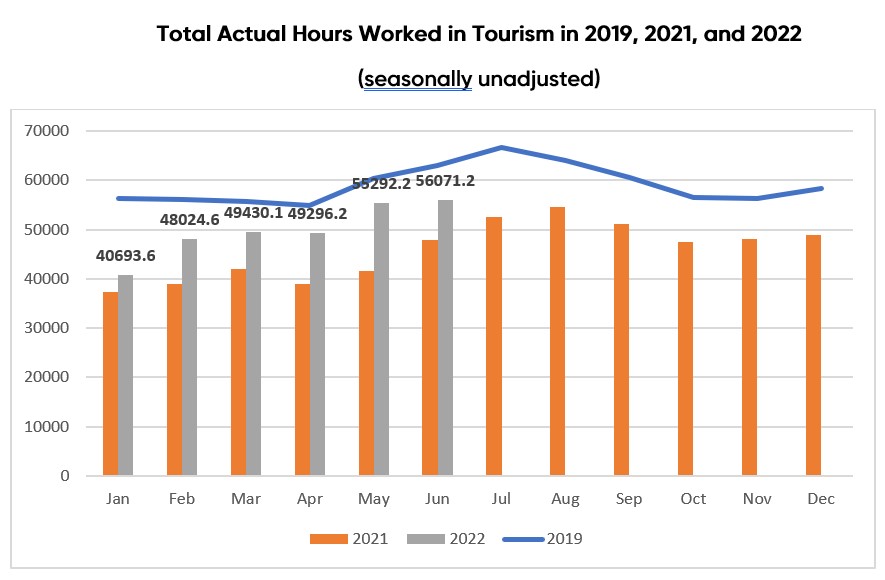
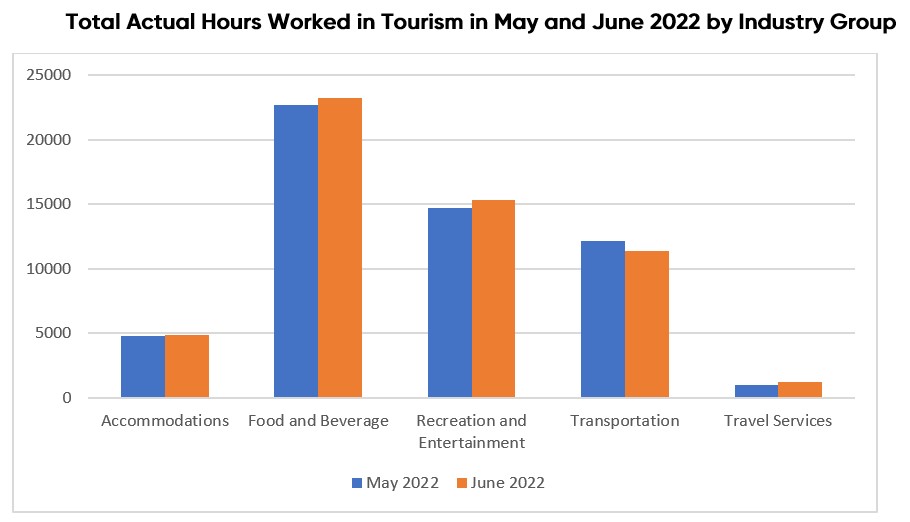
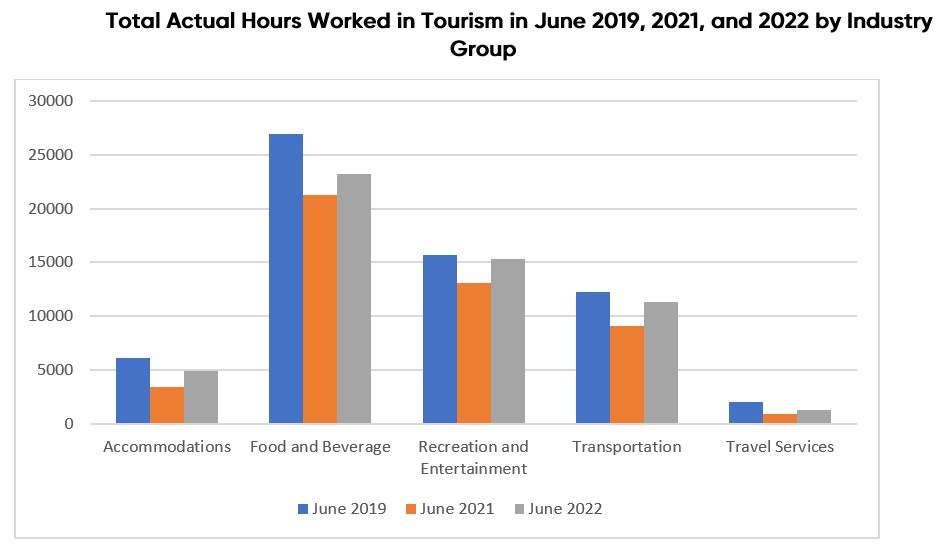
With the approach of summer, the total actual hours worked in the tourism sector increased greatly. As of June 2022, the total actual hours worked increased by 1.4% from May 2022. Overall, the total actual hours worked in 2022 is higher than in 2021 but lower than in 2019. As of June 2022, the total actual hours worked in the tourism sector was 11.1% lower than in June 2019 but was 17.3% higher than in June 2021.
Most tourism industry groups saw an increase in the total hours worked. The travel services industry saw the biggest gains in the total hours worked, with an increase of 28% from May, followed by the recreation and entertainment industry (4.2%), the accommodations industry (2.8%), and the food and beverage services industry (2.5%). The transportation industry was an exception: it saw a decrease of 6.8% in the total hours worked from May.
No tourism industry groups have recovered to the June 2019 levels regarding the total actual hours worked. The travel services industry, in particular, saw a decline of 38.0% in the total actual hours worked from June 2019, followed by the accommodations industry (-20.2%), and the food and beverage services industry (-13.6%). The recreation and entertainment industry was close to reaching 2019 levels, with total actual hours worked down just 2.4% compared to June 2019.
Job Vacancies for Tourism Shows Positive Signs for Workforce Growth
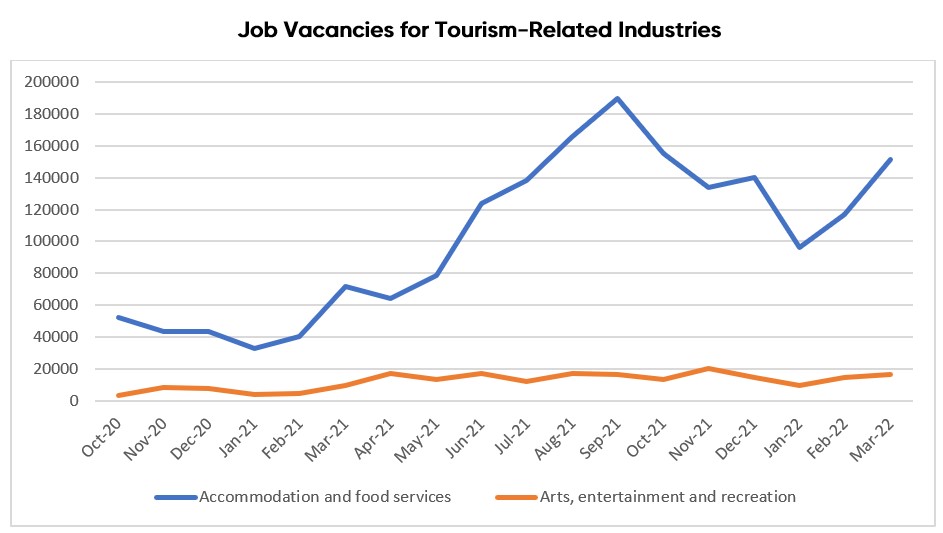
Job vacancy data for the first quarter of 2022 was recently released by Statistics Canada.[4] For the tourism sector, the total number of job vacancies in the first quarter of 2022 was lower than it was in the fourth quarter of 2021. Nevertheless, job vacancies remained high for the accommodation and food services industry and the arts, entertainment, and recreation industry in the first quarter of 2022. As of March 2022, the total number of job vacancies for the accommodation and food services industry and the arts, entertainment, and recreation industry reached 151,555 and 16,515, respectively. Typically, job vacancies for tourism-related industries are the highest in off-peak months. Therefore, the most recent data includes encouraging signs that tourism businesses were active in hiring employees into the spring of 2022.

For a full look at the latest tourism workforce trends, please visit the Tourism Employment Tracker.
[1] Source: Statistics Canada Labour Force Survey, customized tabulations. Based on seasonally unadjusted data collected for the period of June 12 to 18, 2022.
[2] The labour force comprises the total of number of individuals who reported being employed and unemployed (but actively looking for work) in the tourism industries.
[3] As defined by the Canadian Tourism Satellite Account. The NAICS industries included in the tourism sector are those that would cease to exist or operate at a significantly reduced level of activity as a direct result of an absence of tourism.
[4] Source: Statistic Canada. Table: 14-10-0372-01. Job vacancies, payroll employees, and job vacancy rate by industry sector, monthly, unadjusted for seasonality
