Sector Overall Grows, but Accommodations Industry Continues to Struggle
The tourism sector[1] in April 2025 was in a stronger position than in March[2], showing growth in both labour force and employment, and a slight decline in the unemployment rate. The sector also grew relative to April 2024, although it remained slightly below where it was in 2019.
As of the reference week (April 13 to 19), the impacts of economic tensions between Canada and the United States had not yet had a substantial effect on the Canadian tourism sector’s labour situation. Leading indicators from Statistics Canada of international arrivals to the country suggest that visitors to Canada from the US are declining slightly, while Canadian visits to the US are also falling[3]. It remains to be seen whether domestic tourism gains strength as we enter summer and some workers in Canada face layoffs, and what effects those factors will have on employment across the sector.
For most tourism industries, the story was similar to the national picture, with the exception of accommodations, which saw losses across both major indices and an increase in unemployment rate. As has been the case for a while, the reliability of data on travel services remains uncertain.
Table 1 provides a snapshot of the performance of tourism and each of its five industry groups across labour force, employment, and unemployment, as compared with March 2025 [MoM] and April 2024 [YoY], and with April 2019 as a pre-pandemic baseline. Small arrows represent changes of less than 1%, or less than one percentage point (pp) in the case of unemployment.

For most industry groups, April saw growth from March, and over the previous year as well. Accommodations alone saw month-over-month loss, although it was in a stronger position this year than last. Unemployment changes were generally less than one percentage point, with a few exceptions.
The sector as a whole was broadly comparable in size to 2019, although this of course masks variation at the industry level: recreation and entertainment and transportation added to their labour pools, while the other industries saw losses. Note that because the data pertaining to travel services is not necessarily very reliable, this industry group will not be discussed in detail in this report, although the Statistics Canada reported data is provided in the various tables that follow.
Tourism Labour Force
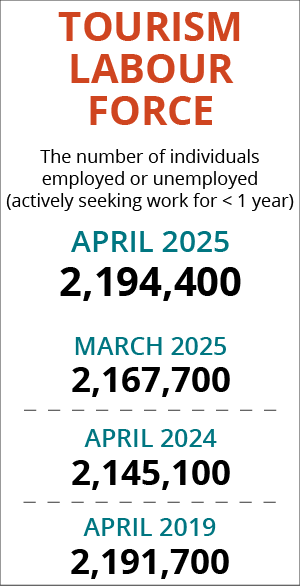
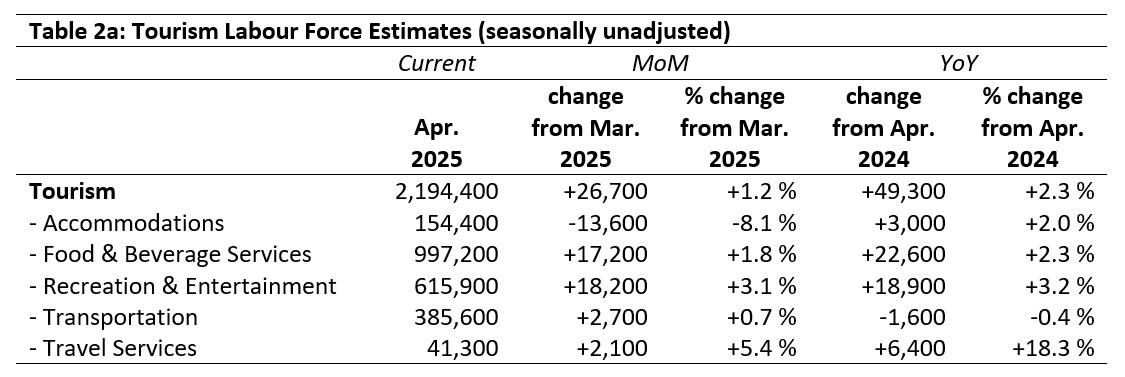
The tourism labour force[4] in April 2025 accounted for 9.8% of the total Canadian labour force, 0.1 percentage points higher than in March, but still 1.1 percentage points below the sector’s 2019 share. The labour force reached 102% of its size from one year ago, and had returned to its pre-pandemic size. Tables 2a and 2b provide a summary of the tourism labour force as of April.
March 2025: Month-over-Month
The overall tourism labour force saw a gain of 1.2% from March, with an additional 26,700 people working, or looking for work, in tourism. Most industries saw gains, with recreation and entertainment seeing both the largest absolute gains and the largest relative gains, while transportation’s gains were more modest. In contrast, accommodations saw a substantial loss over the previous month, with around 13,600 people leaving the industry’s labour pool.
April 2024: Year-on-Year
Relative to last April, the sector had added just shy of 50,000 people to its labour force, a gain of 2.3%. Again, most industries were in a stronger position, with food and beverage services posting the largest absolute gain, and recreation and entertainment showing the largest relative gain. Transportation saw very slight losses, less than one half of one percent, and accommodations saw modest gains.
April 2019: Pre-Pandemic Baseline
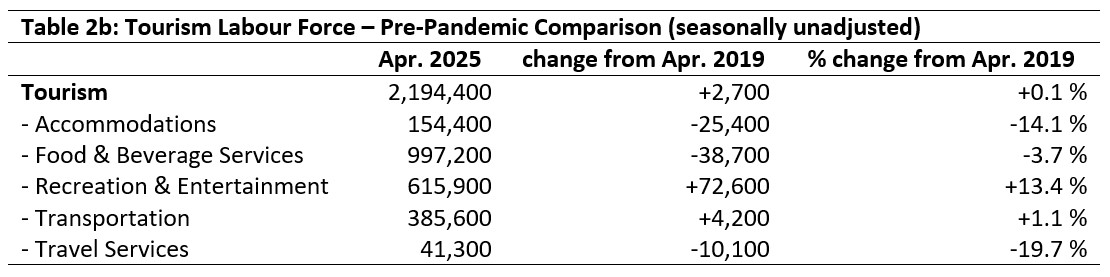
At the sector level, tourism’s labour force had just surpassed its 2019 size by nearly 3,000 people (an increase of 0.1%). However, this increase was almost entirely attributable to growth in recreation and entertainment, which added nearly 73,000 people (+13.4%). Transportation saw a much smaller increase, while all other industries remained substantially below their pre-pandemic levels.
Tourism Employment
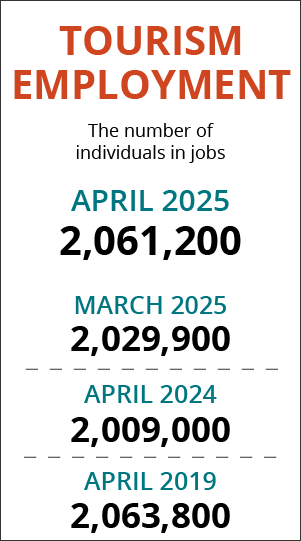
Tourism employment[5] accounted for 9.9% of all employment in Canada, and 9.2% of the total Canadian labour force was working in a tourism industry. Both ratios were slightly higher than they were in March and comparable to last year; tourism’s share of employment was 0.2 percentage points higher than it was in April 2019, but tourism employment’s share of the total labour force was 1.1 percentage points lower. Tables 3a and 3b provide a summary of tourism employment as of April.
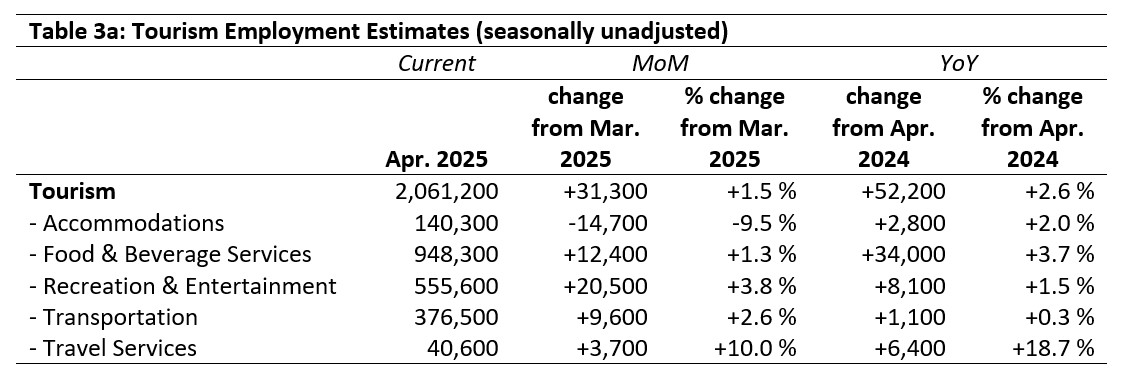
March 2025: Month-over-Month
Employment in the tourism sector increased by around 31,000 people from March. As with labour force, accommodations bucked the trend and saw a loss of nearly 15,000 people from employment. The largest gain in employment was seen in recreation and entertainment, which added over 20,000 people to its pool of workers, while the smallest absolute gain was in transportation, and the smallest relative gain was in food and beverage services.
April 2024: Year-on-Year
Over the past year, the sector saw a net gain of around 52,000 workers, and all industries saw growth, led by food and beverage services (which added around 34,000 people to its workforce), and trailed by transportation (which added just over 1,000 people). Accommodations and recreation and entertainment showed moderate increases.
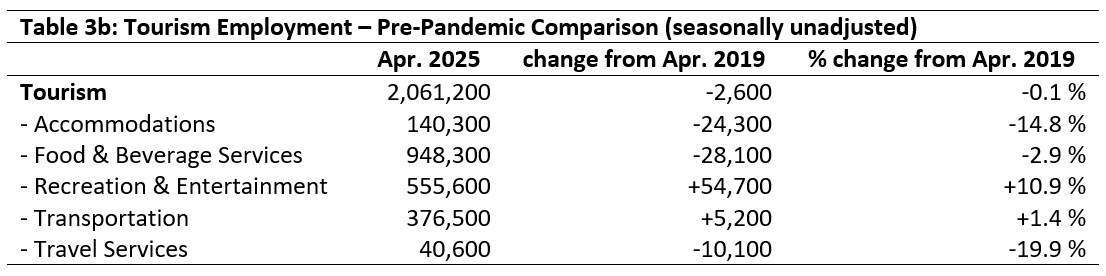
April 2019: Pre-Pandemic Baseline
At the sector level, employment was little changed from 2019, seeing a very slight decrease (-0.1%, a net loss of around 2,600 workers). However, as is so often the case when comparing the current state to the pre-pandemic tourism labour ecosystem, there were substantial differences between industries. As with labour force, recreation and entertainment saw big gains, transportation saw much more modest gains, and the other industries saw sizeable losses.
Part-time vs. Full-time Employment
The ratio of part-time to full-time work provides interesting insights into the stability of the workforce. Throughout the intense period of pandemic recovery, this ratio provided a perspective on how businesses were balancing reduced capacity against a tight labour market, and as we move forward into another period of economic uncertainty—this time caused by trade and political frictions with the United States of America—this index may again prove a useful one. Figure 1 provides an overview of the percentage of part-time employment across the industry groups, using Statistics Canada’s definition of full-time employment (working 30 hours or more per week).
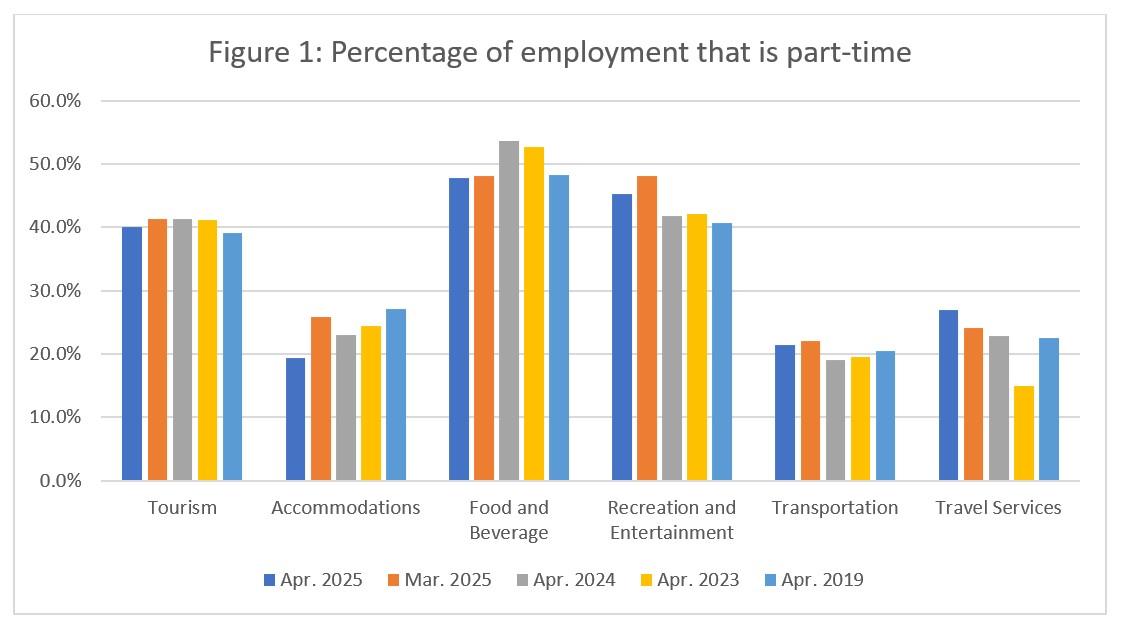
Figure 1 shows an overall trend towards a slight increase in full-time employment, with the sector as a whole seeing a shift of around 1.2 percentage points. Accommodations saw the largest shift, from around 26% to around 19%, and April 2025 saw lower rates of part-time employment than in either of the previous Aprils. This may mark the beginning of the spring-summer peak, or it may reflect a workforce with fewer employees and those employees working longer hours. In food and beverage services, part-time employment was unchanged from March, and comparable to April 2019. Recreation and entertainment saw an increase in part-time employment, which likely aligns with an increase in outdoor activities as the weather improves. Transportation was also largely unchanged from March, but slightly higher than before the pandemic. Travel services showed a continuing trend of increased part-time employment, but as with all data from this industry group, it may not be an accurate snapshot of employment conditions.
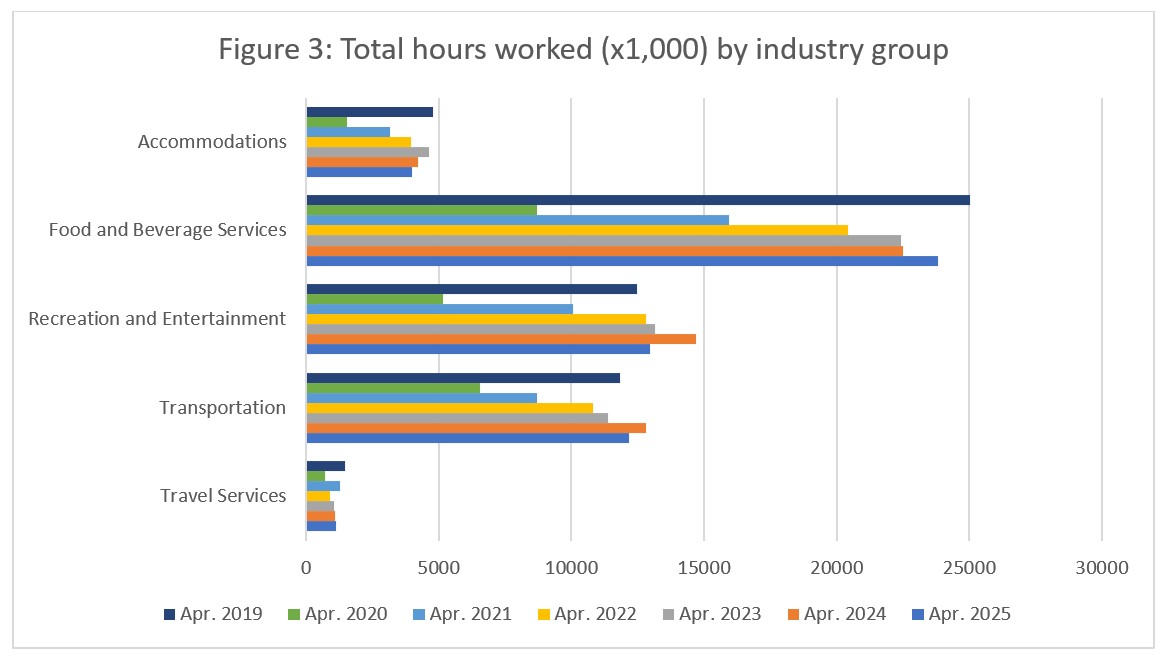
Hours Worked
Another useful metric to assess the stability of the labour market is the total hours worked (see Figure 2), as this index can be more immediately responsive to shifts in consumer demand than raw employment figures alone. As with the part-time to full-time ratio, it may be particularly useful as the sector navigates the choppy waters ahead this summer.
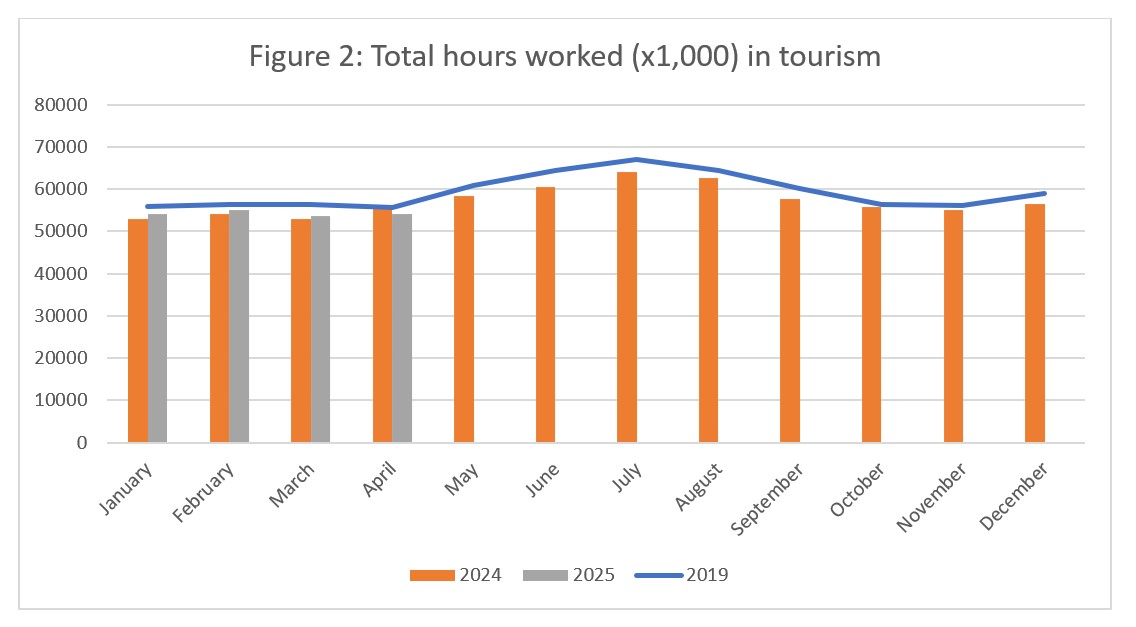
For the first time this year, hours worked were lower than they were in 2024: the sector saw a decrease of around 2.3% over the past year. Growth from March was similarly restrained, seeing gains of less than 1%. The general trend-line for 2025 broadly continues to parallel that of 2019.
At the industry group level (see Figure 3), the year-on-year perspective shows that hours worked in accommodations fell again for the second year, indicating that the industry continues to be squeezed by ongoing labour challenges. Total hours worked also fell from 2024 in recreation and entertainment, by around 13%, although the 2025 figure is on par with that of the previous two years and also with 2019, so it is likely that the 2024 figures represented an abnormally high level. Transportation also saw a decrease in hours worked, but less extreme than in recreation and entertainment, and in the same vein, it looks as though the 2024 total was higher than would have been expected. Food and beverage services saw an increase in total hours worked from last year of around 5.5%, and although it remained below 2019 levels, it marked continued growth in the industry.
Unemployment
The unemployment rate[6] in the tourism sector in April 2025 was 6.1%, slightly lower than the national economy-wide average (7.0%, calculated using seasonally unadjusted data). Both unemployment rates fell slightly from March (-0.1 percentage points for the total Canadian economy and -0.3 percentage points for tourism). Table 4 provides a summary of the national unemployment rates across the tourism sector.
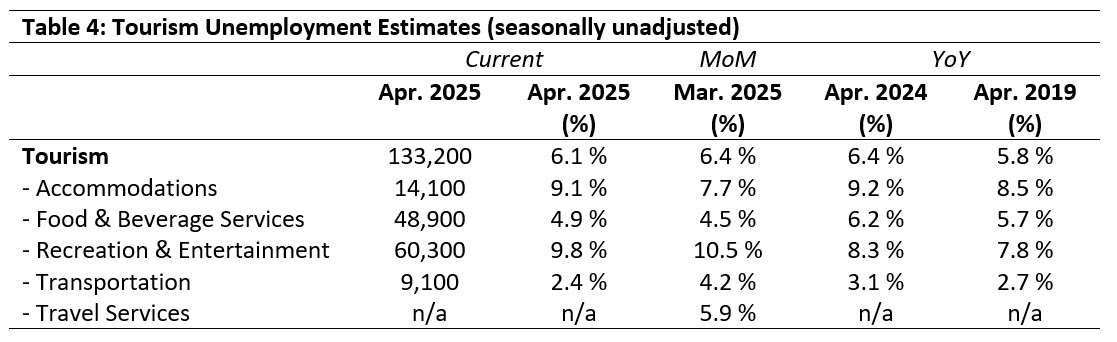
March 2025: Month-over-Month
The sector-level unemployment rate fell slightly from March, but that was not the case for all industry groups. The unemployment rate in accommodations grew by 1.4 percentage points, and by 0.4 percentage points in food and beverage services. It fell 0.7 percentage points in recreation and entertainment, and by 1.8 percentage points in transportation. No data for travel services was available for April.
April 2024, 2019: Year-on-Year
Compared with last year, unemployment rates across the sector were not markedly different, with the largest variances seen in food and beverage services (-1.3 percentage points) and recreation and entertainment (+1.3 percentage points). Similarly, differences between April 2025 and April 2019 were not particularly pronounced either; the largest change was in recreation and entertainment, which added two percentage points. However, as this industry has seen the most rapid resurgence following the pandemic, it is not surprising to find some volatility in these figures.
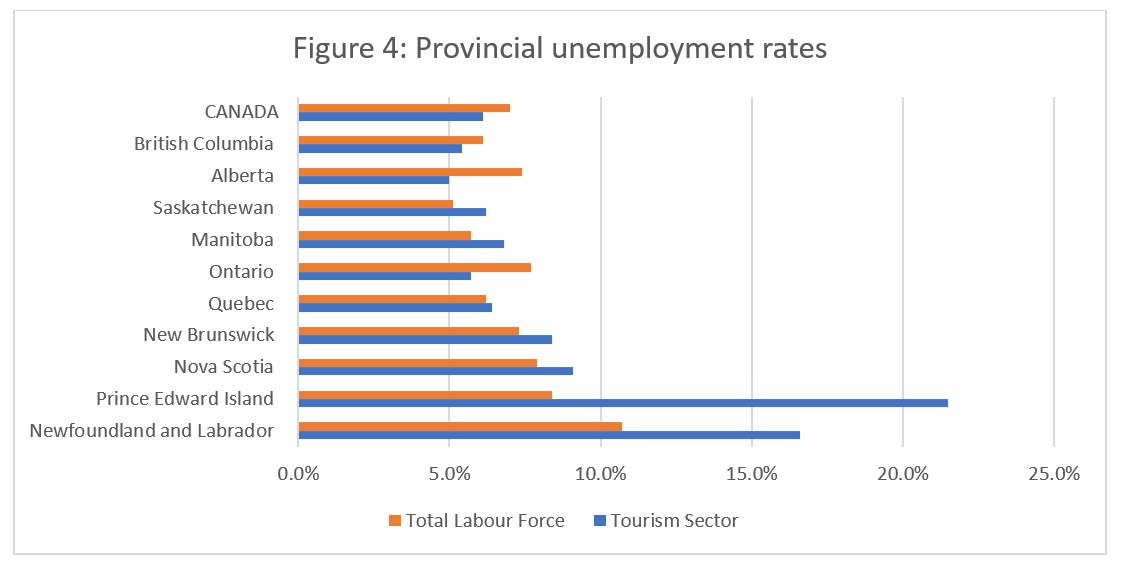
Provincial Tourism Unemployment
At the aggregate national level, the unemployment rate in tourism was lower than that of the national economy-wide average (see Figure 4), a pattern which only held true in three provinces: British Columbia, Alberta, and Ontario. In Prince Edward Island and Newfoundland and Labrador, the tourism unemployment rates far outstripped those of the larger provincial economies, which is not surprising given that the summer tourism season had not yet begun. The tourism unemployment rates were highest in Prince Edward Island (21.5%) and Newfoundland and Labrador (16.6%), and lowest in Alberta (5.0%) and British Columbia (5.4%).
View more employment charts and analysis on our Tourism Employment Tracker.
[1] As defined by the Canadian Tourism Satellite Account. The NAICS industries included in the tourism sector those that would cease to exist or would operate at a significantly reduced level of activity as a direct result of an absence of tourism.
[2] SOURCE: Statistics Canada Labour Force Survey, customized tabulations. Based on seasonally unadjusted data collected for the period of April 13 to 19, 2025.
[3] SOURCE: Statistics Canada Leading indicator of international arrives to Canada, April 2025.
[4] The labour force comprises the total number of individuals who reported being employed or unemployed (but actively looking for work). The total Canadian labour force includes all sectors in the Canadian economy, while the tourism labour force only considers those working in, or looking for work in, the tourism sector.
[5] Employment refers to the total number of people currently in jobs. Tourism employment is restricted to the tourism sector, while employment in Canada comprises all sectors and industries.
[6] Unemployment is calculated as the difference between the seasonally unadjusted labour force and seasonally unadjusted employment estimates. The percentage value is calculated against the labour force.