Tourism Sector Shows Improvement and Stabilizes
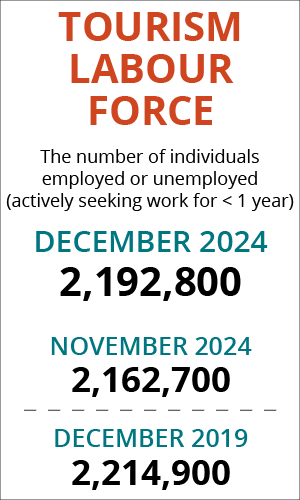
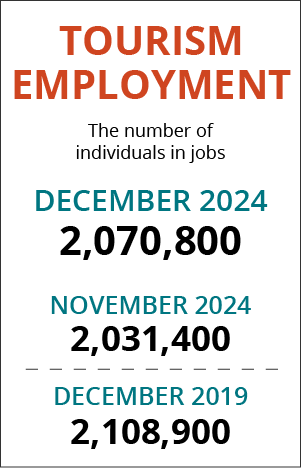
The tourism sector[1] in December 2024 saw modest growth over the previous month[2], in both labour force (+1.4%) and employment (+1.9%). The sector was in a stronger position than last year, but remained between 98% or 99% of its 2019 levels. The net gain in tourism employment was relatively larger than those seen in the broader economy, which saw growth of around 0.7% from November.
At the industry group level, month-over-month and year-over-year patterns were generally stable, with most industry groups seeing gains, and most of the losses being fairly small. Travel services alone saw more substantial losses.
Table 1 provides a snapshot of tourism’s and each of its five industry groups’ performance across labour force, employment, and unemployment, as compared with November 2024 [MoM] and December 2023 [YoY], and with December 2019 as a pre-pandemic baseline. Small arrows represent changes of less than 1%, or less than one percentage point (pp) in the case of unemployment.

Month-over-month, accommodations, recreation and entertainment, and transportation saw gains of between 2% and 5%. Food and beverage services saw a very slight decrease, and travel services saw a more substantial drop on both indices.
Year-over-year, there was more variation between industry groups, but for the most part, employment was in a stronger position. Accommodations saw slight losses in labour force but gains in employment, which pulled down the unemployment rate in the industry group. The pattern was similar but more attenuated for transportation. For food and beverage services and recreation and entertainment, both labour force and employment showed growth over the previous year.
Compared with 2019, a familiar pattern emerged, with recreation and entertainment and transportation alone having surpassed pre-pandemic levels. Unemployment rates at all time scales were highly variable, which is unsurprising given their sensitivity to changes in both labour force and employment.
Although the large monthly deviations seen in mid-2024 for travel services have abated, it’s still worth recalling that the small size of this industry group coupled with the sampling approach in the Labour Force Survey means that any data relating to it should be treated with some caution.
Tourism Labour Force
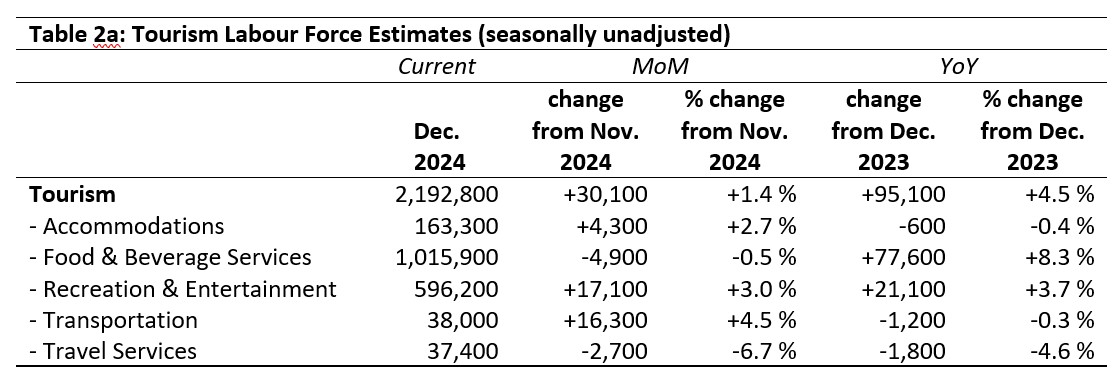
The tourism labour force[3] in December 2024 accounted for 10.0% of the total Canadian labour force, which is higher than previous Decembers since the pandemic began. The labour force had reached 99% of its size of 2019. Tables 2a and 2b provide a summary of the tourism labour force as of December.
November 2024: Month-over-Month
The overall tourism labour force saw gains of just over 30,000 people, an increase of 1.4%; this percentage increase was higher in tourism than was seen across the broader national economy (+0.7% seasonally unadjusted, reported by Statistics Canada with seasonal adjustment as +0.4). The largest gains were seen in recreation and entertainment and in transportation. Accommodations also saw moderate growth from November, adding just over 4,000 people to its labour pool, an increase of 2.7%. Food and beverage services saw a very slight decrease, and travel services posted the most substantial relative drop.
December 2023: Year-on-Year
Relative to last December, the sector’s labour force grew by 4.5%, an injection of around 95,000 people into the tourism labour force. Accommodations saw a very slight increase, as did transportation (both less than 0.5%), while food and beverage services and recreation and entertainment saw much more impressive gains. By far the industry group that gained the most was food and beverage services, which saw a net growth of around 78,000 people available for work (or already working) in the industry. Travel services saw a fairly sizeable contraction over the same period.
December 2019: Pre-pandemic Baseline
At the sector level, the tourism labour force remained around 22,000 people below where it was in December 2019, a net loss of around 1%. Recreation and entertainment, and to a lesser extent transportation, saw growth over the five-year period, while the other industries saw varying degrees of loss. Accommodations and travel services remained around 30,000 people short of their pre-pandemic labour force strength, while food and beverage services stayed depressed by around 46,000 people.

Tourism Employment
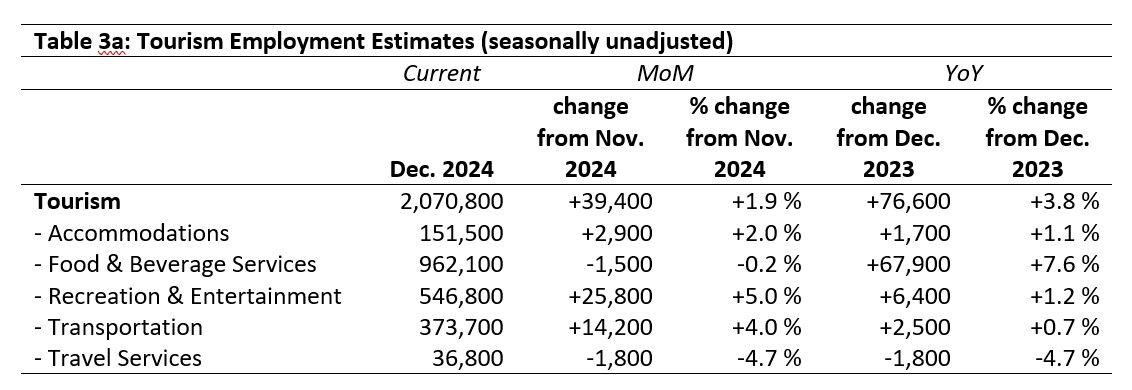
Tourism employment[4] accounted for 10% of all employment in Canada, with 9.4% of the total Canadian labour force working in a tourism industry. Both indices showed an improvement of 0.2 percentage points from last month, but remained below tourism’s pre-pandemic share. Tourism employment in December was 98.2% of what it was in 2019. Tables 3a and 3b provide a summary of tourism employment as of December 2024.
November 2024: Month-over-Month
Employment in tourism grew by almost 2% from last month, with around 39,000 people taking up work in the sector. The strongest gains were unsurprisingly in recreation and entertainment and transportation, which have been consistently outperforming the other industry groups for the past year or so. Accommodations also saw around 3,000 people entering work, while food and beverage services and travel services saw relatively small losses.
December 2023: Year-on-Year
With respect to last year, employment in tourism was in a substantially stronger position, with all industries except for travel services having seen gains. The largest increase in employment was seen in food and beverage services, where around 68,000 people entering the workforce saw a boost of 7.6% overall for the industry. At the sector level, there were around 77,000 more people working in tourism this year than the one previous.
December 2019: Pre-pandemic Baseline
In spite of monthly and annual growth, employment in the sector remained around 2% below where it was in 2019, a net shortfall of around 38,000 workers. The distribution across the five industry groups showed stark differences: recreation and entertainment were both substantially higher than this pre-pandemic benchmark, while all other sectors were substantially lower. The largest absolute loss was seen in food and beverage services, while the largest relative loss was in travel services.

Part-time vs. Full-time Employment
As the data over the past year has shown, the tourism sector has largely stabilized following the sharp decline and gradual recovery following the pandemic. That is not to say that the workforce has entirely returned to its previous configuration—indeed, there have been some structural changes that will continue to impact the dynamics of the labour force.
The ratio of part-time to full-time work can provide interesting insights into emerging patterns of employment, and highlight points of stability and points of material change. Figure 1 provides an overview of the percentage of part-time employment across the industry groups, using Statistics Canada’s definition of full-time employment (working 30 hours or more per week).
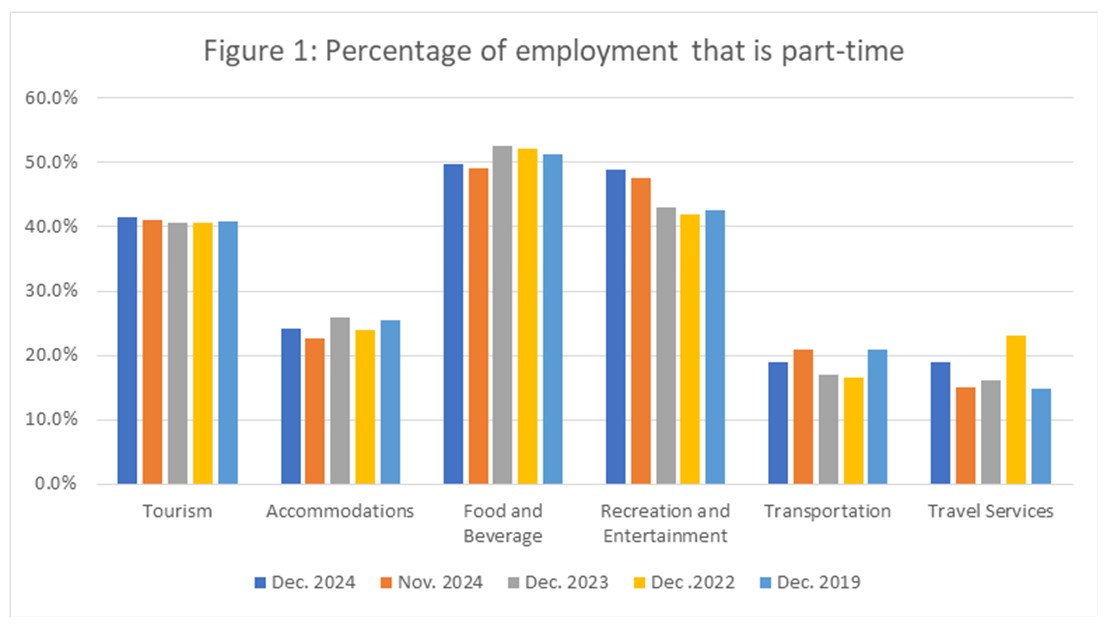
December showed broad stability, which may reflect the extent to which the holiday season exerts consistency on the tourism sector. Climate change and socio-political factors may be unpredictable from year to year, but the seasonality of the holidays is much more routine, both from a tourism demand perspective and that of part-time worker availability (particularly among post-secondary students).
There was a very slight aggregate increase in part-time work from November, but by and large the sector has remained stable at just over 40% part-time employment in December over the past several years, which is consistent with the pre-pandemic pattern.
There was more variability between the different industry groups, although for the most part the fluctuations have not strayed far from previous trends. Accommodations and food and beverage services saw a slight increase in part-time work from November, but remained slightly below December 2019’s rate. Recreation and entertainment likewise saw growth in part-time employment from last month, but has also seen a more focused shift towards increased part-time employment on an annual basis, with December 2024 having seen an increase of around 6.5 percentage points over 2019. Given the pattern of overall employment gains, this shift towards part-time work suggests a broader realignment within the industry group. Transportation saw a decrease in part-time employment from November, although not quite reaching the lows seen during the peak of the pandemic restrictions. Travel services showed a volatile profile, but as noted previously, this industry group may not be well represented in the sampling of the Labour Force Survey, such that minor real-world changes may become disproportionately amplified in the population estimates. Relative to December 2019, this industry has seen a shift of around 4 percentage points towards more part-time workers.
Hours Worked
Another useful metric to assess the stability of the labour market is the total hours worked (see Figure 2), as this index can be more immediately responsive to shifts in consumer demand than raw employment figures alone. This is particularly true in industries or businesses where part-time employment is relatively high, as employers can scale work hours in response to demand more quickly (and more easily) than they can reconfigure their employment roster.
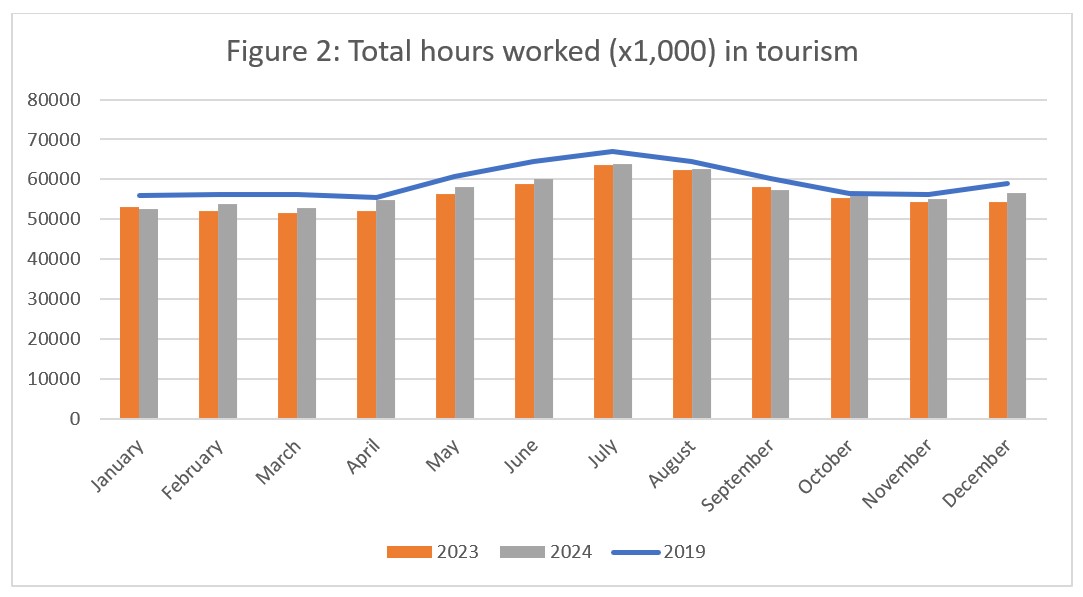
December provides an opportunity to reflect on the year as a whole. At the sector level, hours worked were generally higher in 2024 than they were in 2023, although the effect was marginally less pronounced during the summer peak than at other times of the year. September alone saw a drop from 2023’s total hours worked. Despite coming close in April and in October, hours worked in 2024 never quite reached pre-pandemic levels, although the pattern—the shape of the curve in Figure 2—shows that the cyclic nature of tourism employment has returned to its traditional rhythms, albeit at lower numbers. An optimistic interpretation of this would be that productivity has improved, while a more realistic one would likely be that the sector is continuing to struggle to meet its staffing needs.
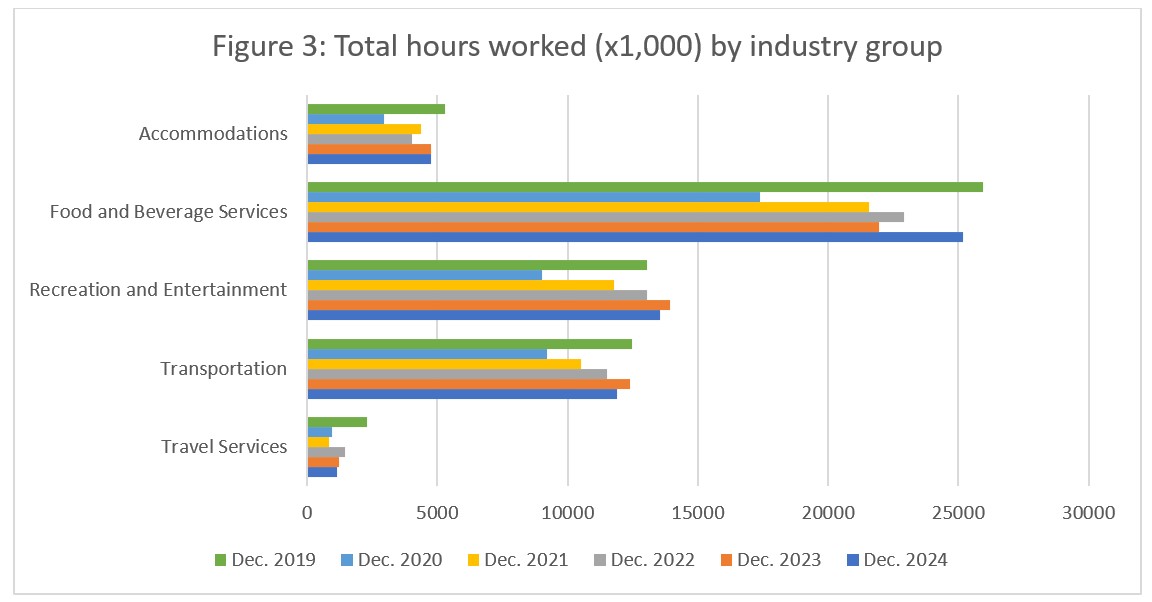
At the industry group level (see Figure 3), the year-on-year perspective shows that recreation and entertainment alone surpassed its 2019 hours worked, although it also saw a slight decrease from last year, which aligns with its increased use of part-time workers. Hours worked in food and beverage services grew substantially from last year (+14.7%), in step with its year-over-year employment gains. Accommodations has stalled in its year-over-year growth, but is more generally continuing to rebuild towards its pre-pandemic total. Travel services has seen the largest relative decrease in hours worked since 2019 (-49.5%), and it seems to have stabilized at this very reduced scale, making it likely that this is the new normal for this industry group.
Unemployment
The unemployment rate[5] in the tourism sector in December 2024 was 5.6%, around 0.6 percentage points below the national economy-wide average (6.2%, calculated using seasonally unadjusted data). The unemployment rate was lower than in November, which is unsurprising given the relatively larger increase in employment than in the labour force. Table 4 provides a summary of tourism unemployment as of December 2024.

November 2024: Month-over-Month
Across industry groups, the unemployment rate was highest in recreation and entertainment, although this marked a decrease from November of 1.7 percentage points, driven by the increases in employment relative to those in labour force. The unemployment rate in accommodations increased slightly, as it did in transportation, while it nudged lower in food and beverage services. No unemployment data is available for travel services.
December 2023 and 2019: Year-on-Year
Compared to last December, unemployment rates were higher at the sector level, as well as in food and beverage services and recreation and entertainment. However, rates were lower in accommodations and in transportation. With respect to 2019, unemployment rates were mostly higher, but not by much: the enormous distortions of the peak pandemic era have passed, and the variation in industry-level aggregate unemployment rates have returned to reflecting the dynamic nature of a complex workforce.
Provincial Tourism Unemployment
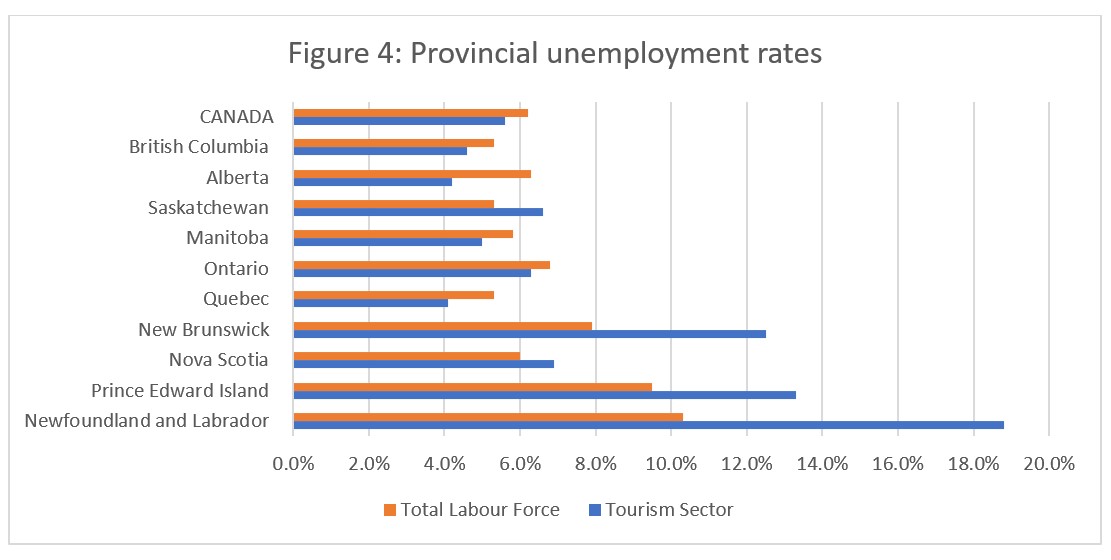
At the national level, the unemployment rate in tourism was lower than that of the national economy-wide average (see Figure 4), a trend mirrored in most of the western and central provinces. In the Atlantic provinces and in Saskatchewan, tourism’s unemployment rate surpassed that of the broader provincial economy, with the gap particularly pronounced in Newfoundland and Labrador (+8.5 percentage points). Tourism’s unemployment rates were highest in Newfoundland and Labrador (18.8%) and Prince Edward Island (13.3%), and lowest in Quebec (4.1%) and Alberta (4.2%).
View more employment charts and analysis on our Tourism Employment Tracker.
[1] As defined by the Canadian Tourism Satellite Account. The NAICS industries included in the tourism sector those that would cease to exist or would operate at a significantly reduced level of activity as a direct result of an absence of tourism.
[2] SOURCE: Statistics Canada Labour Force Survey, customized tabulations. Based on seasonally unadjusted data collected for the period of December 8 to 14, 2024.
[3] The labour force comprises the total number of individuals who reported being employed or unemployed (but actively looking for work). The total Canadian labour force includes all sectors in the Canadian economy, while the tourism labour force only considers those working in, or looking for work in, the tourism sector.
[4] Employment refers to the total number of people currently in jobs. Tourism employment is restricted to the tourism sector, while employment in Canada comprises all sectors and industries.
[5] Unemployment is calculated as the difference between the seasonally unadjusted labour force and seasonally unadjusted employment estimates. The percentage value is calculated against the labour force.
