Fall Contraction in Both Labour Force and Employment
With the summer conclusively drawn to a close, the tourism sector[1] in September 2024 saw a sharp decline in the labour market from August[2]. The labour force fell by just over 180,000 people (-7.9%), while over 155,000 people left employment across the sector (-7.0%); the largest share of these losses was among younger workers (aged 15 to 24), reflecting the return to school for students. Both indices were marginally higher than they were last year (+0.9% and +0.6%, respectively), but remained around 1.5% below 2019 levels.
At the industry group level, the month-over-month picture was one of overall consistency, although there was some variability with respect to 2023 and to 2019.
Table 1 provides a snapshot of tourism’s and each of its five industry groups’ performance across labour force, employment, and unemployment, as compared with August 2024 [MoM] and September 2023 [YoY], and with September 2019 as a pre-pandemic baseline. Small arrows represent changes of less than 1%, or less than one percentage point (pp) in the case of unemployment.
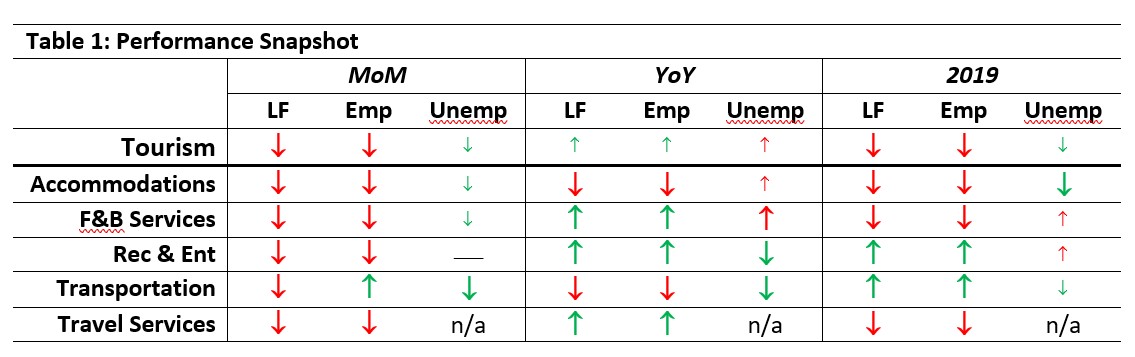
Month-over-month, every industry saw decreases in labour force, and all but transportation saw a decrease in employment. Transportation employment grew by around 5,000 workers (+1.4%). The decrease in labour force was generally larger than that in employment, so unemployment figures (seasonally unadjusted) also fell.
There was more variability across the sector with respect to September 2023, with transportation and accommodations both losing ground in labour force and employment, while other industries saw growth of over 1%, including food and beverage services, which is the largest employment group in the sector.
Relative to 2019, all industries besides recreation and entertainment and transportation remained below their pre-pandemic baseline levels for both labour force and employment. Accommodations and travel services were in the weakest positions, having only reached around two-thirds of their pre-pandemic size, although it should be noted that fluctuations over the past few months in the data pertaining to travel services casts some doubt on its reliability. Data pertaining to accommodations is more reliable, suggesting that the sector continues to struggle in its post-pandemic recovery and regrowth.
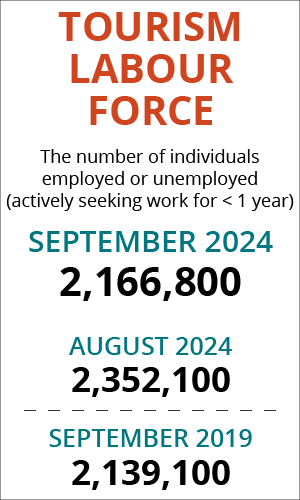
Tourism Labour Force
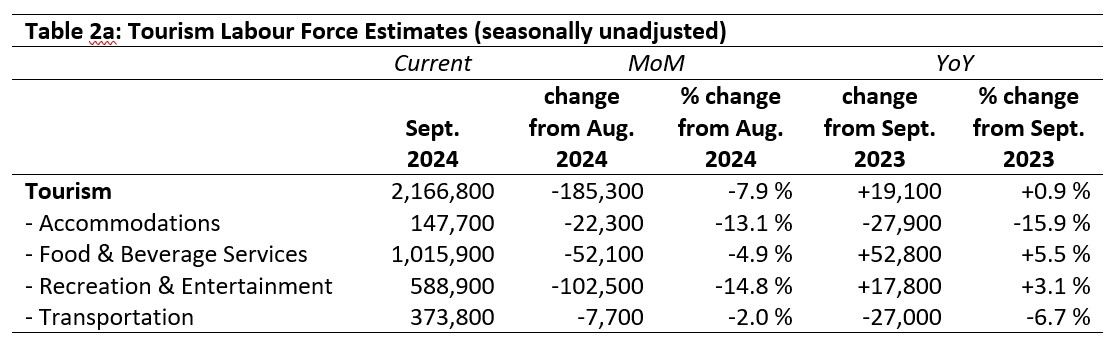
The tourism labour force[3] in September 2024 accounted for 9.9% of the total Canadian labour force, which is 0.6 percentage points below its share in August and 0.9 percentage points below where it was in September 2019. Tables 2a and 2b provide a summary of the tourism labour force as of September.
August 2024: Month-over-Month
The overall tourism labour force saw a substantial loss from August, with over 185,000 people withdrawing from the tourism labour pool. Over 140,000 of these were between the ages of 15 and 24, almost certainly consisting of students returning to full-time study; this percentage change is comparable to what was observed in 2023. However, 2024 also saw a 4.5% decrease in employment among workers aged 35 to 44, a loss of 16,000 people from the labour pool that was not matched in the previous year.
Across the industry groups, the largest absolute loss was in recreation and entertainment (over 100,000 people), which also saw the largest relative decrease (14.8%). Food and beverage services saw a loss of over 50,000 people (-4.9%), and accommodations saw a decrease of over 22,000 people (-13.1%). Travel services saw very little change from August, but as noted above, these estimates should be treated with caution.
September 2023: Year-on-Year
Relative to last September, the sector’s labour force was overall in a stronger position, seeing over 19,000 more workers available for employment (+0.9%). Gains in food and beverage services (+52,000 people, +5.5%) and in recreation and entertainment (+18,000 people, +3.1%) offset losses in accommodations (-28,000 people, -15.9%) and transportation (-27,000 people, -6.7%). Travel services saw a gain of 3,300 workers (+8.9%), but the reliability of this estimate is questionable.
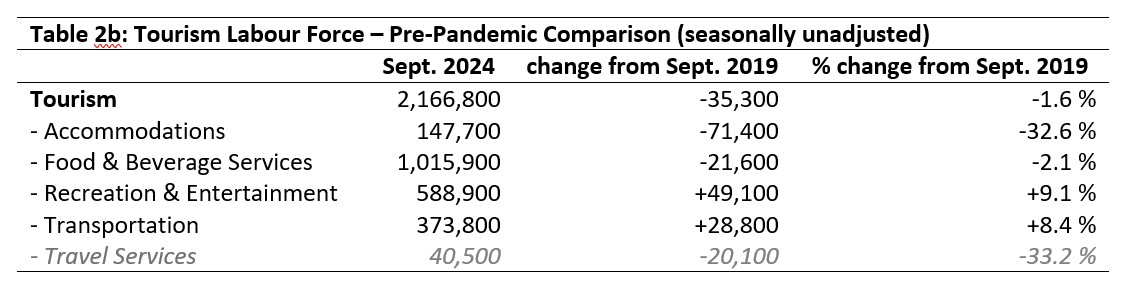
September 2019: Pre-pandemic Baseline
At the sector level, the tourism labour force was 1.6% below its size in September 2019, a net loss of around 35,000 workers. The biggest absolute losses were reported in accommodations (-71,000 people), which accounted for nearly a third of its labour force. Travel services likewise remained at around two-thirds of its 2019 labour force size, an estimate that should (as noted) be treated with caution. Food and beverage services remained around 22,000 workers below its pre-pandemic level, although this amounted to a much smaller relative decrease (-2.1)%. In contrast, recreation and entertainment and transportation had grown by 49,000 and 29,000 people respectively (+9.1% and +8.4%), continuing their trend over the past year or so of outperforming their 2019 levels.
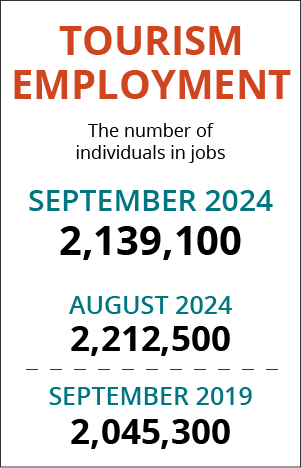
Tourism Employment
Tourism employment[4] accounted for 10.0% of all employment in Canada, and 9.4% of the total Canadian labour force was working in a tourism industry. As expected with the end of summer, tourism employment fell considerably from August (-7.0%), but remained broadly consistent with employment levels in September 2023. Tourism employment’s share of the Canadian labour force was 0.5 percentage points below where it was in August, about 0.2 percentage points below where it was in September 2023, and around 0.9 percentage points below September 2019. Tables 3a and 3b provide a summary of tourism employment as of September 2024.
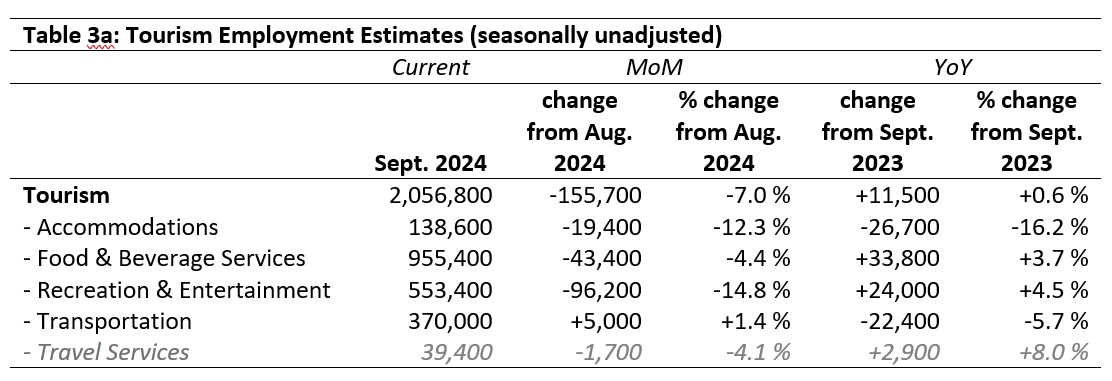
August 2024: Month-over-Month
The largest loss in employment was in recreation and entertainment, which saw both the largest absolute decrease from August (-96,000 employees) and the largest relative decrease (-14.8%). Food and beverage services also saw a considerable loss of workers (-43,000 people) but this represented a much smaller share of its workforce. The absolute loss in accommodations was much smaller, but accounted for a substantially higher proportion of the workforce (-12.3%). Transportation saw an increase of around 5,000 workers, which may reflect the return to regular school bus service across most of the country. Travel services reported a fall in employment of around 4.1%, but this figure should be treated with caution due to the small relative size of the industry in relation to the overall sampling in the survey.
September 2023: Year-on-Year
Employment in tourism was largely unchanged rom last year (+0.6%, an increase of over 11,000 workers), but there was variability between industry groups. Food and beverage services and recreation and entertainment showed modest increases (+3.7% and +4.5%, respectively), while accommodations and transportation saw losses (-16.2% and -5.7%). Travel services reported an increase, but as noted above, the estimate provided is not entirely reliable.
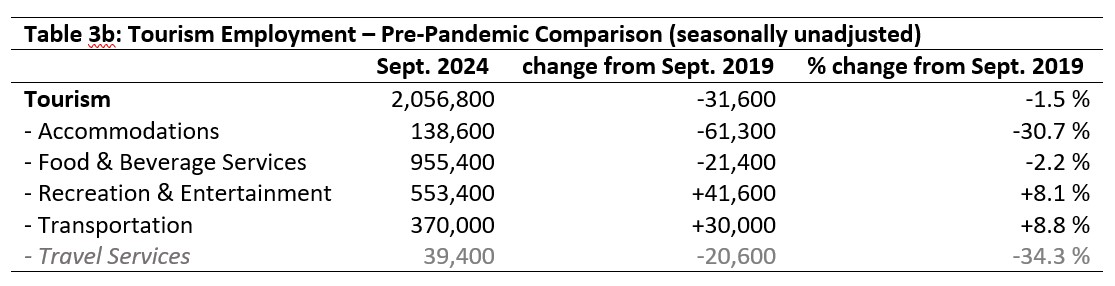
September 2019: Pre-pandemic Baseline
Employment in tourism remained around 1.5% below where it was in September 2019, reflecting a net difference of nearly 32,000 people in jobs; however, the gains and losses across industry groups varied considerably. Accommodations was by far in the worst position overall, having lost over 30% of its workforce (-61,000 people). Travel services reported enormous losses as well, and although the precision of the estimate should be viewed cautiously, it is no doubt the case that this industry has not returned to anything near its pre-pandemic strength. Food and beverage services also lost over 21,000 people from its workforce, although this represented only a 2.2% drop in employment. In contrast, recreation and entertainment and transportation both saw increases of over 8% from 2019 employment levels.
Part-time vs. Full-time Employment
The ratio of part-time to full-time work provides interesting insights into the stability of the workforce, with long-term trends indicating shifts in the post-pandemic working arrangements that characterize tourism employment. Figure 1 provides an overview of the percentage of part-time employment across the industry groups, using Statistics Canada’s definition of full-time employment (working 30 hours or more per week).
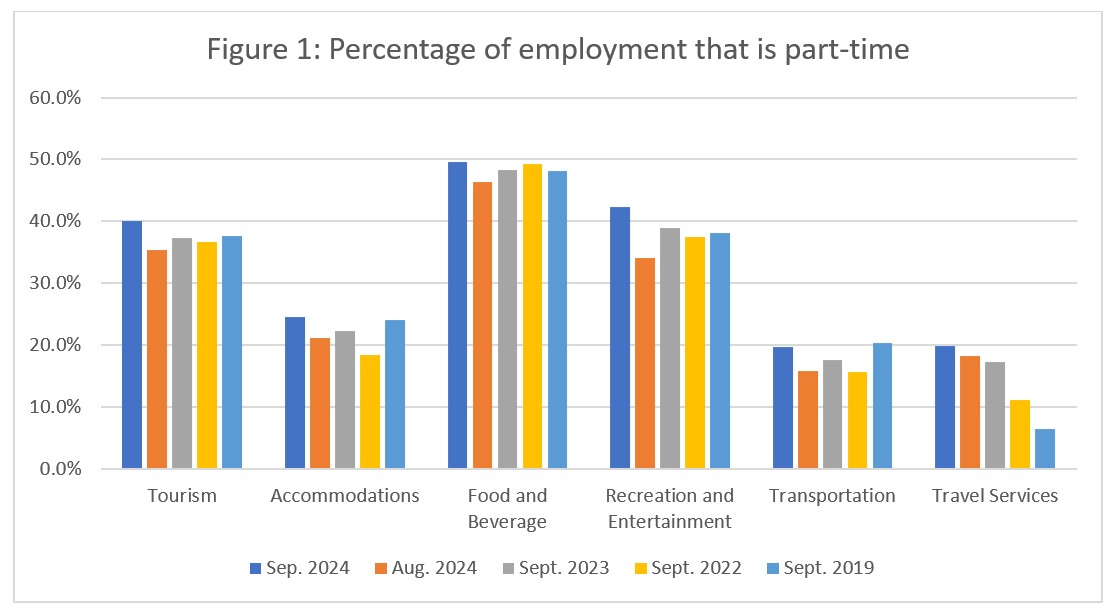
For the most part, the ratio of part-time employment increased by several percentage points from August, which is to be expected as much of the young workforce returned to full-time studies and cut their hours of work back accordingly. This end-of-season effect was most pronounced in recreation and entertainment (a change of 8 percentage points), an industry that is both highly seasonal and relies to large extent on a younger workforce. The effect was least pronounced in travel services, in an industry dominated by long-term workers and with historically very low rates of part-time employment. It is interesting to note the year-over-year increase in the rates of part-time employment in travel services, where in September 2019 only 6.5% of workers were part-time, which had increased to nearly 20% in 2024; as noted elsewhere, trends in this industry group may be exaggerated in the aggregate. In accommodations, food and beverage services, and transportation, the share of employment that was part-time had more or less returned to pre-pandemic levels. In recreation and entertainment, the ratio of part-time to full-time work had increased from pre-pandemic levels.
Hours worked
Another useful metric to assess the stability of the labour market is the total hours worked (see Figure 2), as this index can be more immediately responsive to shifts in consumer demand than raw employment figures alone. Hours can be more readily scaled by an employer—particularly in industries or businesses dominated by shiftwork or part-time employment—than the overall employment roster can be changed (that is, workers hired or fired).
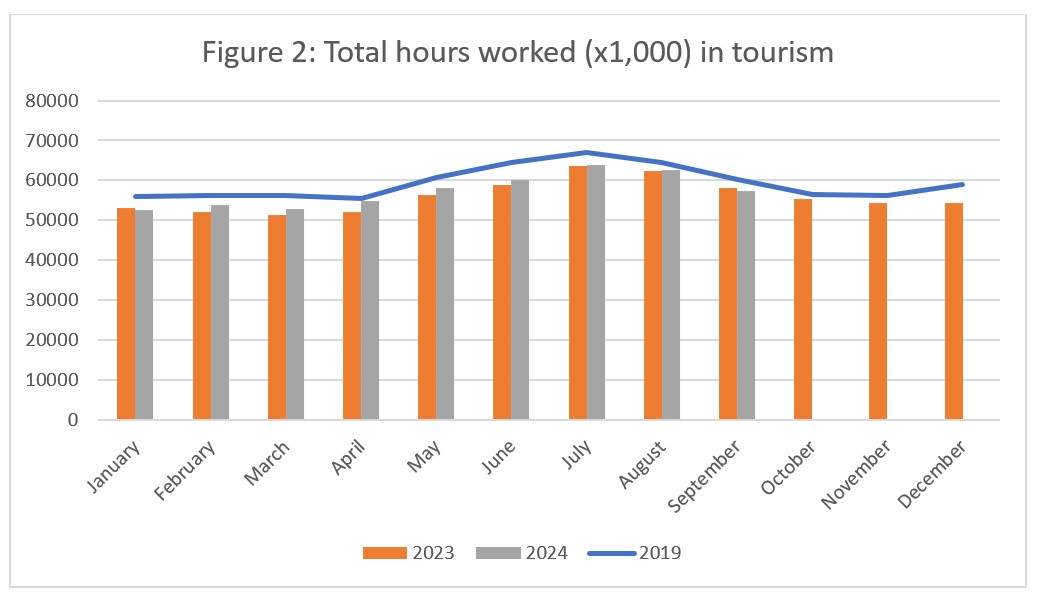
Over the course of 2024 to date, hours worked have generally been above those seen in 2023, but below those of 2019, which indicates that the sector is continuing to rebuild, albeit slowly. September 2024 marked the first month in which hours worked dipped below those of 2023, with a drop of 1.1%. Although the scale of the decrease is small, and may reflect an exceptional seasonal adjustment, it may equally be the beginning of a shift in work trends. As productivity has been increasingly brought forward as part of labour market challenges, more research will be required beyond simple labour market indicators to tell if the decrease in hours worked is directly impacting the economic stability of a sector that is still in recovery.
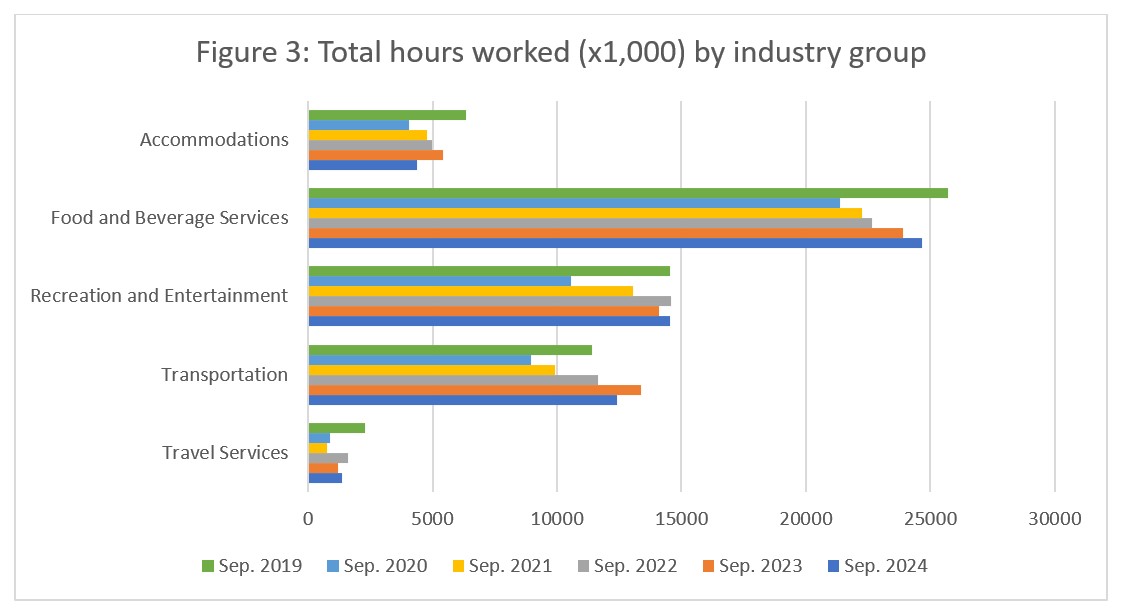
At the industry group level (see Figure 3), the year-over-year perspective shows a mixed profile across industry groups. There was a considerable drop-off from September 2023 in hours worked for both accommodations (-19.7%) and for transportation (-7.2%). These decreases were countered by growth in food and beverage services (+3.1%) and recreation and entertainment (+3.0%). Travel services also posted a sizeable increase (+14.0%), but as with all data related to this industry group, some caution should be taken in working with these observations. Only transportation and recreation and entertainment have surpassed pre-pandemic levels of hours worked in September.
For the most part, there has been a year-over-year increase since the peak of the pandemic, although growth has certainly slowed recently, suggesting that the sector may be nearing the end of its recovery phase. As the situation stabilizes—across this particular metric and across others—we will need to consider moving away from pre-pandemic baselines in evaluating the state of the sector.
Unemployment
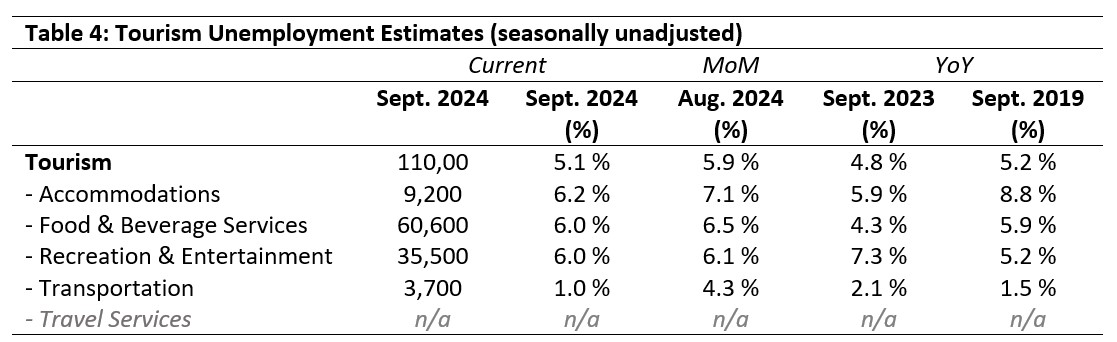
The unemployment rate[5] in the tourism sector in September 2024 was 5.1%, around 0.9 percentage points below the national economy-wide average (6.0%, calculated using seasonally unadjusted data). The national tourism unemployment rate was also below the economy-wide average in August, as it was one year ago (September 2023). No unemployment data was available for travel services.
August 2024: Month-over-Month
The sector aggregate unemployment rate fell from August, which is expected given that the labour force (those available for work) fell more substantially than employment (those actually in work). At the industry group level, there were decreases across the board, some more substantial (-3.3 percentage points in transportation) than others (-0.1 percentage points in recreation and entertainment). Transportation posted the lowest overall unemployment rate in September (1.0%), and accommodations posted the highest (6.2%).
September 2023 and 2019: Year-on-Year
Employment rates in September 2024 were higher than in 2023 for the sector as a whole, and also for accommodations and food and beverage services. Rates were lower year-over-year for recreation and entertainment and for transportation. Relative to 2019, rates were broadly comparable, except for accommodations, which saw the largest decrease since pre-pandemic unemployment rates (-2.6 percentage points); however, this industry group has also seen some of the largest net decreases in the labour force, so this drop is not unexpected.
Provincial Tourism Unemployment
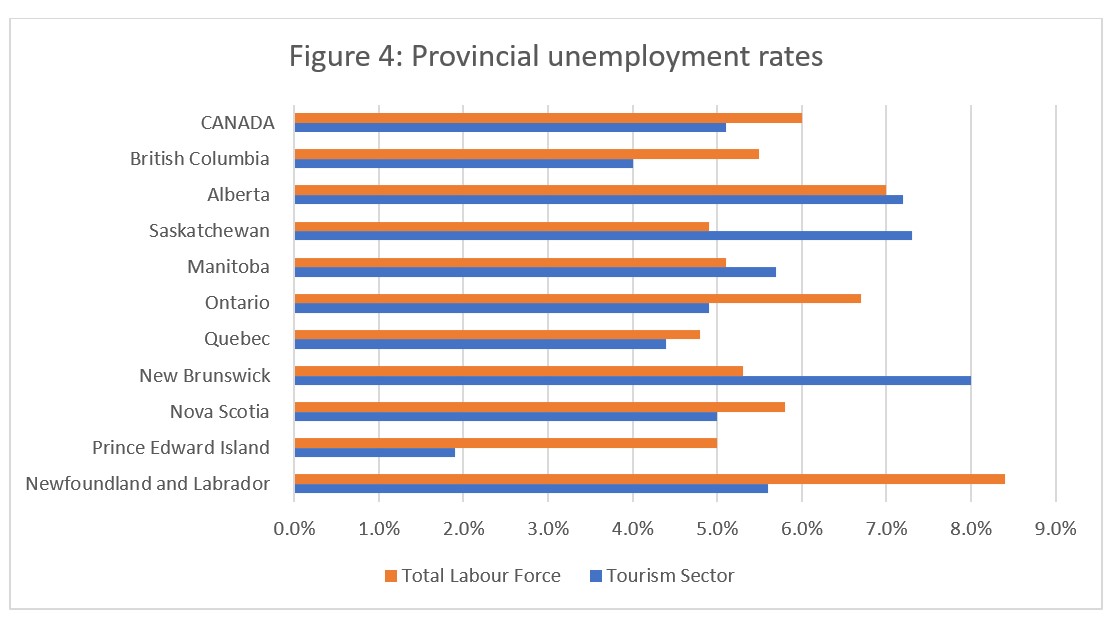
At the aggregate national level, the unemployment rate in tourism was lower than that of the national economy-wide average (see Figure 4), a pattern which also held true for British Columbia, Ontario, Quebec, Nova Scotia, Prince Edward Island, and Newfoundland and Labrador. Tourism unemployment rates were higher than those of the overall provincial economies in Alberta, Saskatchewan, Manitoba, and New Brunswick. The gap between the economy-wide unemployment rates and provincial rates was highest in Prince Edward Island (-3.1 percentage points). Unemployment rates were highest in New Brunswick (8.0%) and Saskatchewan (7.3%), and lowest in Prince Edward Island (1.9%) and British Columbia (4.0%).
View more employment charts and analysis on our Tourism Employment Tracker.
[1] As defined by the Canadian Tourism Satellite Account. The NAICS industries included in the tourism sector those that would cease to exist or would operate at a significantly reduced level of activity as a direct result of an absence of tourism.
[2] SOURCE: Statistics Canada Labour Force Survey, customized tabulations. Based on seasonally unadjusted data collected for the period of September 15 to 21, 2024.
[3] The labour force comprises the total number of individuals who reported being employed or unemployed (but actively looking for work). The total Canadian labour force includes all sectors in the Canadian economy, while the tourism labour force only considers those working in, or looking for work in, the tourism sector.
[4] Employment refers to the total number of people currently in jobs. Tourism employment is restricted to the tourism sector, while employment in Canada comprises all sectors and industries.
[5] Unemployment is calculated as the difference between the seasonally unadjusted labour force and seasonally unadjusted employment estimates. The percentage value is calculated against the labour force.