Summer Sees Continued Growth in Tourism Workforce
With summer in full swing, the tourism sector[1] in July saw growth over the previous month[2], with high school students entering the workforce and the season shifting into higher gear. The sector was in a slightly stronger position than it was last year, although unemployment was generally higher. The gap between the current state of the sector and where it was in July 2019 was around 1%.
At the industry group level, the profile showed some variability across different time scales.
Table 1 provides a snapshot of tourism’s and each of its five industry groups’ performance across labour force, employment, and unemployment, as compared with June 2024 [MoM] and July 2023 [YoY], and with July 2019 as a pre-pandemic baseline. Small arrows represent changes of less than 1%, or less than one percentage point (pp) in the case of unemployment.
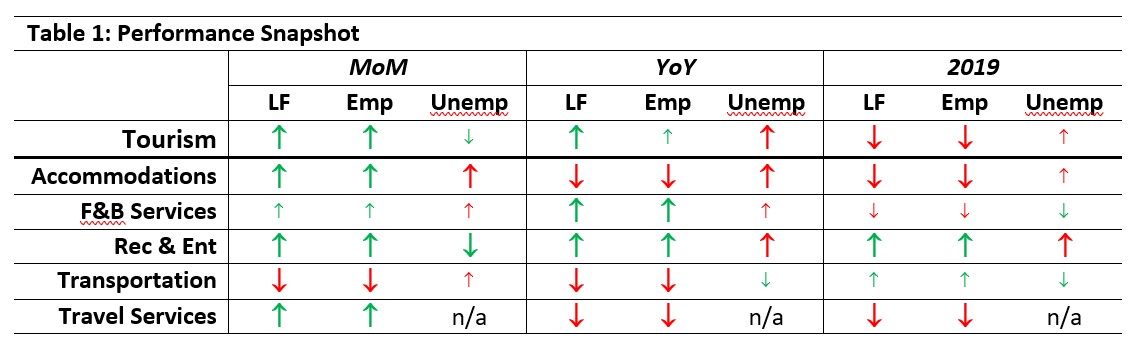
Month-over-month growth was fairly consistent, except for transportation, which saw an expected decline as school bus service wrapped up for the summer. The aggregate sector saw growth over the previous year, but this was carried by food and beverage services and recreation and entertainment; accommodations and transportation were substantially below 2023. The sector overall was still below 2019 levels on labour force and employment, with the exception of recreation and entertainment and, to a lesser extent, transportation.
Travel services continued to show substantial month-over-month fluctuations, very likely indicating that data for this industry group is unreliable. This may be a product of the sampling method for the Labour Force Survey instrument itself, where the response rate from people working in this industry tends to over-amplify small real-world fluctuations when the sample is scaled up to the population level. Estimates provided for this group should therefore be treated with caution, and will not be discussed in any detail throughout this report.
Tourism Labour Force
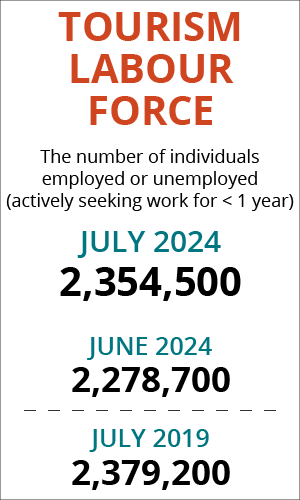
The tourism labour force[3] in July 2024 accounted for 10.6% of the total Canadian labour force, around 0.3 percentage points higher than its share in June but still around 1 percentage point below 2019. Tables 2a and 2b provide a summary of the tourism labour force as of July.
June 2024: Month-over-Month
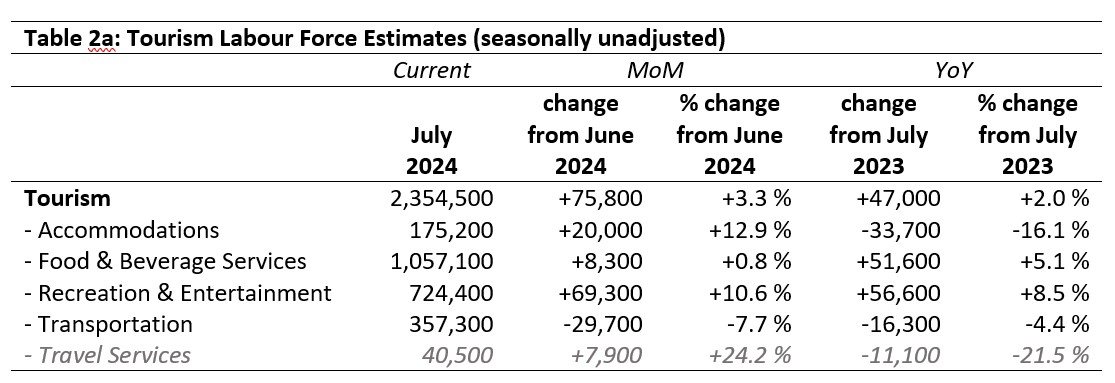
The overall tourism labour force increased by just shy of 76,000 people from June (+3.3%), of which around 65,000 were youth (aged 15 to 24). The majority of this new workforce aligned with the recreation and entertainment industry group, which saw an increase of 10.6%. Accommodations saw an additional 20,000 people (+12.9%), while food and beverage services saw minimal change and transportation saw a decrease of nearly 30,000. The increase in youth participation and the decrease in transportation are both linked to the end of the school year, with secondary students entering the labour market and school bus service being paused for the academic year.
July 2023: Year-on-Year
The global trend of year-on-year improvement following the pandemic continued into July, with the tourism labour force hosting around 47,000 more workers this year than in 2023 (+2.0%). This net sector-level growth masks industry differences, however: food and beverage services and recreation and entertainment each added more than 50,000 people to their respective labour pools, while accommodations and transportation saw losses of nearly 45,000 people. Relative gains were largest in recreation and entertainment (+8.5%) and relative losses were greatest in accommodations (-16.1%). Figures for travel services are not considered reliable.
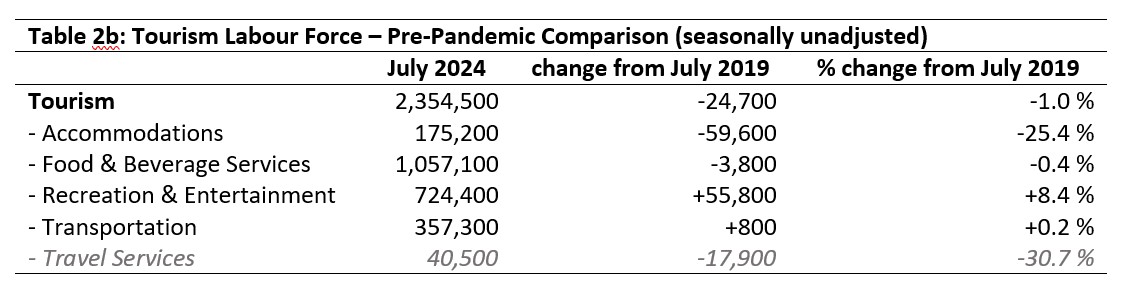
July 2019: Pre-pandemic Baseline
Compared to July 2019, the sector overall had lost nearly 25,000 people in its labour force. The bulk of these losses were in accommodations, which remained in July 2024 nearly 60,000 below pre-pandemic levels. Food and beverage services and transportation saw very small deviations from 2019, while the labour force in recreation and entertainment was elevated by 8.4%, an increase of nearly 56,000 people.
Tourism Employment
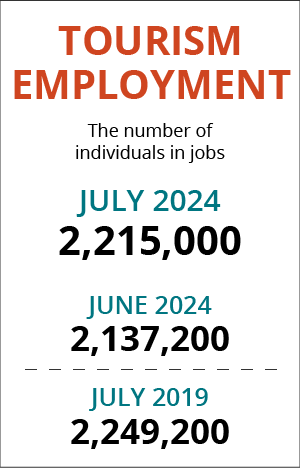
Tourism employment[4] accounted for 10.7% of all employment in Canada, and employed 10.0% of the total Canadian labour force. These figures were both higher than in June, but slightly depressed relative to July 2023. Tourism’s share of all employment was on par with July 2019, although tourism employment’s share of the total Canadian labour force was 0.9 percentage points lower. Tables 3a and 3b provide a summary of tourism employment as of July 2024.
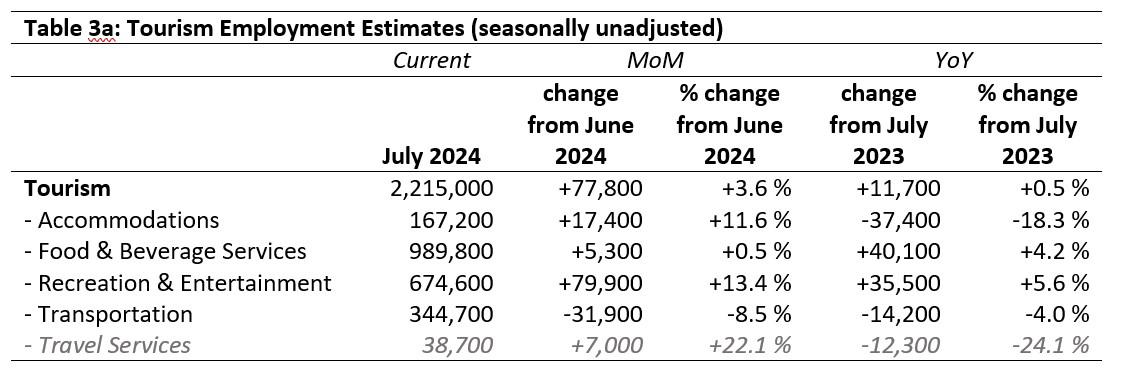
June 2024: Month-over-Month
Tourism employment in July grew faster than labour force, seeing nearly 78,000 people enter employment across the sector (2,000 more people than were added to the labour force). Recreation and entertainment in particular saw strong growth in employment, with around 10,500 more people starting jobs than entering the labour pool for this industry group. Accommodations saw lower employment growth than labour force growth, as did food and beverage services, while transportation saw more people leave employment than leave the labour force. These changes were reflected in unemployment shifts as well (see below).
July 2023: Year-on-Year
Compared to last year, the aggregate tourism employment estimates show only modest growth (+0.5%, representing a net gain of nearly 12,000 people working). Accommodations and transportation both saw substantial decreases, with accommodations’ relative loss (-18.3%) much higher than in transportation (-4%). Food and beverage services and recreation and entertainment both saw considerable growth.
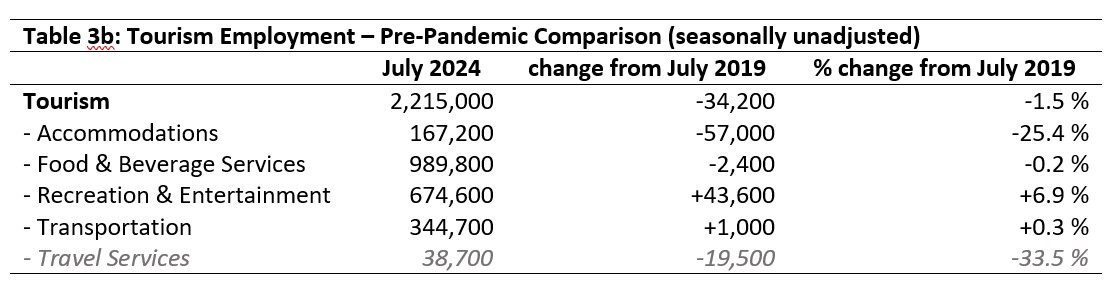
July 2019: Pre-pandemic Baseline
Employment in tourism was depressed by around 1.5% relative to July 2019, a net loss of just over 34,000 workers. Accommodations saw the largest loss overall, having seen 57,000 people leave employment (-25.4%). Food and beverage services saw a very slight decline as well, while transportation saw a slight increase and recreation and entertainment saw much more substantial growth (+6.9%, around 44,000 people in employment).
Part-time vs. Full-time Employment
The stability of the ratio of part-time to full-time work across time provides interesting insights into the dynamics of the workforce, and to what extent the sector is settling into a new configuration of stability. Figure 1 provides an overview of the percentage of part-time employment across the industry groups, using Statistics Canada’s definition of full-time employment (working 30 hours or more per week).
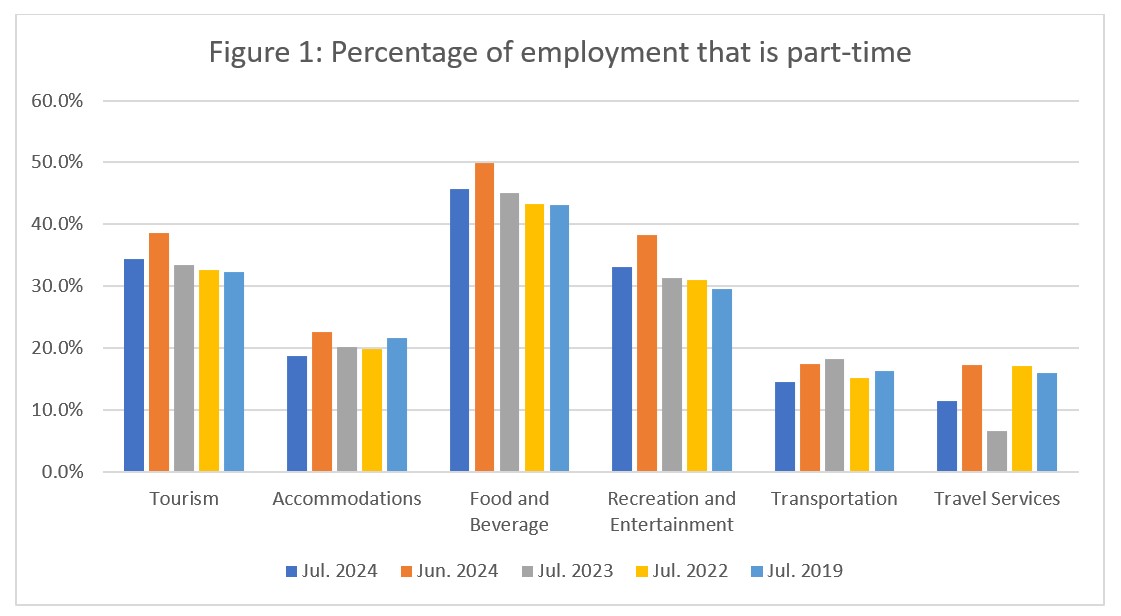
Part-time work was generally depressed in July relative to June (dark blue bars compared to orange, in Figure 1), which is unsurprising given that at least some of the tourism workforce—secondary students in particular—had not yet taken up extra hours in June. By July, they were generally no longer full-time students (some may have been part-time students taking summer courses, but the majority would have been out of school), and many would have extended their work hours to full-time status.
Across the sector as a whole, July 2024 saw slightly elevated rates of part-time work compared to previous years, but this continues a fairly slow and steady increase in part-time work over the past few years. The share of part-time employment in accommodations continued to fall over successive Julys, while it continued to increase in food and beverage services and in recreation and entertainment (large-scale employers of the younger workforce). The picture is a bit more complex in transportation, although the particular impacts of pandemic restrictions on this industry group may be complicating things more than elsewhere in the sector: part-time work was depressed by around 4% relative to July 2023, but only by around 2% relative to July 2019.
Hours worked
The total actual hours worked within the tourism sector is another useful metric by which to assess the health of the labour market (see Figure 2). Businesses with rosters of part-time or casual employees are generally able to scale hours worked more rapidly than they are able to hire or dismiss employees, making this metric more sensitive to surges in customer demand than raw employment figures on their own, although both are needed to have a good understanding of the employment dynamics across the sector.
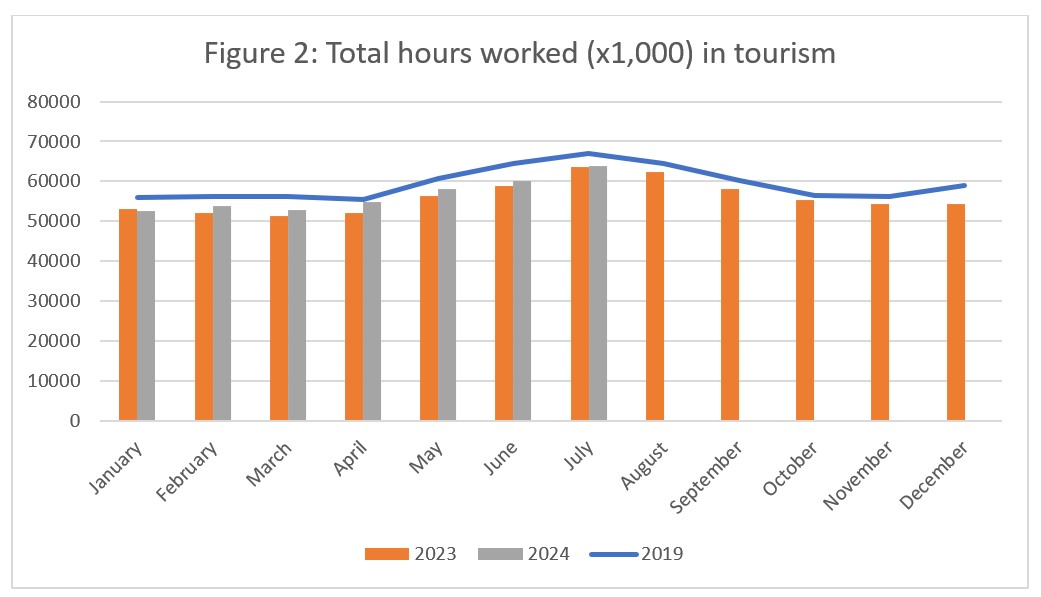
Total hours worked across tourism continued to be higher in 2024 than in 2023, although they remained consistently below 2019 levels. The close parallel between 2023 and 2024 suggests a new stability, where the growth in hours worked (and therefore net work more generally) in summer was more sedate in June than it has been in the past. There remained an undeniable summer bump, but the trajectory of the increase followed a different curve. Many tourism businesses continued to struggle to find sufficient staff, in spite of increased demand from tourists (and local customers), so it may be that the sector will continue to see depressed hours for some time to come.
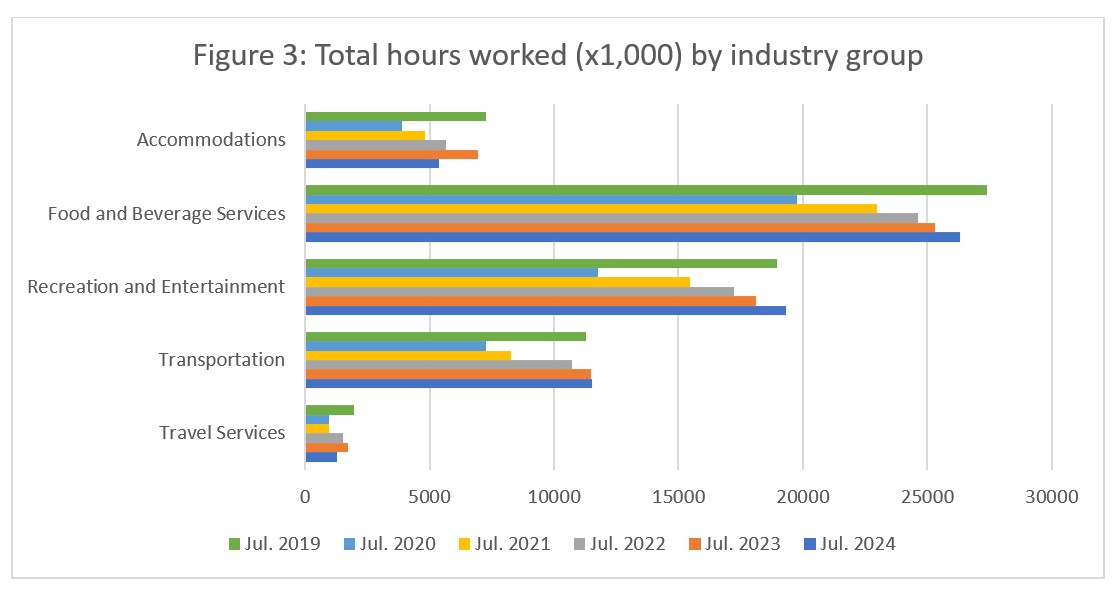
Figure 3 presents a year-over-year comparison of hours worked across the five industry groups. Recreation and entertainment and transportation were the only two groups in July 2024 to have surpassed hours worked in July 2019, while food and beverage services and accommodations were yet to surpass this benchmark. Accommodations saw a substantial decrease in hours worked from last year (around -22%), which aligns with the loss in employment of around 18% noted earlier.
Unemployment
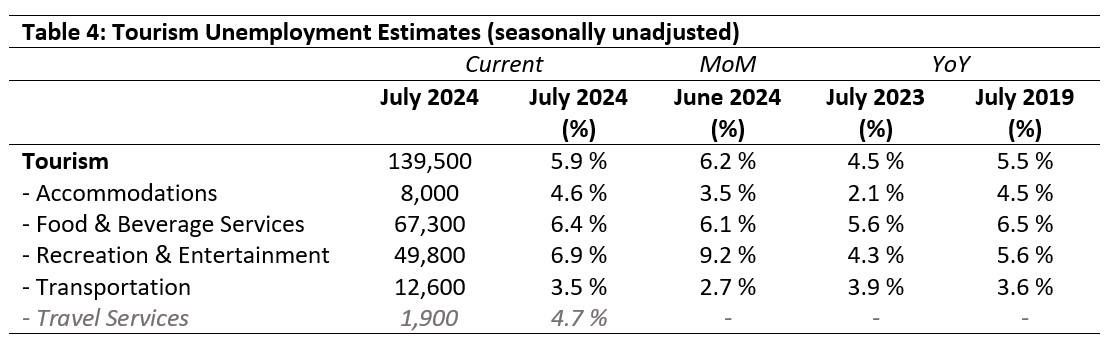
Unemployment[5] in the tourism sector in July 2024 was 5.9%, nearly a full percentage point below the economy-wide national average (6.8%, using seasonally unadjusted data). The sector saw around 140,000 people out of work but actively looking, a very slight decrease on last month, although as the overall labour force grew slightly, the relative difference was around 0.3 percentage points. Table 4 provides a summary of tourism unemployment in June.
June 2024: Month-over-Month
The unemployment rate at the sector level saw a slight decrease (-0.3 percentage points), although most industry groups saw slight increases in their respective unemployment rates. Recreation and entertainment alone saw a decrease, falling by 2.3 percentage points. Unemployment rates increased by 1.1 percentage point in accommodations, by 0.3% in food and beverage services, and by 0.8 percentage points in transportation.
July 2023 and 2019: Year-on-Year
The sector-level employment rate was around 1.4 percentage points higher than in July 2023, which may reflect the still-constrained labour force one year ago. The rate in 2019 was much closer to what we saw this July. Across most industry groups, unemployment rates relative to pre-pandemic estimates were quite similar, except in recreation and entertainment where the figure was 1.3 percentage points higher than in July 2019. This is likely a product of the rapid growth in the labour force for this industry group. Relative to last year (July 2023), unemployment rates were generally elevated by one to two percentage points, except for transportation, which was slightly lower.
Provincial Tourism Unemployment
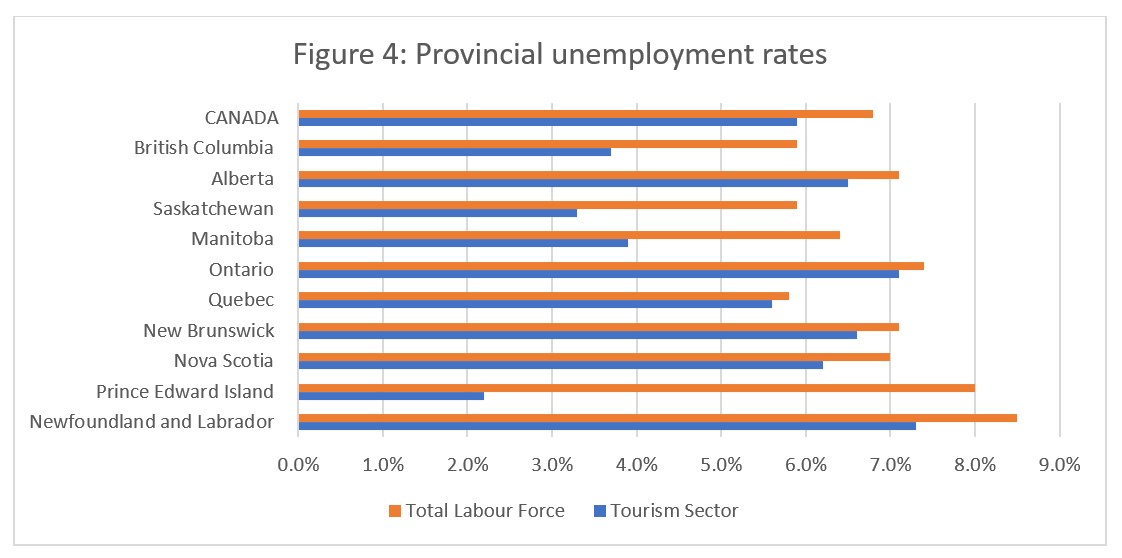
At the aggregate national level, unemployment in tourism was lower than across the wider economy (see Figure 4), and in fact this pattern held true for all provinces. The gap between overall unemployment rates and those in tourism was highest in Prince Edward Island (the overall provincial unemployment rate was 8.0%, compared with 2.2% in tourism), and smallest in Quebec (a difference of only 0.2 percentage points). Tourism unemployment rates were highest in Newfoundland and Labrador (7.3%) and Ontario (7.1%), and lowest in Saskatchewan (3.3%) and Prince Edward Island (2.2%).
View more employment charts and analysis on our Tourism Employment Tracker.
[1] As defined by the Canadian Tourism Satellite Account. The NAICS industries included in the tourism sector those that would cease to exist or would operate at a significantly reduced level of activity as a direct result of an absence of tourism.
[2] SOURCE: Statistics Canada Labour Force Survey, customized tabulations. Based on seasonally unadjusted data collected for the period of July 14 to 20, 2024.
[3] The labour force comprises the total number of individuals who reported being employed or unemployed (but actively looking for work). The total Canadian labour force includes all sectors in the Canadian economy, while the tourism labour force only considers those working in, or looking for work in, the tourism sector.
[4] Employment refers to the total number of people currently in jobs. Tourism employment is restricted to the tourism sector, while employment in Canada comprises all sectors and industries.
[5] Unemployment is calculated as the difference between the seasonally unadjusted labour force and seasonally unadjusted employment estimates. The percentage value is calculated against the labour force.