Start of Summer Sees Gentle Growth Across the Sector
Overall, the tourism sector[1] in June saw moderate growth over the previous month[2], as businesses continued to grow their workforces in anticipation of the summer surge in demand. The sector overall was in a stronger position than in June 2023, although accommodations and travel services lost ground over the past year. The gap between the current state of the sector and where it was in June 2019 was around 1%.
At the industry group level, the profile overall was fairly consistent on a month-over-month basis, with some variability across industry groups at different time scales.
Table 1 provides a snapshot of tourism’s and each of its five industry groups’ performance across labour force, employment, and unemployment, as compared with May 2024 [MoM] and June 2023 [YoY], and with June 2019 as a pre-pandemic baseline. Small arrows represent changes of less than 1%, or less than one percentage point (pp) in the case of unemployment.
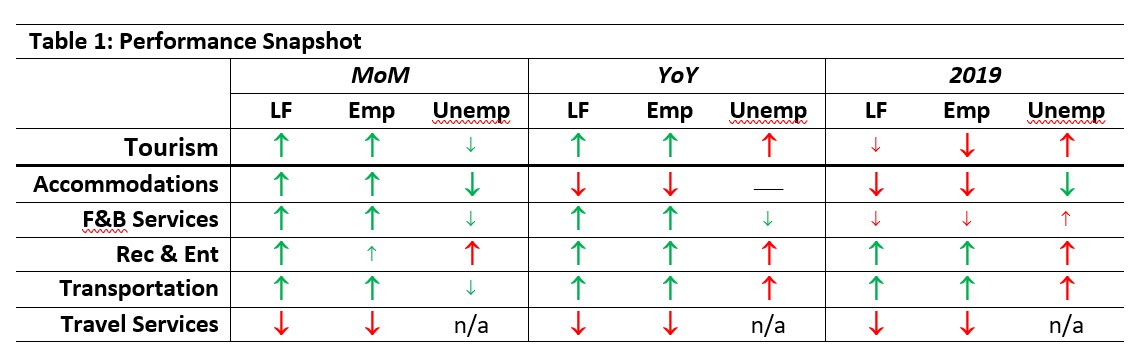
All industry groups except travel services grew over May, although not at such high rates as seen in the previous Labour Force Survey (LFS) report. Travel services data continues to show substantial fluctuation month to month, a level of volatility that is unlikely to be an accurate representation of the industry group, and more likely a product of the sample size of the LFS.
Month-over-month gains were strongest in accommodations, where employment grew by 7.5% while the labour force grew by only 3.5%; unemployment in this industry group has fallen to a lower level than what we have seen in several months. Relative to last year, food and beverage services posted the strongest gains, with labour force increased by 5.9% and employment by 6.3%. Compared to pre-pandemic levels, only recreation and entertainment and transportation had surpassed this benchmark in either labour force or employment.
Tourism Labour Force
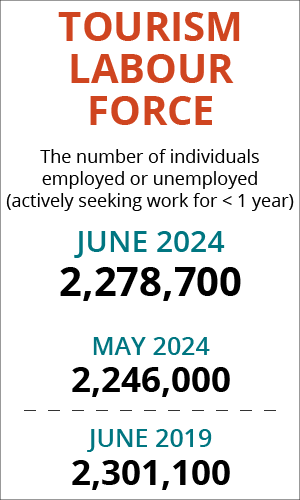
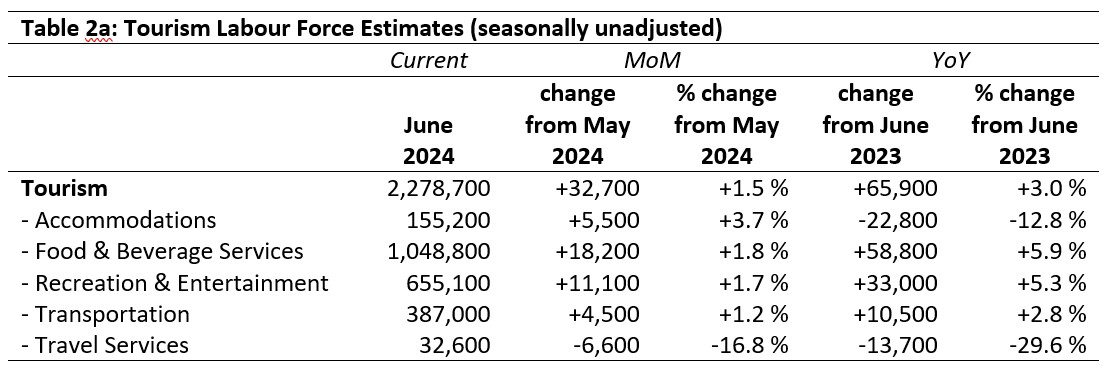
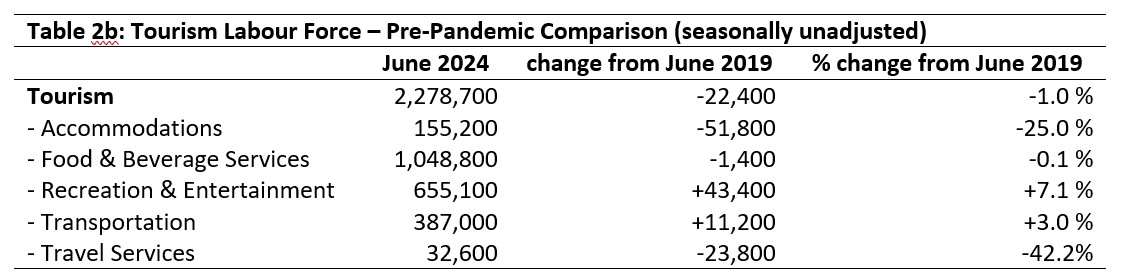
The tourism labour force[3] in June 2024 accounted for 10.3% of the total Canadian labour force, 0.9% below where it was in 2019 but 0.1% higher than in May. Overall, the sector’s labour force was 99.0% of its size in June 2019. Tables 2a and 2b provide a summary of the tourism labour force as of June.
May 2024: Month-over-Month
The tourism labour force overall increased by nearly 33,000 people since June, an increase of 1.5%. This increase was smaller than that observed in May, suggesting that the early surge in post-secondary student hiring has slowed. Those who were late entering the summer job market, along with those secondary students who got a head start, likely accounts for the past month’s increase. The largest absolute gains were in food and beverage services (where 18,000 new people reflected a 1.8% increase in available workers), while the largest relative gains were seen in accommodations (where 5,500 people accounted for a 3.7% increase). The 16.8% drop in the travel services labour force is likely an overestimation of changes in the industry, as a result of the small sample size for this group in the LFS instrument.
June 2023: Year-on-Year
Overall, the sector was in a stronger position in June 2024 than in June 2023, at least at the aggregate level: there was a net increase of around 66,000 people (+3.0%), with the strongest absolute gains seen in food and beverage services (+59,000, +5.9%). In contrast, accommodations lost nearly 33,000 over the past 12 months, resulting in a net decrease for this industry group of 12.8%. Recreation and entertainment and transportation also saw growth over 2023. As noted above, the estimates for travel services should be treated with some suspicion.
June 2019: Pre-pandemic Baseline
The sector as a whole remained around 1% below where it was in June 2019, a net loss of just over 22,000 people available for work. Accommodations was the most heavily impacted, with a decrease of one-quarter compared to 2019 (just shy of 52,000 people). Recreation and entertainment and transportation were the only two industry groups to have surpassed pre-pandemic labour force levels, with recreation and entertainment operating at 107.1% of its 2019 level and transportation at 103%.
Tourism Employment
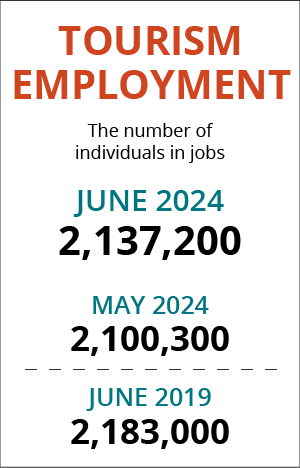
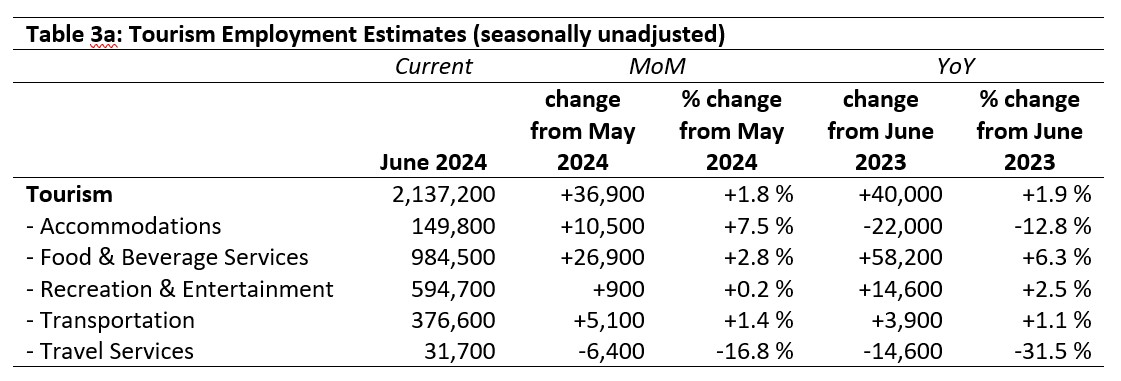
Tourism employment[4] accounted for 10.3% of all employment in Canada, and around 9.6% of the available Canadian workforce was employed in tourism. Tourism employment’s share of the Canadian labour force decreased by around 0.1 percentage points from May, while its share of total Canadian employment rose by around 0.2 percentage points. Both indices were within 0.1 percentage point of where they were in June 2023, but around 1 percentage point below June 2019. Tables 3a and 3b provide a summary of tourism employment as of June 2024.
May 2024: Month-over-Month
In the past month, tourism employment has increased by nearly 37,000 people, a growth of 1.8%. The largest absolute gain was seen in food and beverage services, which saw nearly 27,000 people in new employment (+2.8%), and the largest relative gain was in accommodations, where 7.5% growth accounted for over 10,000 people in new employment. Recreation and entertainment was virtually unchanged, seeing fewer than 1,000 people added across the country. Transportation saw moderate increases (+1.4%), while travel services posted a dramatic decrease, although as noted in the labour force section of this report, this is likely an inaccurate figure.
June 2023: Year-on-Year
The monthly increase was on par with the year-on-year increase, where the addition of 40,000 workers since June 2023 amounted to an increase of 1.9%. Accommodations saw a substantial loss over this time frame, with 22,000 workers displaced (-12.8%), while food and beverage services saw growth of 6.3%. Travel services reported a loss, although this number should be viewed with caution.
June 2019: Pre-pandemic Baseline
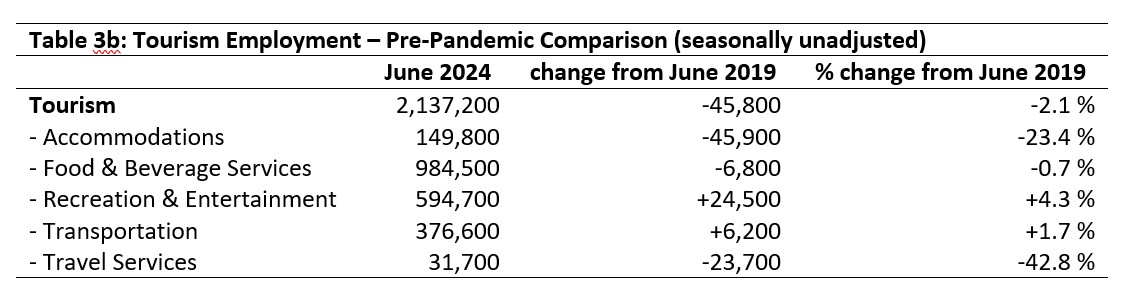
Employment across the tourism sector remained 2.1% below where it was in 2019, an overall loss of nearly 46,000 people in employment. The bulk of these were in accommodations (-46,000; -23.4%), while food and beverage services saw a much more modest decrease of less than 1%. Employment in recreation and entertainment and in transportation grew over the past five years, in line with changes in the labour force (see earlier in this report). As noted elsewhere, the drop in travel services should not be taken as an accurate estimate of employment changes in this industry group.
Part-time vs. Full-time Employment
The stability of the ratio between full-time and part-time work across the tourism sector provides interesting insights into the dynamics of the workforce. Figure 1 provides an overview of the percentage of part-time employment across the industry groups, using Statistics Canada’s definition of part-time work as that which is under 30 hours per week.
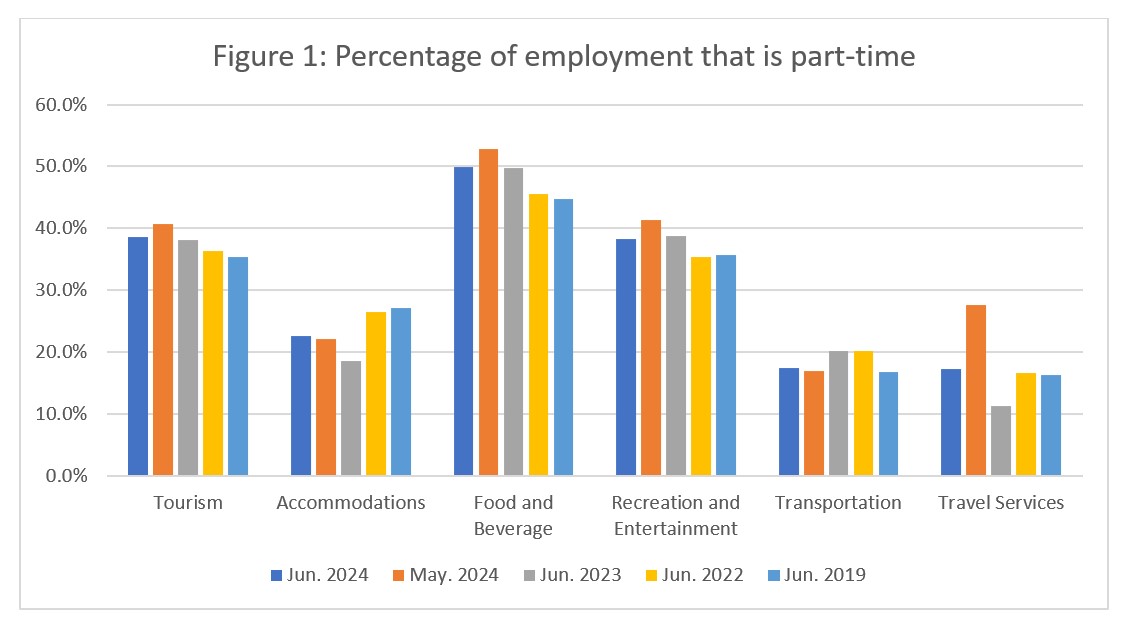
Since 2019, the share of part-time work in June has been gradually increasing, although the rate dropped by around 2 percentage points since May. This can largely be accounted for by the month-over-month decreases in part-time employment in food and beverage services and recreation and entertainment, both industries that employ high numbers of students, and who have therefore seen substantial shifts from part-time to full-time hours as summer begins to ramp up. In accommodations and transportation, there was a slight increase in the share of work that was part time. Travel services saw a substantial drop (-10.3 percentage points), although the general trajectory of data suggests that May’s high share of part-time workers was a departure from seasonal norms.
Hours worked
The total actual hours worked within the tourism sector is another useful metric by which to assess the health of the labour market (see Figure 2), given that employers are able to scale hours worked across their workforce more easily and rapidly than they are able to change their payroll roster entirely. This is particularly true in industries and businesses that have a high share of part-time workers. This makes the metric of hours worked in some ways more sensitive to short-term changes in customer demand than raw employment figures on their own.
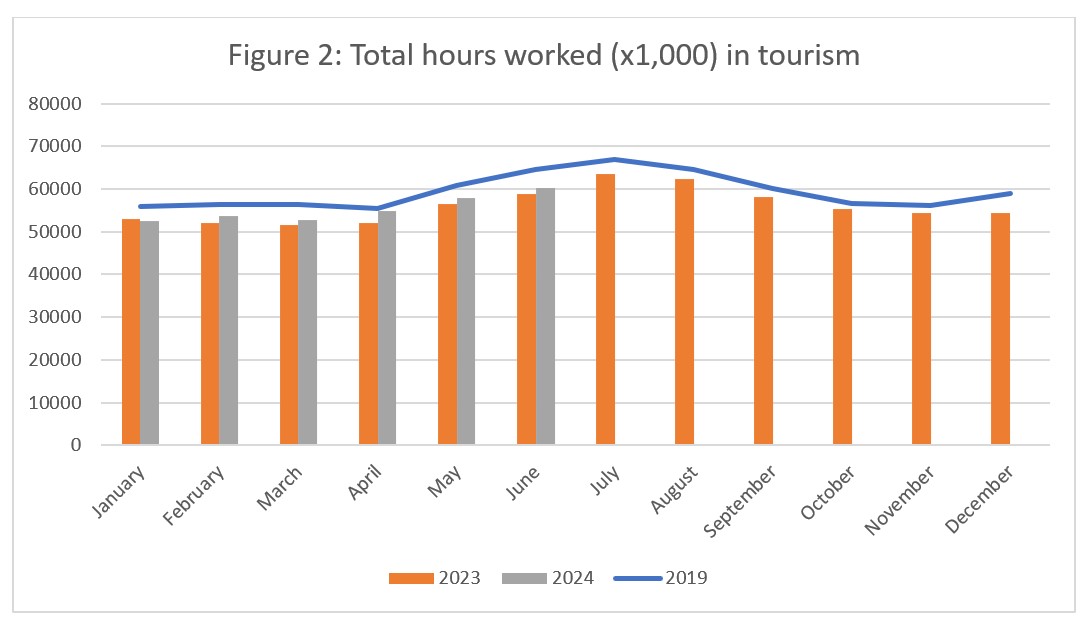
The total hours worked in June across the sector as a whole increased from May, although they remained substantially below 2019 levels. The gap between 2019 and 2024 has begun to widen again, beyond its narrowest point in April. The 2024 curve is continuing to closely parallel 2023, suggesting that we may be seeing a trend towards more workforce efficiency as the sector adjusts to a post-pandemic reality of smaller teams. That is to say, businesses are able to meet the needs of customers and of operational continuity with fewer overall work-hours; although this is speculative at this point (data beyond the LFS instrument would be needed to determine this), it is certainly a trend predicted by those who advocate for more widespread and wholesale adoption of assistive technologies and digital solutions to labour challenges. Longer-term monitoring of these patterns will be increasingly important in understanding the impact of artificial intelligence (AI) on employment in the tourism sector.
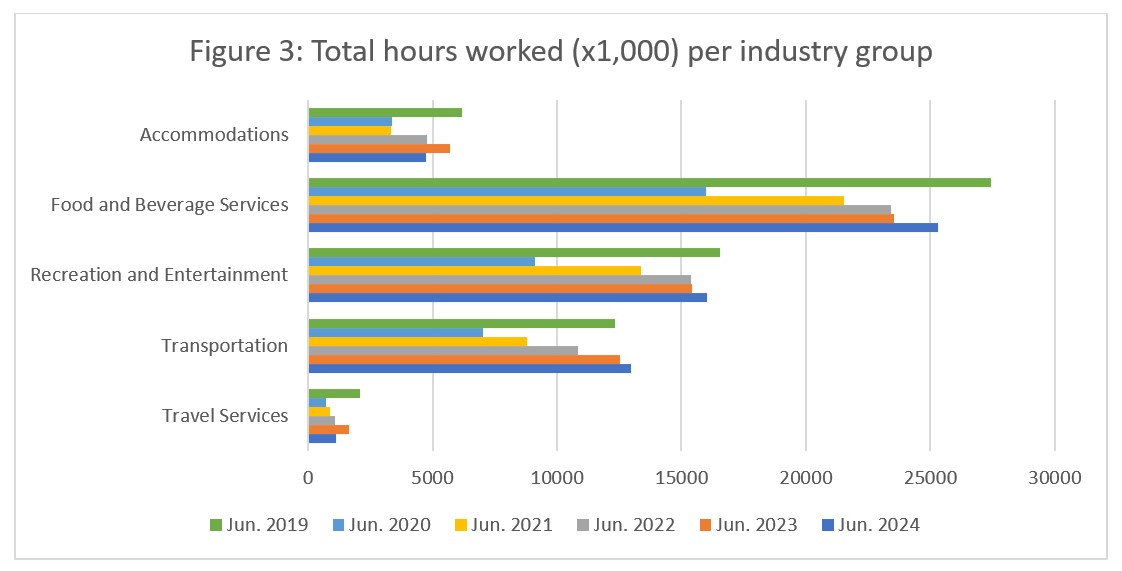
Figure 3 presents a year-over-year comparison of hours worked across the industry groups, starting in 2019. The number of hours worked in each industry group in June 2024 was lower than 2019 levels except in transportation, which saw an increase of around 5%. It is somewhat surprising that recreation and entertainment did not also show an increase in hours worked since 2019, given that it has seen stronger gains in terms of raw employment, although Figure 1 showed that there has been a substantial shift towards part-time employment in this industry group. Food and beverage services, recreation and entertainment, and transportation all saw increases over June 2023 in the total number of hours worked, which tallies with gains in employment. Similarly, the decrease in hours worked in accommodations from last year aligns with the loss in employment.
Unemployment
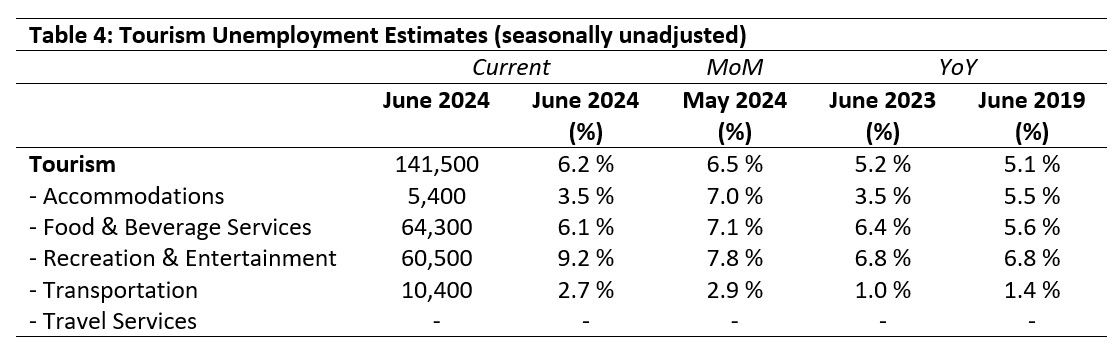
Unemployment[5] in the tourism sector in June 2024 was 6.2%, matching the national economy-wide average (calculated using seasonally unadjusted data). The sector saw over 140,000 people unemployed, a decrease of around 4,000 people in employment. Table 4 provides a summary of tourism unemployment in June.
May 2024: Month-over-Month
The sector unemployment rate fell by 0.3 percentage points from May. At the industry group level, unemployment rates fell most sharply in accommodations (-3.5 percentage points) and food and beverage services (-1 percentage point), while transportation saw a modest decline of 0.2 percentage points. In contrast, the unemployment rate increased by 1.4 percentage points in recreation and entertainment. No unemployment data was available for travel services.
June 2023 and 2019: Year-on-Year
Compared to June 2023, the sector unemployment rate was 1 percentage point higher, a difference largely attributable to an increase in transportation and in recreation and entertainment. Unemployment rates were generally higher than they were in 2019, with the exception of accommodations, which saw a 2 percentage point decrease. However, given the scale of labour force and employment changes since the pandemic, and the associated reconfiguration of the sector as businesses have adapted to the new environment, it is not surprising to find some systemic changes.
Provincial Tourism Unemployment
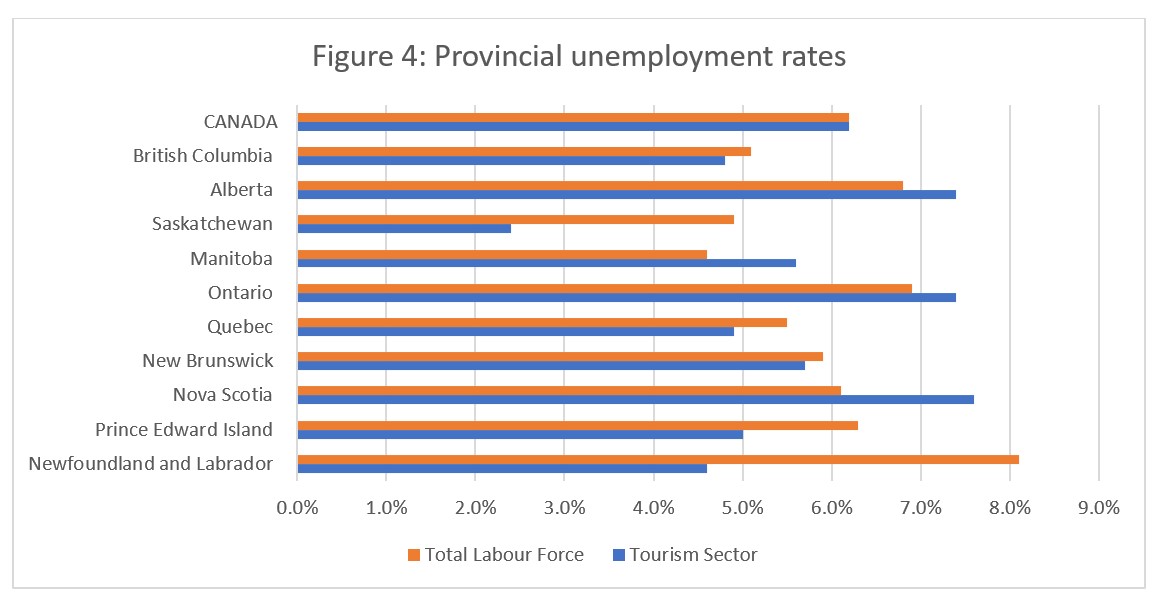
At the aggregate national level, the unemployment rate in tourism was tied with that of the total national economy (see Figure 4), and the range of regional variation has been reduced considerably from what was observed in spring and winter. Largely this is due to substantial decreases in tourism unemployment rates in the Atlantic provinces, where businesses and operations are clearly scaling their workforces back up in preparation for the summer season. The highest tourism unemployment rates were in Nova Scotia (7.6%) and in Ontario and Alberta (both at 7.4%), and the lowest rates were in Saskatchewan (2.4%) and Newfoundland and Labrador (4.6%). Tourism unemployment rates were lower than the aggregate provincial unemployment rates in Newfoundland and Labrador, Prince Edward Island, New Brunswick, Quebec, Saskatchewan, and British Columbia.
View more employment charts and analysis on our Tourism Employment Tracker.
[1] As defined by the Canadian Tourism Satellite Account. The NAICS industries included in the tourism sector those that would cease to exist or would operate at a significantly reduced level of activity as a direct result of an absence of tourism.
[2] SOURCE: Statistics Canada Labour Force Survey, customized tabulations. Based on seasonally unadjusted data collected for the period of June 9 to 15, 2024.
[3] The labour force comprises the total number of individuals who reported being employed or unemployed (but actively looking for work). The total Canadian labour force includes all sectors in the Canadian economy, while the tourism labour force only considers those working in, or looking for work in, the tourism sector.
[4] Employment refers to the total number of people currently in jobs. Tourism employment is restricted to the tourism sector, while employment in Canada comprises all sectors and industries.
[5] Unemployment is calculated as the difference between the seasonally unadjusted labour force and seasonally unadjusted employment estimates. The percentage value is calculated against the labour force.