Summer Employment Growth Led by Recreation and Entertainment, Accommodations
In spite of ongoing economic tensions between Canada and its largest trading partner, the Canadian tourism sector[1] in May 2025 saw promising growth over the previous month[2].
Although tourism is less directly impacted by tariffs than production sectors tend to be, it is sensitive to the disposable income of Canadians, which is beginning to be affected. It remains to be seen how profound that impact will be over the coming months, but this early indicator suggests that Canadians are still travelling, or planning to travel, domestically.
Overall, the sector was in a stronger position than it was last year, although there was more variability between industries than in the month-over-month comparison.
At the industry group level, gains in both labour force and employment were observed in all industries except for travel services. As we have noted previously, data on this industry tends to show more volatility than others, due to its small size relative to the total economy; while there is no doubt that this industry continues to struggle in its post-pandemic recovery, it is not clear that the estimates in the LFS are entirely reliable.
Table 1 provides a snapshot of the performance of tourism and each of its five industry groups across labour force, employment, and unemployment, as compared with April 2025 [MoM] and May 2024 [YoY], and with May 2019 as a pre-pandemic baseline. Small arrows represent changes of less than 1%, or less than one percentage point (pp) in the case of unemployment.
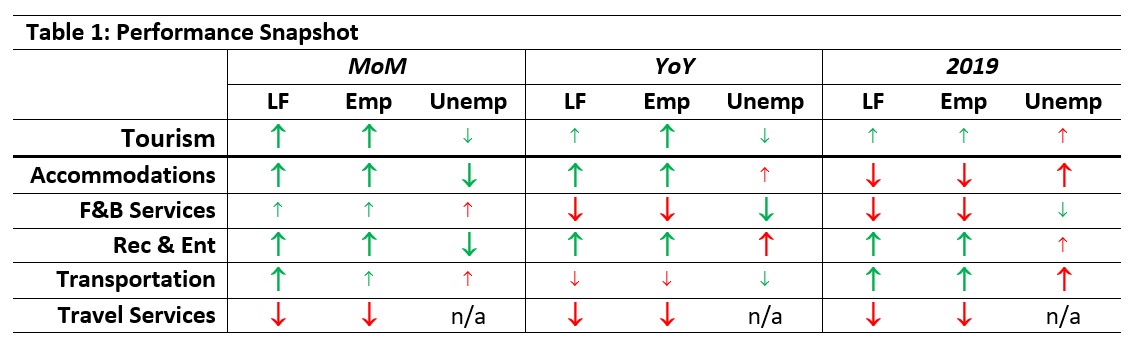
Labour force and employment grew from April for most industries, with the smallest gain seen in food and beverage services. Both indices remained below their levels from last year for this industry, suggesting that restaurants, bars, and cafes continue to struggle; economic analyses from Restaurants Canada[3] point to the economic stressors facing businesses in the face of falling consumer confidence and the end of the GST/HST holiday enacted early in the year. Accommodations has regained some of the ground lost last month, suggesting that April’s dip was perhaps an exaggeration of seasonal variation, and that the anticipated summer surge in demand is being met by the return of its seasonal workforce.
Most industries remained below 2019 levels, except for recreation and entertainment and transportation, which surpassed those levels quite a while ago.
Unemployment rates were generally lower in May than in April and higher than in May 2019, with year-over-year variability between industry groups.
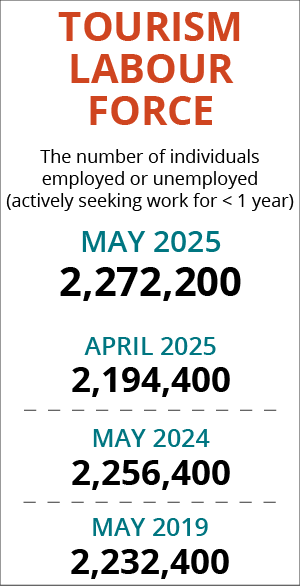
Tourism Labour Force
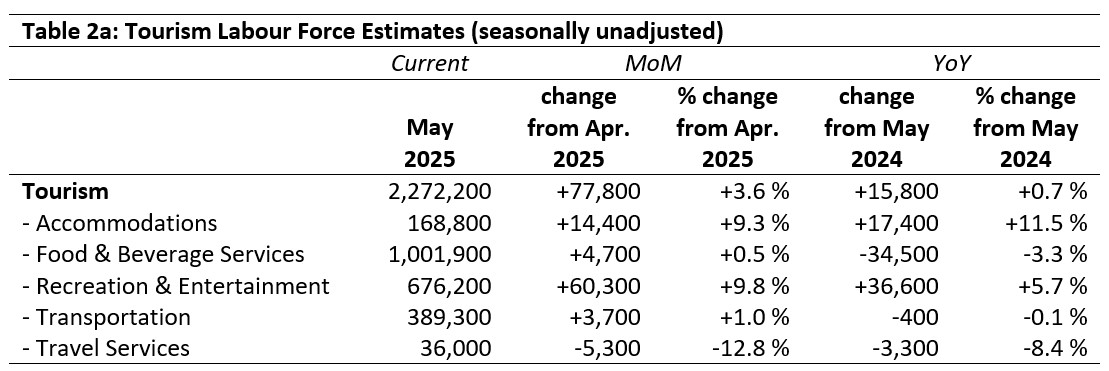
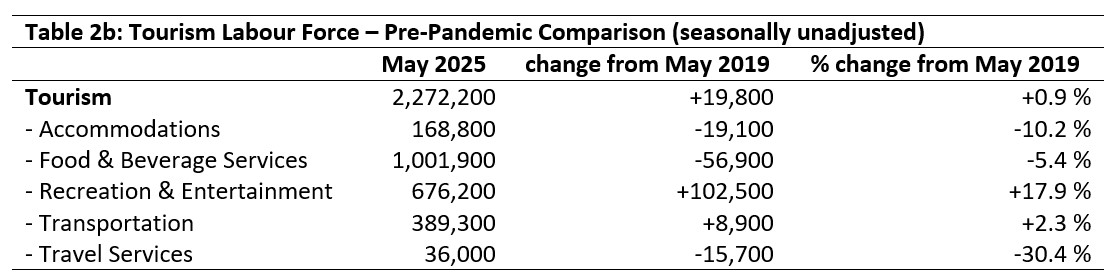
The tourism labour force[4] in May 2025 accounted for 10.0% of the total Canadian labour force, which was slightly higher than it was in April, slightly lower than it was last year, and around one percentage point below its share in 2019. The labour force reached 100.7% of its size last year, and 100.9% of its pre-pandemic scale. Tables 2a and 2b provide a summary of the tourism labour force as of May.
April 2025: Month-over-Month
The overall tourism labour force saw nearly 88,000 people added to the labour force, an increase of 3.6% from April. The largest gains were in recreation and entertainment, which alone saw over 60,000 people join the labour force (+9.8%), followed by accommodations which saw over 14,000 people enter the market (+9.3%). Food and beverage services and transportation saw much smaller gains, while travel services reported substantial losses. As noted previously, however, data on this industry group should be viewed cautiously.
May 2024: Year-on-Year
Relative to last May, the sector’s labour force saw only very slight gains, with a net growth of less than 1% (nearly 16,000 people). This resulted from strong gains in both recreation and entertainment and accommodations, countered by nearly 35,000 people leaving the food and beverage industry. Transportation was largely unchanged.
May 2019: Pre-Pandemic Baseline
At the sector level, the labour force was around 1% larger than it was in 2019, with nearly 20,000 people being added to the labour pool. This was entirely due to an 18% increase in recreation and entertainment (over 100,000 people), which countered substantial losses of 76,000 people from accommodations and food and beverage services, combined. Transportation also saw growth, albeit much smaller than recreation and entertainment.
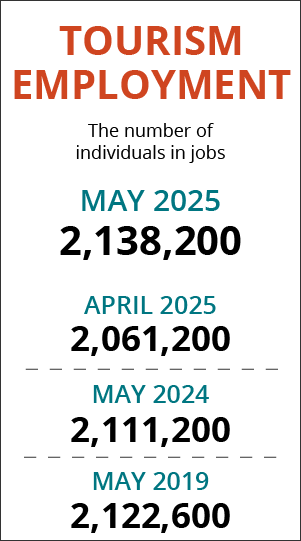
Tourism Employment
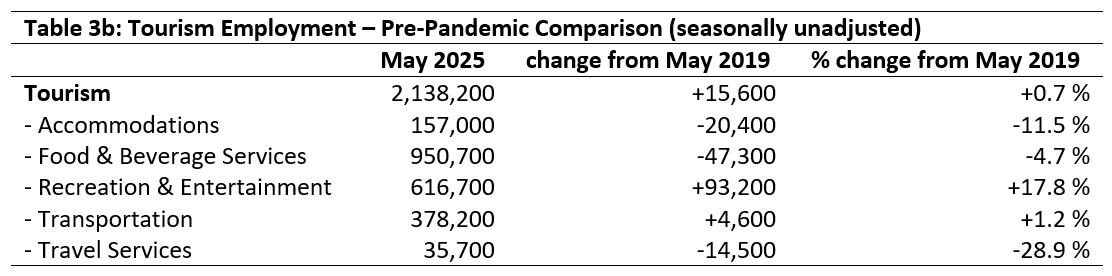
Tourism employment[5] accounted for 10.1% of all employment in Canada, and 9.4% of the total Canadian labour force was working in a tourism industry. Both ratios were slightly higher than they were in April, which is unsurprising given the start of the summer surge period. They were little changed from last year, and remained around one percentage point below 2019 levels. Tables 3a and 3b provide a summary of tourism employment as of May.
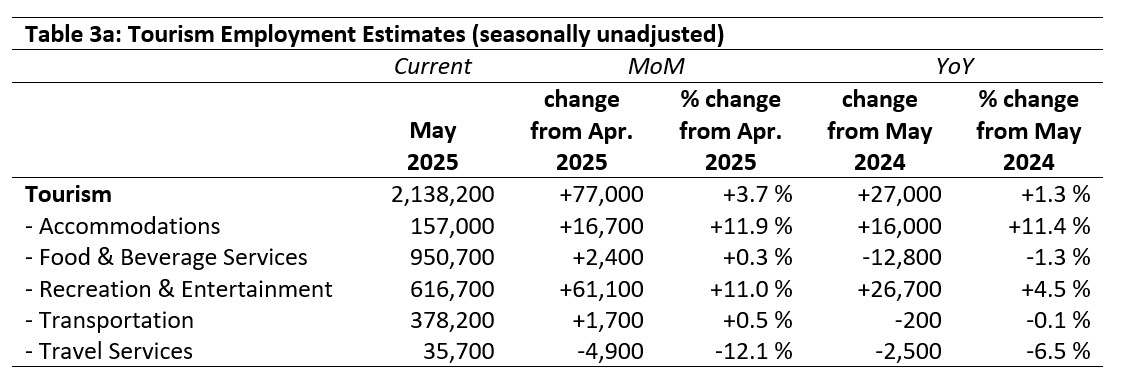
April 2025: Month-over-Month
Employment across the tourism sector grew by around 77,000 people from April, with all industries except travel services seeing gains. As with labour force, growth was biggest in recreation and entertainment and in accommodations, and much more modest in food and beverage services and transportation. Travel services remained depressed.
May 2024: Year-on-Year
The sector as a whole saw a net addition of 27,000 people taking up employment in tourism over the past year, led by gains in recreation and entertainment and accommodations. Food and beverage services lost nearly 13,000 workers, and transportation was largely unchanged. Travel services was still below last year’s size.
May 2019: Pre-Pandemic Baseline
Employment in tourism was slightly elevated relative to May 2019, with strong gains in recreation and entertainment compensating for substantial losses in accommodations, food and beverage services, and travel services. Transportation saw slight gains over the same period, but the workers added to the sector were almost entirely due to the continued growth of recreation and entertainment.
Part-time vs. Full-time Employment
The ratio of part-time to full-time work provides interesting insights into the stability of the workforce, and may signal long-term trends towards new working arrangements, with respect to both the post-pandemic readjustment and to the more recent economic uncertainty amid trade tensions with the USA. Figure 1 provides an overview of the percentage of part-time employment across the industry groups, using Statistics Canada’s definition of full-time employment (working 30 hours or more per week).
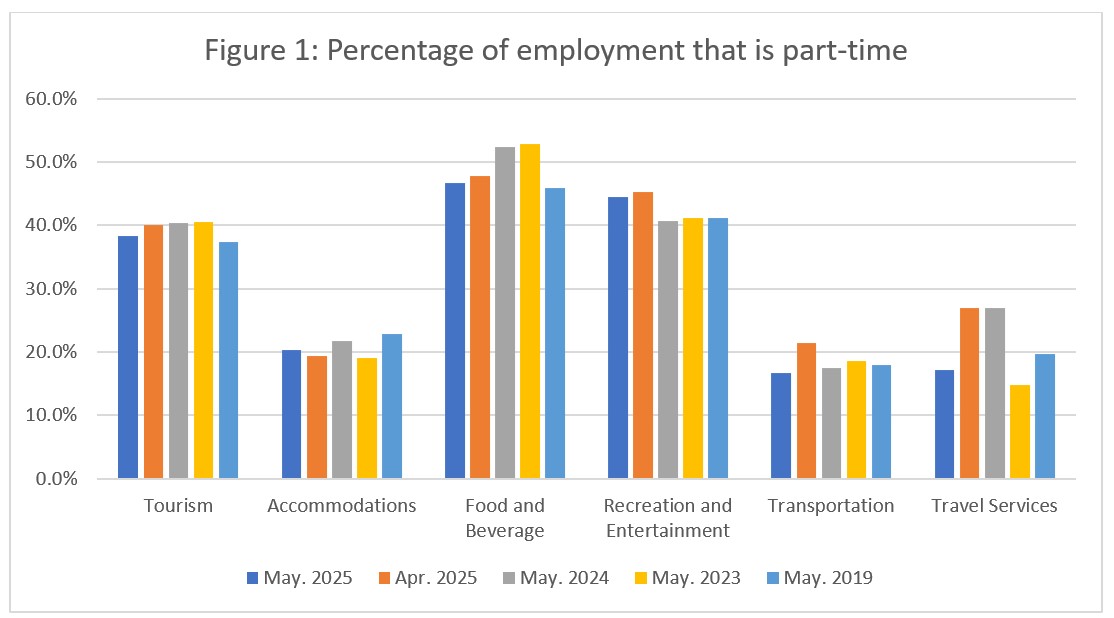
The overall ratio of part-time tourism employment fell slightly from April and was lower than it was both last year and in May 2023; however, it was slightly higher than it was in 2019 (by one percentage point). The month-over-month change is likely attributable to post-secondary students increasing their part-time hours to full-time without changing their employment status.
Accommodations saw a slight increase in part-time employment from April, but the share of part-time work was lower than it was one year ago and before the pandemic. Food and beverage services saw a slight drop from April, and a much more substantial decrease in part-time work from the previous two years; with employment numbers remaining sluggish, this indicates people working more hours as demand increases. Recreation and entertainment likewise saw a slight decrease in part-time work from April, although the ratio remains around three percentage points higher than it has been in recent years; its surge in employment does not reflect a surge in full-time employment, although that is likely due to the nature of work in this industry. The share of part-time employment fell in transportation from April, and remained slightly lower than it has been over the past few years; closer examination of the data indicates that the bulk of the decrease in part-time employment occurred in taxi and limousine service (which includes ride-share companies) and in scheduled air transportation. Travel services reported a dramatic decrease from last month in part-time employment, but this is likely a reflection of data sampling; the May 2025 data is more comparable to that of 2019 than to last month, so it is more likely that the April data was distorted than the May data.
Hours Worked
Another useful metric to assess the stability of the labour market is the total hours worked (see Figure 2), as this index can be more immediately responsive to shifts in consumer demand that raw employment figures alone. Given ongoing trade tensions and their inevitable economic consequences, this is potentially a better reflection of short-term shifts in employment conditions than other indices, although raw counts provide a more stable sense of scale.
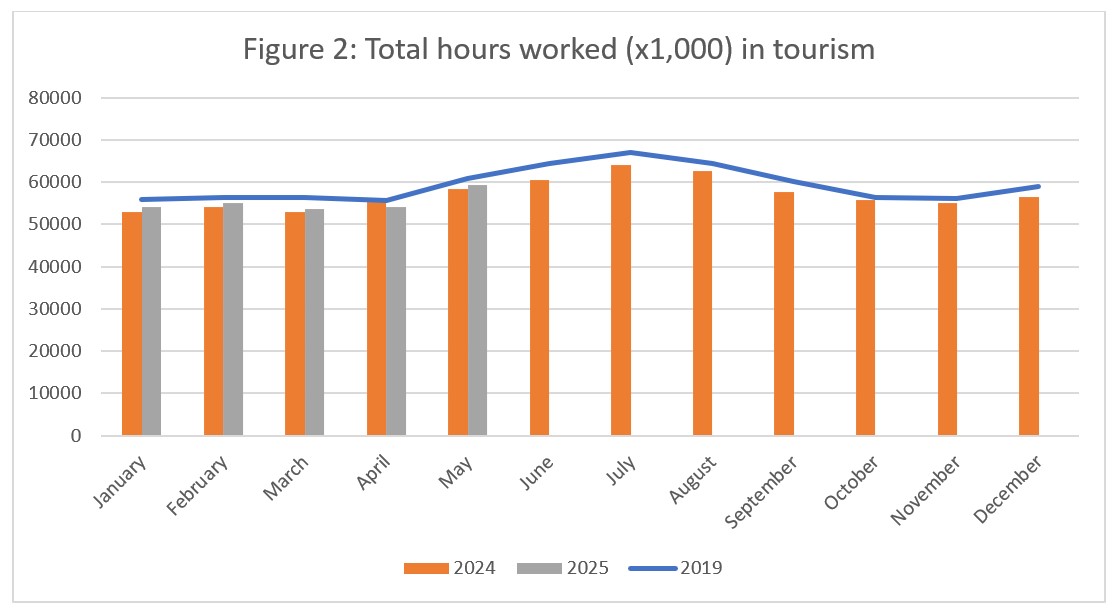
Total hours worked in tourism grew by around 10% from April (see Figure 2), a substantially larger increase than that seen in employment, so some workers must have increased their hours as well as businesses hiring more staff. Hours worked were also higher than last May, reversing the dip noted in April; however, they remain below 2019 levels, suggesting that in spite of an overall recovery in employment, the sector is still below its pre-pandemic performance.
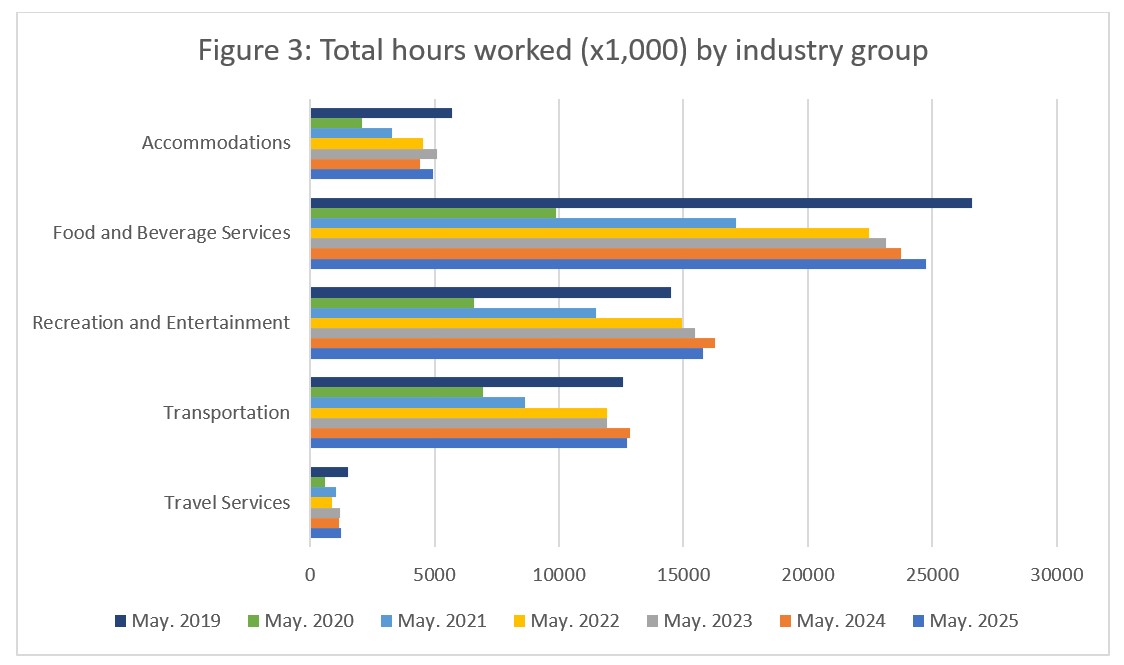
At the industry group level (see Figure 3), the year-on-year perspective shows an inconsistent trajectory of recovery. The most straightforward has been food and beverage services, which has slowed somewhat from its early regrowth but has been consistent in its year-over-year increase. Hours worked in recreation and entertainment have also increased fairly steadily, but fell slightly from last year; in transportation, growth stalled in 2022 and 2023, restarted again in 2024, and fell in 2025. The pattern is similar to what was noted in accommodations, and although hours worked increased over the past year, they nevertheless remain substantially lower than they were in 2019. Hours worked in travel services increased overall in the past six years, but the trajectory has been less consistent year-to-year.
Unemployment
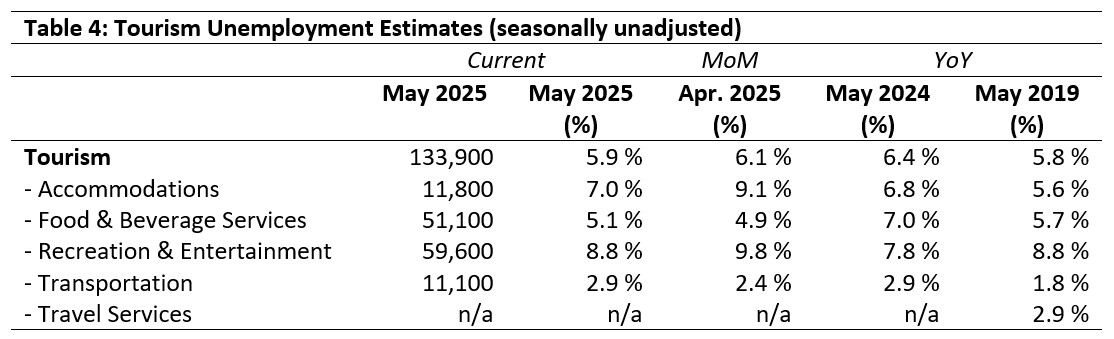
The unemployment rate[6] in the tourism sector in May 2025 was 5.9%, around 1.1 percentage points lower than the national economy-wide average rate (7.0%, calculated using seasonally unadjusted data). The tourism unemployment rate fell slightly from April (-0.2 percentage points), while the economy-wide unemployment rate held steady. Table 4 provides a summary of the national unemployment rates across the tourism sector.
April 2025: Month-over-Month
Around 134,000 people were unemployed in the tourism sector in May, with an unemployment rate of nearly 6%. The bulk of these were in food and beverage services and recreation and entertainment, although the unemployment rate actually fell from April by a full percentage point in recreation and entertainment, while it drifted up slightly in food and beverage services. The unemployment rate in accommodations also came down by a full two percentage points in the past month, while that in transportation increased by around 0.5 percentage points.
May 2024, 2019: Year-on-Year
For the most part, unemployment rates were not markedly different than they were one year ago. The largest changes were in food and beverage services (-1.9 percentage points) and recreation and entertainment (+1.0 percentage points), resulting in an overall drop of 0.5 percentage points at the sector level. The unemployment rate in accommodations was 1.4 percentage points higher this May than it was in 2019, but there was little difference in the other industry groups.
Provincial Tourism Unemployment
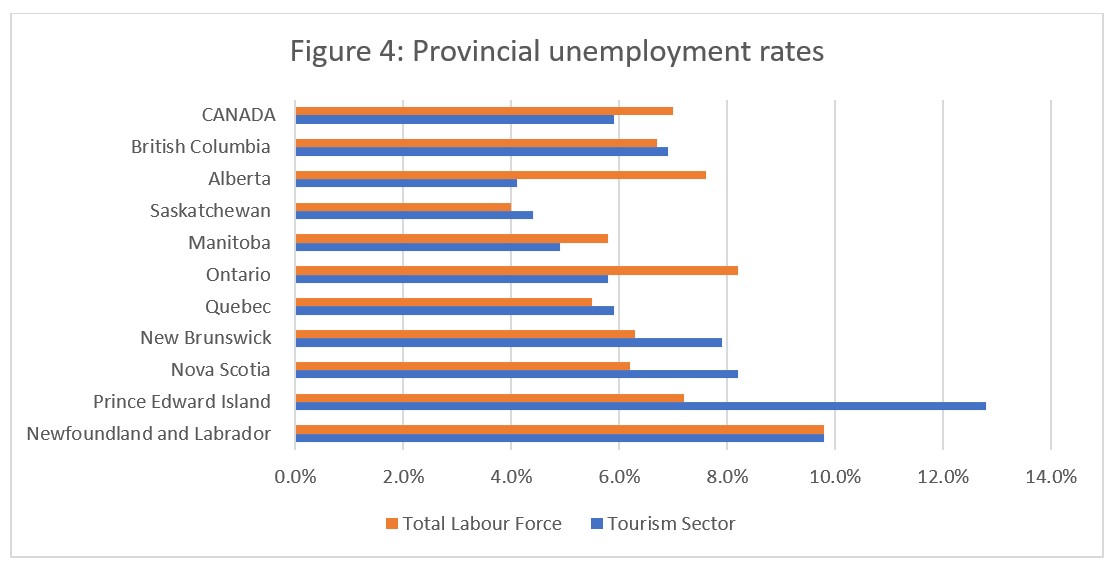
At the aggregate national level, the unemployment rate in tourism was lower than that of the national economy-wide average (see Figure 4), a pattern which held true only in Alberta, Manitoba, and Ontario. In the other provinces, tourism unemployment rates were higher than those of their economy-wide counterparts, except for Newfoundland and Labrador where the rates were equal. The differences were particularly pronounced in the Maritimes (tourism unemployment rates higher than across the broader economy, although the effect was less pronounced than it was earlier in the year), and in Alberta and Ontario (tourism unemployment rates lower than across the broader economy). The tourism unemployment rates in May were highest in Prince Edward Island (12.8%) and Newfoundland and Labrador (9.8%), and were lowest in Alberta (4.1%) and Saskatchewan (4.4%).
View more employment charts and analysis on our Tourism Employment Tracker.
[1] As defined by the Canadian Tourism Satellite Account. The NAICS industries included in the tourism sector those that would cease to exist or would operate at a significantly reduced level of activity as a direct result of an absence of tourism.
[2] SOURCE: Statistics Canada Labour Force Survey, customized tabulations. Based on seasonally unadjusted data collected for the period of May 11 to 17, 2025.
[3] See various editions of Economist’s Notebook on the Restaurants Canada website.
[4] The labour force comprises the total number of individuals who reported being employed or unemployed (but actively looking for work). The total Canadian labour force includes all sectors in the Canadian economy, while the tourism labour force only considers those working in, or looking for work in, the tourism sector.
[5] Employment refers to the total number of people currently in jobs. Tourism employment is restricted to the tourism sector, while employment in Canada comprises all sectors and industries.
[6] Unemployment is calculated as the difference between the seasonally unadjusted labour force and seasonally unadjusted employment estimates. The percentage value is calculated against the labour force.