Tourism Labour Force and Employment Slow in March
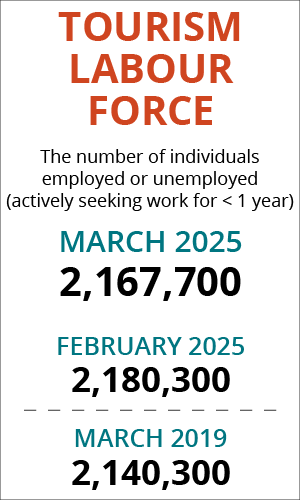
The tourism sector[1] in March 2025 contracted slightly from the previous month[2], across both labour force and employment. Both indices were higher than they were last year (+2.1% and +3.0%, respectively), and around 1% higher than in March 2019.
It is unlikely that the effects of ongoing geopolitical and economic instability were exerting much of an effect on this data, as tariffs and retaliatory measures were either not fully implemented yet in the data collection week (March 9 to 15), or they were too new for their knock-on effects to be noticeable in data of this type. The next several months will be interesting for the sector, and there are too many moving parts to be able to make any confident predictions about what we will see. It is unlikely that tourism will emerge unaffected by the larger economic and social changes yet to come—we just don’t yet know what those effects will be.
There was more variability at the industry level, with gains in accommodations and transportation only slightly offsetting losses in food and beverage services and recreation and entertainment (and to a lesser extent, in travel services, although the reliability of data pertaining to this industry group remains uncertain).
Table 1 provides a snapshot of the performance of tourism and each of its five industry groups across labour force, employment, and unemployment, as compared with February 2025 [MoM] and March 2024 [YoY], and with March 2019 as a pre-pandemic baseline. Small arrows represent changes of less than 1%, or less than one percentage point (pp) in the case of unemployment.
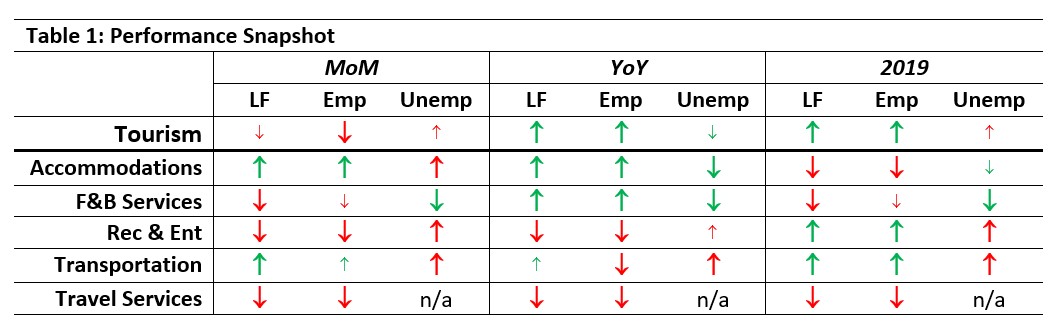
Although there was an overall decrease from February, the picture was more positive over a longer period, showing gains relative to last year and to March 2019. Accommodations and food and beverage services saw growth over the past twelve months, as well as falling unemployment rates, while recreation and entertainment and transportation pulled the sector up over the overall pre-pandemic baseline estimates from March 2019. It is encouraging to see improvements in the labour market in accommodations, which has seen its share of challenges over the past few years, but it is too soon to know whether this represents long-term changes or if these trends are shorter-term fluctuations.
Tourism Labour Force
The tourism labour force[3] in March 2025 accounted for 9.7% of the total Canadian labour force, which was only a slight change (-0.1 percentage point) from February, was on par with last year, and was a full percentage point below March 2019. The labour force reached 102% of its size 12 months ago, and 101% of its size before the pandemic. Tables 2a and 2b provide a summary of the tourism labour force as of March.

February 2025: Month-over-Month
The overall tourism labour force in March saw a slight decrease from February, with nearly 13,000 people leaving the labour pool. The largest losses were seen in food and beverage services and in recreation and entertainment, while accommodations saw over 14,000 people enter the industry’s labour force, and transportation added over 8,000 people. The estimate for travel services, although not necessarily very accurate, suggests a slight-to-moderate month-over-month decrease.
March 2024: Year-on-Year
Relative to last March, the sector’s labour force grew by just over 2%, seeing a balance of around 44,000 people enter the tourism labour pool over the past 12 months. Most industries saw new entrants, led by food and beverage services, which saw over 45,000 people added. Recreation and entertainment saw a loss of around 9,000, while travel services saw very little change.
March 2019: Pre-Pandemic Baseline
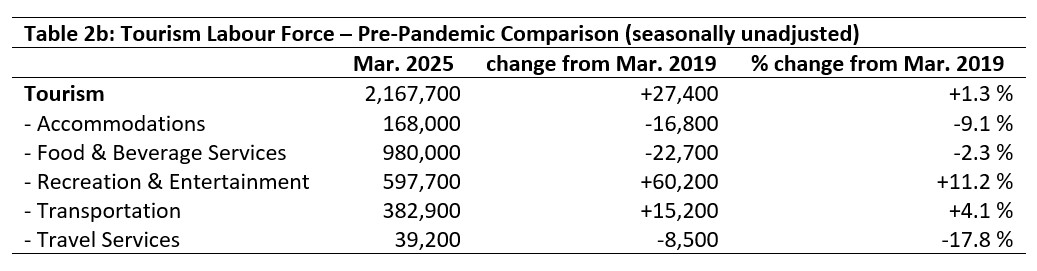
At the sector level, the labour force saw a net gain of around 27,000 people since March 2019, although that overall figure of course masks enormous fluctuations over that time period. Only transportation and recreation and entertainment saw growth at the industry level, with recreation and entertainment’s increase particularly large (60,000 people, representing around 11% growth). In contrast, accommodations remained around 9% below its pre-pandemic baseline, as did travel services (although, as noted, that data is not necessarily entirely reliable).
Tourism Employment
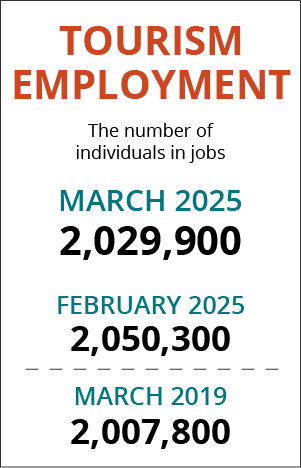
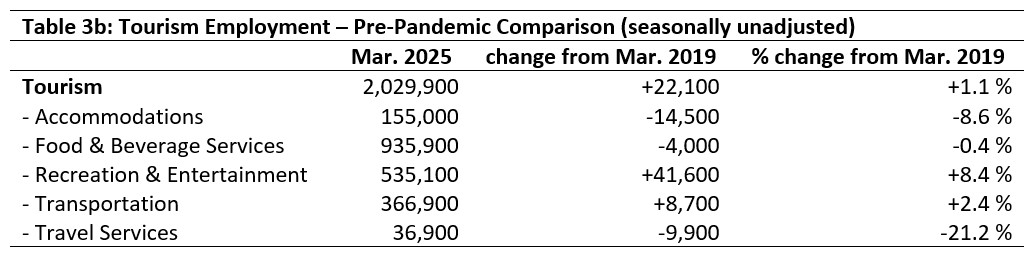
Tourism employment[4] accounted for 9.8% of all employment in Canada, and 9.1% of the total Canadian labour force was working in a tourism industry. Both figures were 0.1 percentage points lower than they were in February. Tourism employment as a share of all Canadian employment was slightly higher this year than last (+0.1 percentage points), and higher than in March 2019 (+0.2 percentage points). The share of the Canadian labour force working in tourism was comparable to last year, but a full percentage point below pre-pandemic levels. Tables 3a and 3b provide a summary of tourism employment as of March.
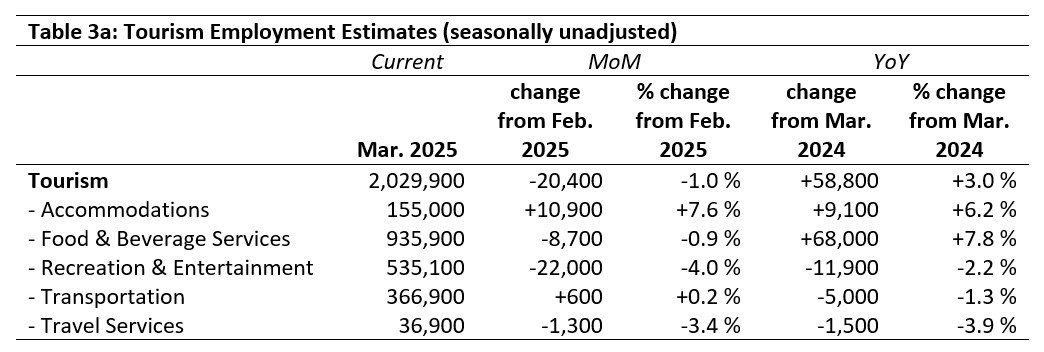
February 2025: Month-over-Month
As with labour force, employment in March fell from February, with around 20,000 workers leaving the sector. The bulk of this loss was in recreation and entertainment, while accommodations saw around 8% growth (adding nearly 11,000 new employees over the past month). Food and beverage services saw modest shifts, and transportation was virtually unchanged.
March 2024: Year-on-Year
At the sector level, employment rose from last year by nearly 60,000 workers (+3%). This aggregate consists of strong gains in food and beverage services and in accommodations, offset by losses in recreation and entertainment and in transportation.
March 2019: Pre-Pandemic Baseline
The sector saw overall growth of around 1% compared with 2019, consistent with the first two months of the year, suggesting that the sector has broadly returned to pre-COVID levels of employment. Given the many political, social, and economic uncertainties facing Canada, North America, and the world over the next several months, it is too soon to say what employment over the summer will look like, but this does indicate that orienting to 2019 as a comparative baseline is not necessarily the most productive perspective moving forward.
As with labour force, the current gains were driven by transportation and by recreation and entertainment, while the other industries either saw substantial decreases or held more or less steady.
Part-time vs. Full-time Employment
The ratio of part-time to full-time work can provide insight into the stability of the workforce, and may signal long-term trends towards new working arrangements in a changing world, particularly at the industry level. Figure 1 provides an overview of the percentage of part-time employment across the industry groups, using Statistics Canada’s definition of full-time employment (working 30 hours or more per week). It is too soon to know what the long-term implications of current economic and political tensions will have on the workforce, but the ratio of part-time to full-time work may be one of the early warning signs of system-wide disruption across the sector.
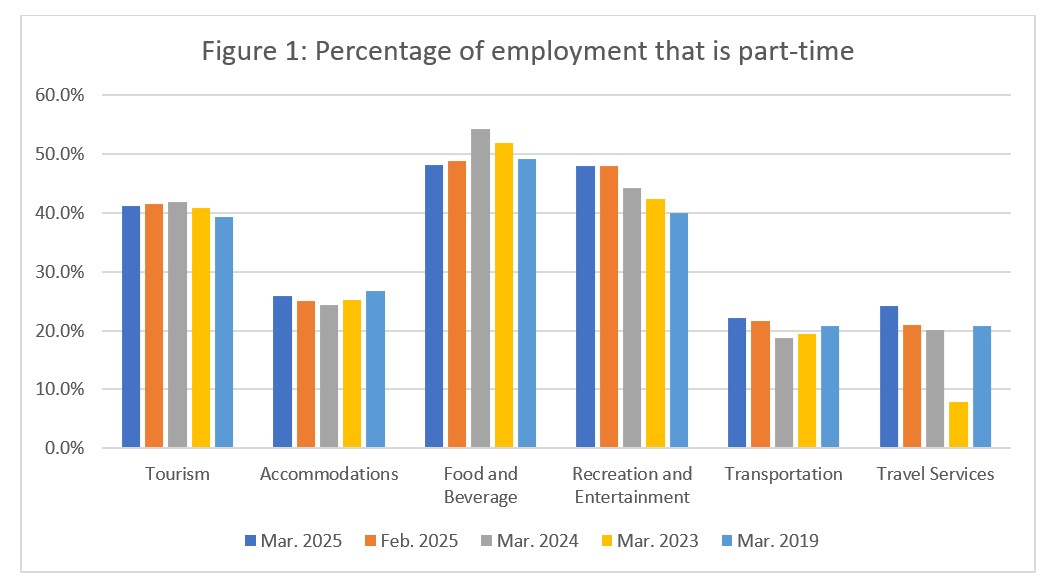
The part-time share of employment in tourism was essentially unchanged from February, and comparable to that seen over the past few years. Food and beverage services has seen a return to a more typically pre-pandemic rate of part-time employment after climbing to unusually high levels last year. The part-time to full-time ratio in recreation and entertainment has seen a steady increase, with a shift of 8 percentage points towards part-time work from March 2019. Transportation and accommodations both saw slight dips last year, but have largely returned to previous patterns, with accommodations sitting around 1 percentage point below where it was in 2019, and transportation just over 1 percentage point higher. Travel services saw a jump of around 3 percentage points from February, but as noted previously, data for this industry group should be taken with a degree of caution due its small size in relation to the Labour Force Survey sampling methods.
Hours Worked
Another useful metric to assess the stability of the labour market is the total hours worked (see Figure 2), as this index is likely more responsive to short-term shifts in tourism demand than raw employment figures alone. It is easier for businesses to increase hours across their current roster of employees than it is for them to rescale their workforce, so an increase in customer demand will correlate with an increase in hours worked, particularly in industries that rely on a large share of part-time workers. This will likely be another early-warning system for large-scale disruption to the sector, although it is too early in the current slate of changes for an effect to be noticeable.
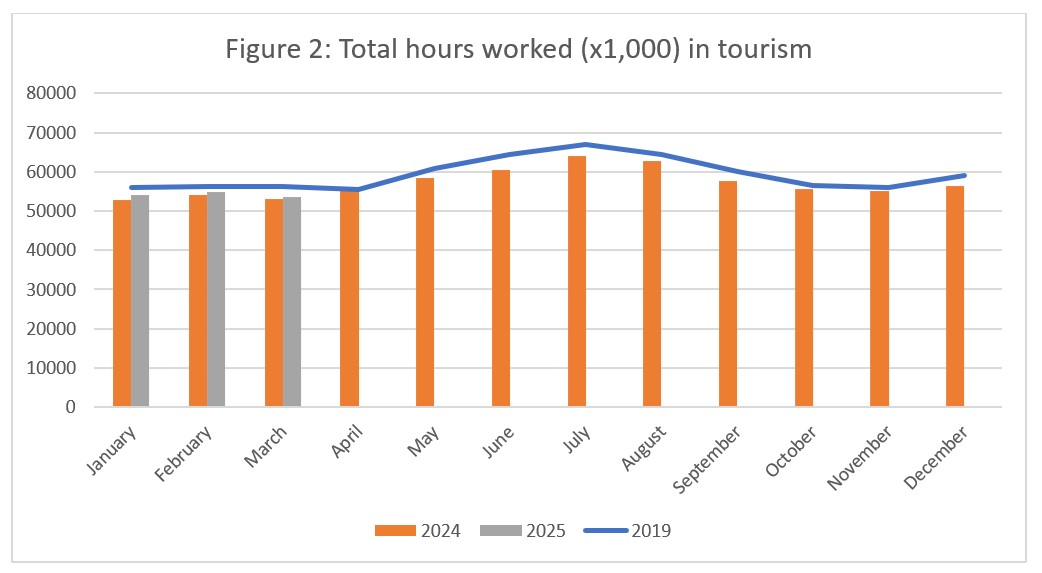
Hours worked at the sector level in March continued to surpass last year’s total, but remained below 2019 levels. The close parallel with the 2023 pattern suggests that we may expect to see a bump in April, but the volatility of the socio-political realities of 2025 make any such predictions unreliable.
At the industry group level (see Figure 3), the year-on-year perspective shows that food and beverage services saw a substantial increase from last year (around +14%), while recreation and entertainment saw a substantial decrease (around -15%). These figures align with earlier observations about year-over-year employment changes. Both food and beverage services and transportation have nearly returned to pre-pandemic levels, and although recreation and entertainment surged past this benchmark last year, this March it fell below the threshold again. Accommodations saw a slight decrease in hours worked from last year, but has broadly continued the monotonic growth trajectory from its lowest point in 2020. Indeed, most industries have generally continued to ramp up their hours worked since 2020, although the road has not always been a smooth one. Travel services has been gradually decreasing its hours worked from 2023.

Unemployment
The unemployment rate[5] in the tourism sector in March 2025 was 6.4%, around 0.7 percentage points below the national economy-wide average (7.1%, calculated using seasonally unadjusted data); both unemployment rates grew by around 0.4 percentage points from February. Table 4 provides a summary of the national unemployment rates across the tourism sector.
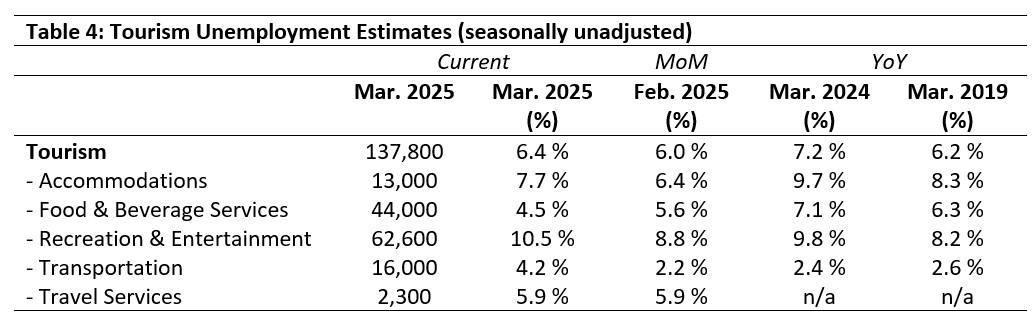
February 2025: Month-over-Month
The unemployment rate in March rose slightly from February, in step with broader economic trends. There were around 7,700 newly unemployed people across the sector, with the largest increases seen in recreation and entertainment and transportation; both industries saw increases in their unemployment rates as well as in the raw numbers. In contrast, food and beverage services saw a decline of around 12,000 unemployed people, largely attributable to people leaving the industry altogether (labour force losses). The increase in accommodations is likely a product of growth in labour force outpacing that in employment for this industry group.
March 2024, 2019: Year-on-Year
The tourism unemployment rate in March was lower than it was last year and slightly higher than it was in 2019, but these sector-level shifts were all within one percentage point, indicating that unemployment is relatively stable in the long run. Whether that remains the case is an open question, however, given the economic uncertainty facing the country. While the tourism sector may gain workers through job losses in other sectors in the face of tariffs and their economic consequences, the sector’s ability to absorb those workers will depend on tourism demand—which is also impacted by economic conditions. We can expect unemployment figures and rates to shift over the next several months, but hopefully not to the extent that we saw during the pandemic.
Provincial Tourism Unemployment
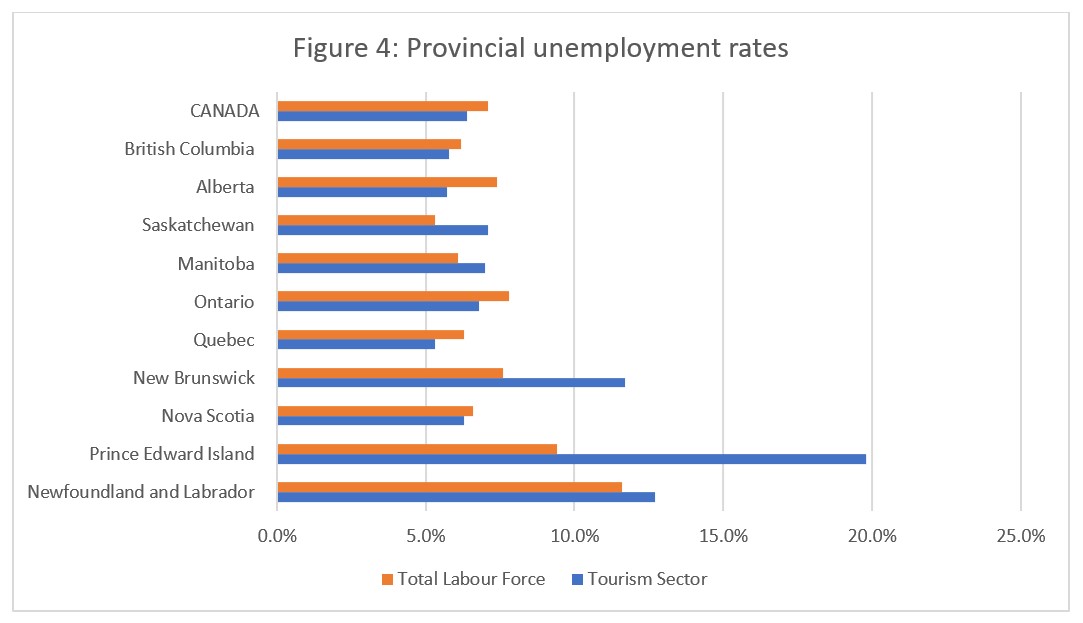
At the aggregate national level, the unemployment rate in tourism was lower than that of the national economy-wide average (see Figure 4), a pattern which held for many provinces. As is often the case at this time of year, the Atlantic provinces (except for Nova Scotia) had high levels of tourism unemployment, in some instances far outstripping provincial economy-wide rates. In Saskatchewan and Manitoba, tourism unemployment rates were also higher than those of the entire economy. Tourism unemployment rates were highest in Prince Edward Island (19.8%) and Newfoundland and Labrador (12.7%), and lowest in Quebec (5.3%) and Alberta (5.7%).
View more employment charts and analysis on our Tourism Employment Tracker.
[1] As defined by the Canadian Tourism Satellite Account. The NAICS industries included in the tourism sector those that would cease to exist or would operate at a significantly reduced level of activity as a direct result of an absence of tourism.
[2] SOURCE: Statistics Canada Labour Force Survey, customized tabulations. Based on seasonally unadjusted data collected for the period of March 9 to 15, 2025.
[3] The labour force comprises the total number of individuals who reported being employed or unemployed (but actively looking for work). The total Canadian labour force includes all sectors in the Canadian economy, while the tourism labour force only considers those working in, or looking for work in, the tourism sector.
[4] Employment refers to the total number of people currently in jobs. Tourism employment is restricted to the tourism sector, while employment in Canada comprises all sectors and industries.
[5] Unemployment is calculated as the difference between the seasonally unadjusted labour force and seasonally unadjusted employment estimates. The percentage value is calculated against the labour force.