Ahead of Difficult Times, Tourism Growth Slows
The Canadian economy faces a rocky road ahead, in the face of unprecedented disruptions to the geopolitics of North America, and indeed around the world. The impacts that the coming changes will have on tourism are hard to predict: on the one hand, the value of the Canadian dollar relative to international currencies makes us an attractive destination, but social sentiment and political action may drive visitors towards other destinations, while financial turmoil may limit domestic travel.
Tourism’s ability to deliver service excellence is equally subject to demand pressures (visitor spending that drives businesses’ capacity to offer employment in their communities) as it is to labour pressures (access to a pool of skilled workers able to take up those jobs), both of which will likely fluctuate in the coming months.
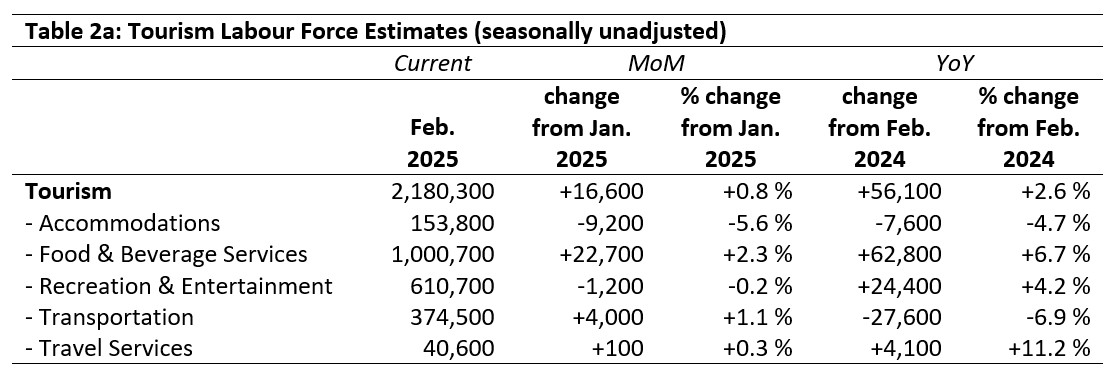
In February 2025, the tourism sector[1] saw slight growth over the previous month[2], largely buoyed by gains in food and beverage services, and offset by losses in accommodations. At the sector level, both labour force and employment were comfortably higher than last year (+2.6% and +3.0%) and slightly higher than in 2019.
At the industry group level, there was some volatility from January, with net gains across the sector of under one percent on both labour force and employment. Things were rosier in the longer time frame, showing more marked growth across both indices, although accommodations has continued to struggle, remaining consistently in a more vulnerable position in such a rapidly changing labour market. Data pertaining to travel services continues to carry a note of caution: while we are able to see some broad trends, the specifics of the estimates are likely being distorted by the small sample size.
Table 1 provides a snapshot of the performance of tourism and each of its five industry groups across labour force, employment, and unemployment, as compared with January 2025 [MoM] and February 2024 [YoY], and with February 2019 as a pre-pandemic baseline. Small arrows represent changes of less than 1%, or less than one percentage point (pp) in the case of unemployment.
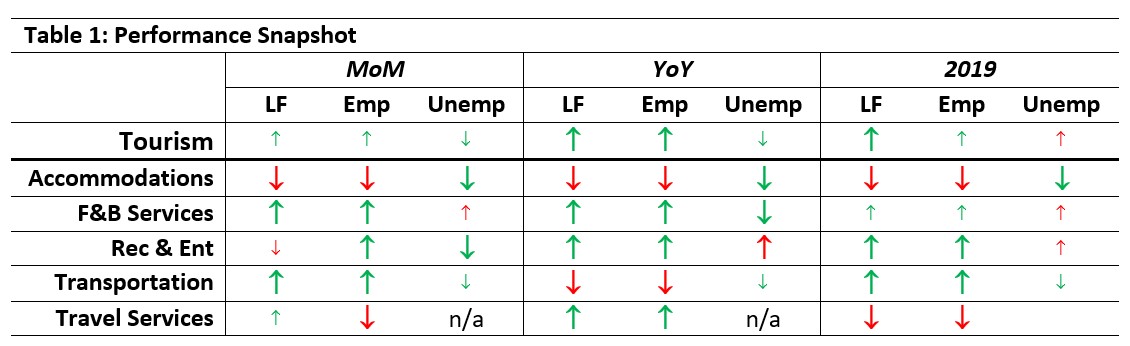
Growth from January was slight at the sector level, reflecting tension between gains in food and beverage services and transportation, and losses in other industries. Food and beverage services and recreation and entertainment saw strong growth over last year, while transportation saw losses on both labour force and employment. Labour force overall had reached 102.6% of 2019 levels, while employment nudged to 103%.
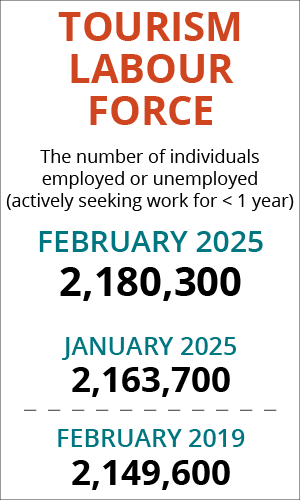
Tourism Labour Force
The tourism labour force[3] in February 2025 accounted for 9.8% of the total Canadian labour force, which is very slightly higher than in January (+0.1 percentage points). The labour force reached 102.6% of its size in February 2024, and edged past its pre-pandemic levels (+1.4 percentage points). Tables 2a and 2b provide a summary of the tourism labour force as of February.
January 2025: Month-Over-Month
The overall tourism labour force grew by over 16,000 people from January, an increase of slightly less than one percent. This was chiefly down to growth in food and beverage services, which added nearly 23,000 people to its own pool of available workers (+2.3%). Transportation saw more modest gains (4,000, +1.1%), while accommodations lost over 5% of its labour force. Recreation and entertainment and travel services were largely unchanged.
February 2024: Year-On-Year
Relative to last February, the sector’s labour force had gained around 56,000 people, the bulk of which were in food and beverage services (+6.5%, nearly an additional 63,000 people) and recreation and entertainment (+4.2%, 24,000 people). Transportation was nearly 7% below its 2024 level, and accommodations was nearly 5% below as well. Travel services showed growth of over 10%, but this may be a product of the sampling.
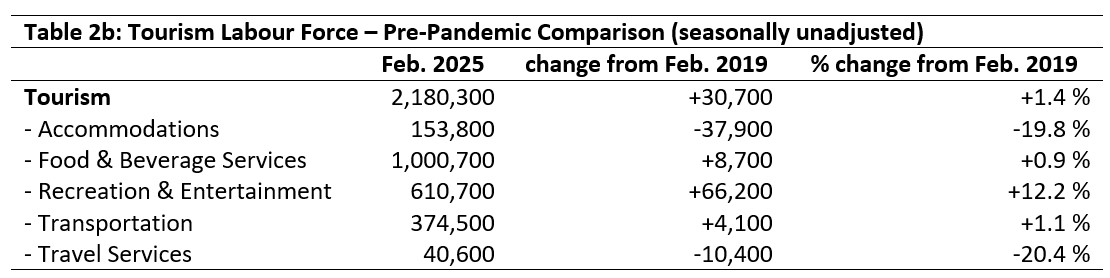
February 2019: Pre-pandemic Baseline
At the sector level, tourism’s labour force edged past 2019 levels by just over 30,000 people, an increase of 1.4%. Accommodations and travel services remained the most depressed, with both around 20% below where they were six years ago. The absolute loss of workers in accommodations, likely more reliable than that noted in travel services, was nearly 38,000. Recreation and entertainment has seen the largest gains, at around 12%, representing 66,000 people available or looking for work in that industry.
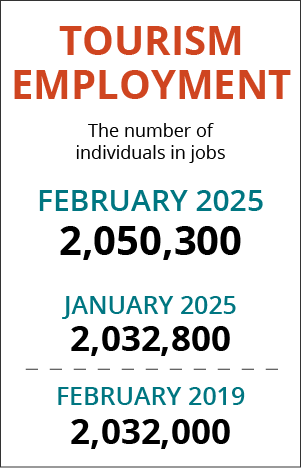
Tourism Employment
Tourism employment[4] accounted for 9.9% of all employment in Canada, and 9.2% of the total Canadian labour force was working in a tourism industry. Both figures are very slightly higher than in January (+0.1 percentage point). Tourism employment as a share of all employment in Canada was slightly higher than in February 2019, but tourism employment as a share of the total Canadian labour force remained a full percentage point below pre-pandemic levels. Tables 3a and 3b provide a summary of tourism employment as of February.
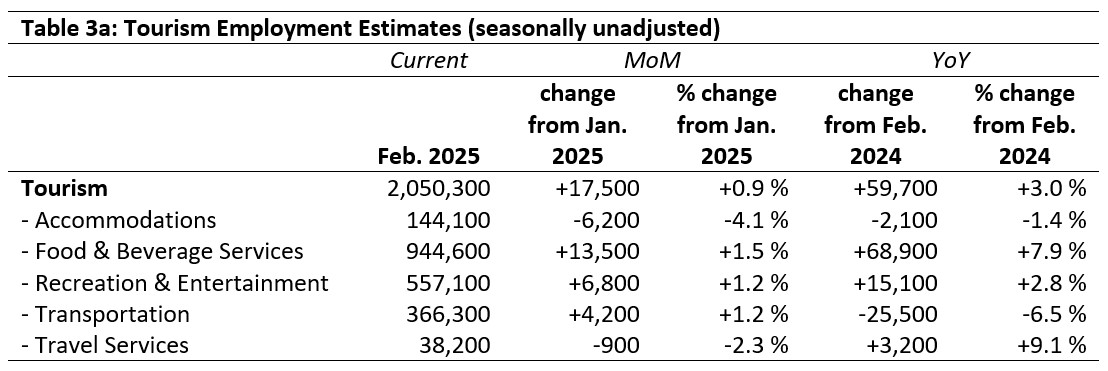
January 2024: Month-Over-Month
Tourism employment in February saw a slight elevation from January, particularly in food and beverage services, which saw over 13,000 people start working in the industry. Recreation and entertainment (+6,800) and transportation (+4,200) likewise saw slight increases, while accommodations saw a decrease of around 4% month-over-month, a loss of over 6,000 workers.
February 2024: Year-On-Year
Relative to one year ago, employment in the sector was 3% higher, with a net gain of nearly 60,000 people. The bulk of this growth was in food and beverage services, which alone saw nearly 69,000 people take up jobs. Recreation and entertainment also added around 15,000 workers, while transportation saw substantial losses: 25,500 people left the industry, a loss of 6.5%. Accommodations saw smaller losses, but continued the general trend of lost workers that we have been seeing in recent months.
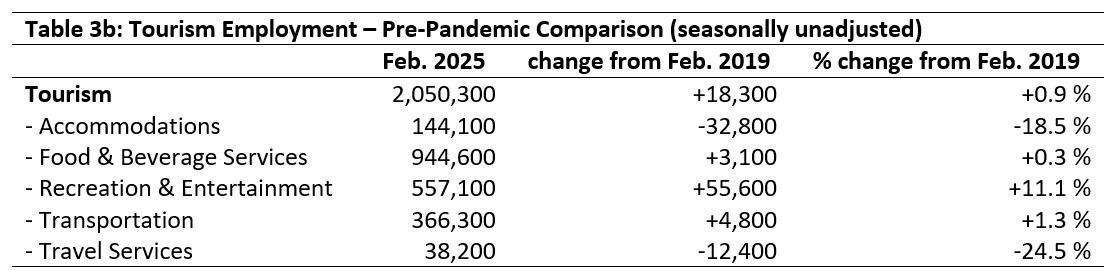
February 2019: Pre-pandemic Baseline
The sector on the whole was up almost 1% on its employment size from February 2019, a net growth of just over 18,000 people. Unfortunately, this net is comprised of very strong growth in recreation and entertainment (+55,000, +11%) which offsets substantial losses in accommodation (-32,800) and travel services (-12,400).
Part-time vs. Full-time Employment
The ratio of part-time to full-time work provides interesting insights into the stability of the workforce, and may signal long-term trends towards new working arrangements post-pandemic. If the sector faces demand-side challenges over the coming months, it may also be an early indicator of operators reconfiguring again in response to external pressures beyond their control. Figure 1 provides an overview of the percentage of part-time employment across the industry groups, using Statistics Canada’s definition of full-time employment (working 30 hours or more per week).
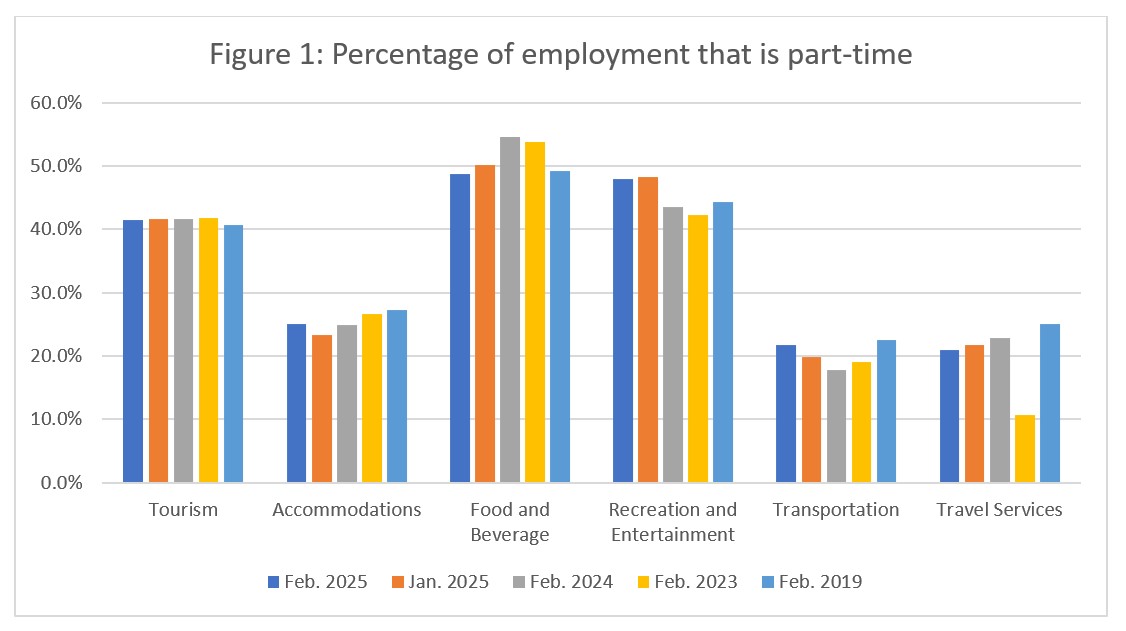
As a sector, tourism seemed to have returned to pre-pandemic patterns in terms of employment type, although there continued to be some fluctuation in different industries. With accommodations facing ongoing staffing shortages, it is not surprising to see that its ratio of part-time workers has remained below 2019 levels, although the 1.7 percentage point uptick from January is harder to explain. Food and beverage services has returned to its pre-pandemic ratio, coming down slightly from January and more substantially from last year. Recreation and entertainment has continued to post higher rates of part-time employment relative to 2019, indicating that many of the new entrants over the past few months are part-time workers. Transportation has seen its share of part-time workers creep up from January and from last year, approaching its ratio from 2019. Travel services continued the general downward trend away from part-time employment, 4 percentage points lower than before the pandemic.
Hours Worked
Another useful metric to assess the stability of the labour market is the total hours worked (see Figure 2), as this index can be more immediately responsive to shifts in consumer demand that raw employment figures alone. As with the ratio of part-time work, this metric may prove to be an early indicator of another systemic shift in employment across the sector in response to the changing circumstances facing Canada and the world.
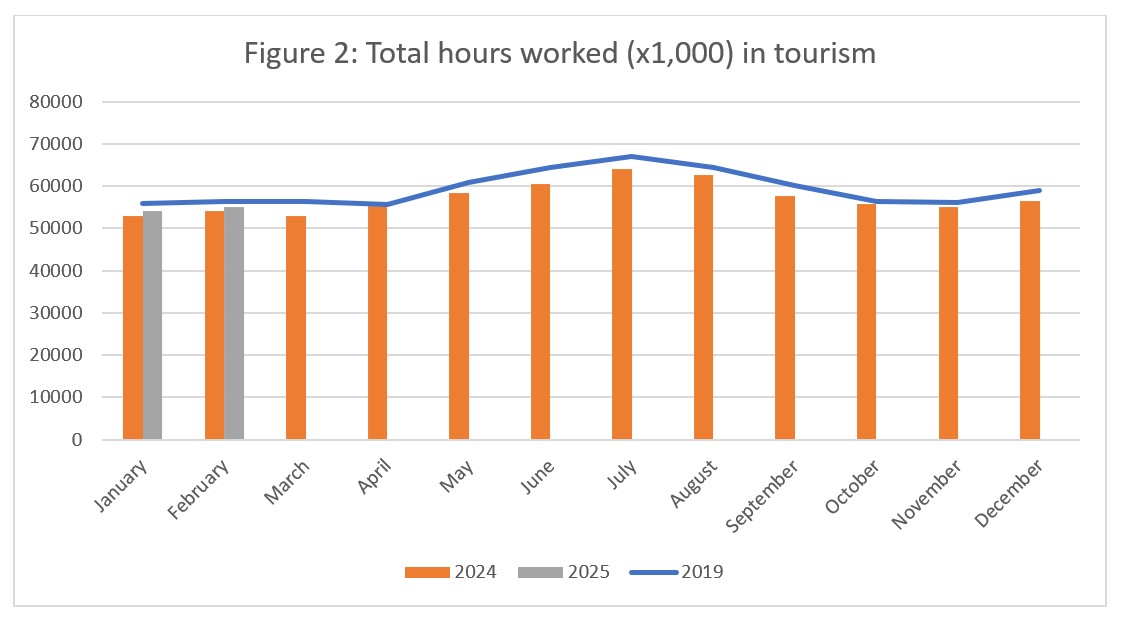
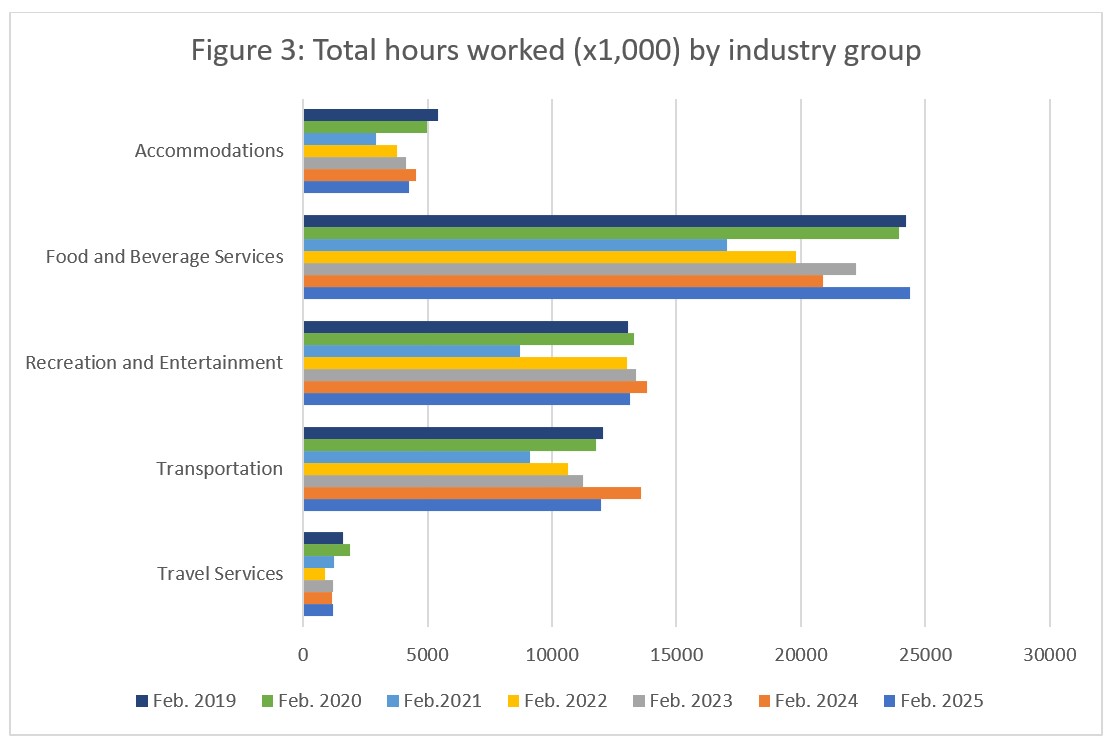
Total hours worked at the sector level were slightly higher than in January (+1.6%) and in February 2024 (+1.8%), although they remained 2.5% lower than in 2019. At the industry group level (see Figure 3), the year-on-year perspective shows that food and beverage services, recreation and entertainment, and transportation had more or less returned to pre-pandemic numbers. In the case of food and beverage services, February 2024 was lower than the otherwise steady trajectory of regrowth seen since 2021. For recreation and entertainment and transportation, total hours worked had shrunk from last year, quite substantially in transportation (around -12%); given the year-over-year decrease in employment (around -11%), this is not unexpected. In accommodations, the trajectory of slow regrowth seems to have dipped in 2025. Travel services was largely unchanged from last year, and remained slightly below 2019 levels.
Unemployment
The unemployment rate[5] in the tourism sector in February 2025 was 6.0%, around 0.7 percentage points below the national economy-wide average (6.7%, calculated using seasonally unadjusted data). Table 4 provides a summary of national unemployment rates across the tourism sector.
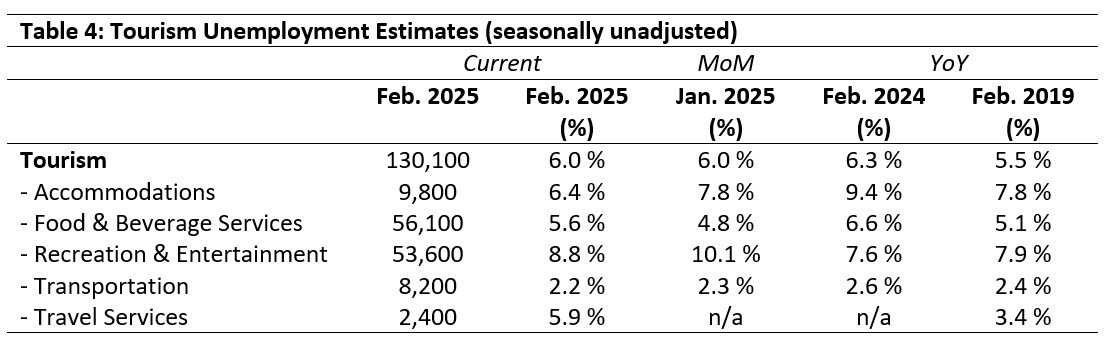
January 2025: Month-Over-Month
The sector-level unemployment rate remained unchanged from January, although there were some slight shifts at the industry level. The unemployment rate in accommodations fell by 1.4 percentage points, which reflects the fact that losses in the labour force were greater than in employment for this industry. The unemployment rate also fell in recreation and entertainment, and held fairly steady in transportation. Food and beverage services saw a slight increase in its unemployment rate (0.8 percentage points). The unemployment rate in travel services was estimated to be 5.9% in January, but there is no data available for comparison.
February 2024, 2019: Year-On-Year
Unemployment rates across the tourism industries were generally slightly lower this year than they were in February 2024, except in recreation and entertainment where the rate had increased by 1.2 percentage points. The largest decrease was in accommodations, which shaved off 3 percentage points. This reflects the loss of around 7,600 people in the labour force compared to the loss of only 2,100 people from employment: unemployed accommodations workers have either exited the labour force, or changed industries/sectors. The aggregate unemployment rate in February was around 0.5 percentage points higher than it was in 2019, and there was some variation across industries. The unemployment rate for accommodations fell slightly, as it did in transportation, while it rose slightly in food and beverage services and recreation and entertainment.
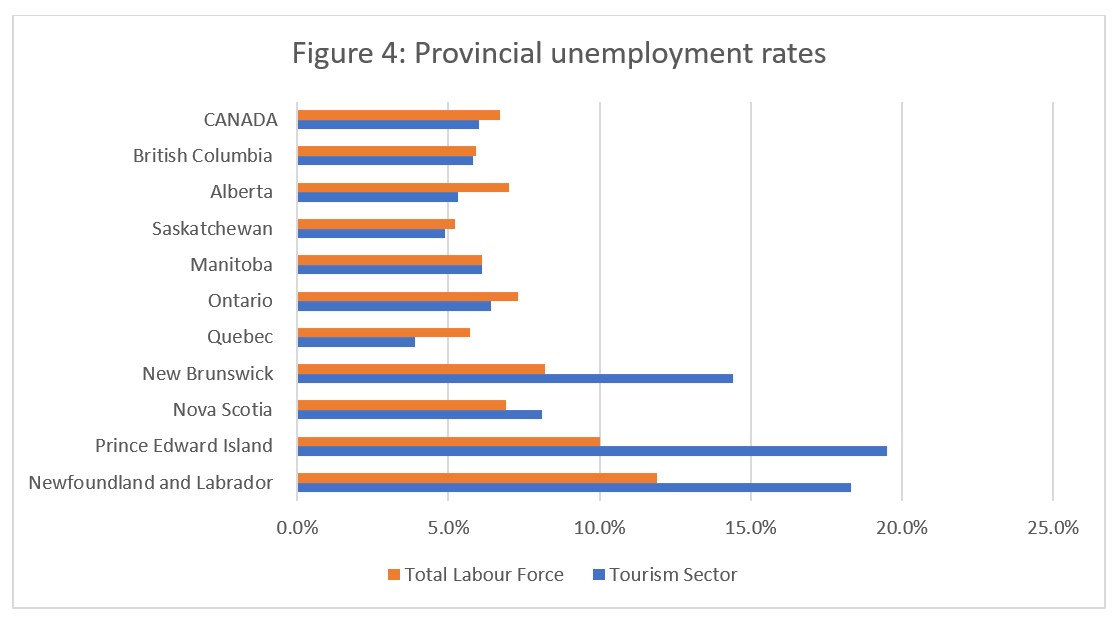
Provincial Tourism Unemployment
At the aggregate national level, the unemployment rate in tourism was lower than that of the national economy-wide average (see Figure 4), a pattern which held true for most provinces outside of the Atlantic region. As we often see in winter, tourism unemployment rates were in the double-digits in New Brunswick, Prince Edward Island, and Newfoundland and Labrador, and although substantially lower in Nova Scotia, tourism unemployment nevertheless was higher than that of the broader provincial economy. Overall, tourism unemployment rates were highest in Prince Edward Island (19.5%) and Newfoundland and Labrador (18.3%), and lowest in Quebec (3.9%) and Saskatchewan (4.9%).
View more employment charts and analysis on our Tourism Employment Tracker.
[1] As defined by the Canadian Tourism Satellite Account. The NAICS industries included in the tourism sector those that would cease to exist or would operate at a significantly reduced level of activity as a direct result of an absence of tourism.
[2] SOURCE: Statistics Canada Labour Force Survey, customized tabulations. Based on seasonally unadjusted data collected for the period of February 9 to 15, 2025.
[3] The labour force comprises the total number of individuals who reported being employed or unemployed (but actively looking for work). The total Canadian labour force includes all sectors in the Canadian economy, while the tourism labour force only considers those working in, or looking for work in, the tourism sector.
[4] Employment refers to the total number of people currently in jobs. Tourism employment is restricted to the tourism sector, while employment in Canada comprises all sectors and industries.
[5] Unemployment is calculated as the difference between the seasonally unadjusted labour force and seasonally unadjusted employment estimates. The percentage value is calculated against the labour force.