
In December 2023[1], tourism businesses made up 6% of all businesses in Canada, employed 9.9% of all working Canadians, and accounted for around 3.8% of the national GDP (of which around 1.6 percentage points were attributable to tourism spending, and the remaining 2.2 to local customers). Tourism is big business by whichever metric you prefer, and tourism businesses are important anchors in their communities. So what do those operators actually look like?
When you think of travel and tourism, you may call a specific image to mind: a bustling hotel, the chaos of an airport, the din and chatter of a busy restaurant, the excitement of a crowd at a show or a concert. We often think of fairly large businesses employing lots of people—even when we think of smaller operators, we probably imagine at least a handful of employees looking after our needs as guests and customers. But how accurate is that image? How much of this big business is actually made up of big businesses? And why does that matter?
Business Sizes
There are two main ways to categorize business by size. The first is by the number of employees and the second is by revenue. This article looks at businesses through the first lens, but it is worth being aware that the distinction between small, medium, and large enterprises can be made along at least two different sets of criteria.
In the revenue model, Statistics Canada defines business sizes by the following:
- Small businesses = annual revenues of between $30,000.00 and $5,000,000
- Medium-sized businesses = annual revenues of between $5,000,001 and $20,000,000
- Large businesses = annual revenues of $20,000,001 and over
While this perspective is useful from an economic perspective, it is harder to get reliable data on and doesn’t necessarily directly reflect workforce sizes.
In the employment model, Statistics Canada defines business sizes by the following:
- Small businesses = between 1 and 99 paid employees
- Medium-sized businesses = between 100 and 499 paid employees
- Large businesses = 500 or more paid employees
From the tourism perspective, this categorization is quite broad, and indeed the Canadian Chamber of Commerce splits the small businesses category into three sub-groups:
- Micro = between 1 and 4 paid employees
- Scale = between 5 and 19 paid employees
- Mature = between 20 and 99 paid employees
It is important to note that these definitions rely on the concept of paid employees: that is, businesses that have a formalized relationship between employer and employee, and for which payroll taxes are calculated. Not all businesses in Canada fit this definition: as we shall see, the majority of businesses in Canda—in tourism as well as more broadly across the economy—had no employees at all. This category of businesses without employees includes:
- Owner/operator-run businesses (including professional practices) with no paid employees
- Businesses that have a workforce consisting of contracted workers
- Businesses that employ family members on an informal basis
An example of a tourism business with no employees would be a bed and breakfast, where the homeowner looks after the day-to-day running of the business, but contracts the cleaning services to a third party and has a freelance marketer who looks after its digital presence. In the strict sense, there are no paid employees at this business, even though the business directly contributes to the income of three people: the homeowner, the cleaner, and the marketer. This distinction is an important one to bear in mind as we look at data from the Business Register (BR) below.
Equally important is the distinction between ‘employee’ in the BR data and ‘employment’ in the Labour Force Survey (LFS) data, which has a broader definition:
Employment = “Number of persons who, during the reference week, worked for pay or profit, or performed unpaid family work”
The LFS definition of ‘employment’ includes unpaid family workers and owner-operators (who are paid out of profits, rather than on a salary), who are explicitly excluded from the BR classification of employees.
Neither definition includes volunteers, who may comprise a sizeable share of some workforces in not-for-profit ventures and many festivals. A small local museum, for instance, might be run entirely by volunteers: it would be classed as a business with no employees, even if it relied on a roster of ten people to keep it in operation.
Tourism Industries and Employment
Before we look at business size, let’s first take a snapshot of the tourism sector at the end of 2023. Figure 1 classifies businesses according to their industry (using the Tourism Satellite Account’s definition, aligned with the North American Industry Classification System), and Figure 2 looks at employment across those same industry groupings.

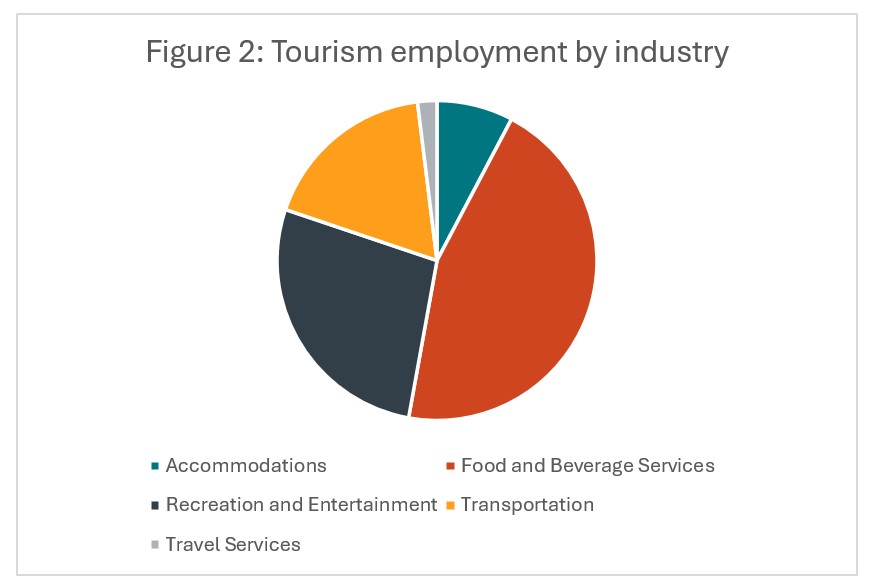
From a business count perspective, recreation and entertainment (accounting for 33% of all tourism businesses) and food and beverage services (32% of all tourism businesses) are the two largest industries in the sector; unsurprisingly, they are also the two largest industries by employment, with food and beverage services employing 45% of the tourism workforce, and recreation and entertainment 27%. Where there is a larger share of businesses than employment—for instance, in accommodations—this indicates a higher share of businesses with no employees. While there are some differences between these two ways of organizing tourism businesses by industry, the two snapshots are overall very closely aligned.
Businesses by Size
Tourism businesses account for 6% of all businesses in Canada. Adopting the Canadian Chamber of Commerce’s sub-groupings of small businesses, which allows a much more detailed examination of the distribution of businesses, Figure 3 provides a Canada-wide view of tourism businesses in the aggregate (i.e., not at the industry level), and Figure 4 provides the same perspective on all businesses in Canada, across the entire economy, as a point of comparison.
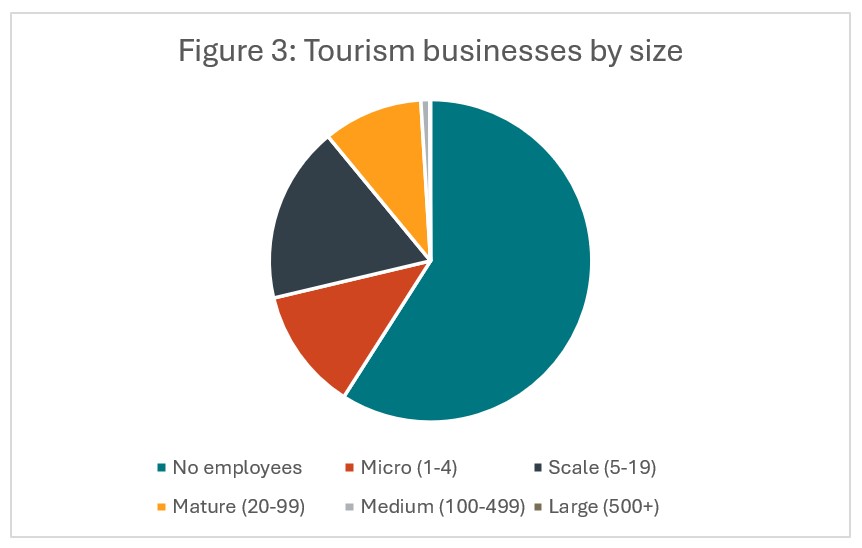
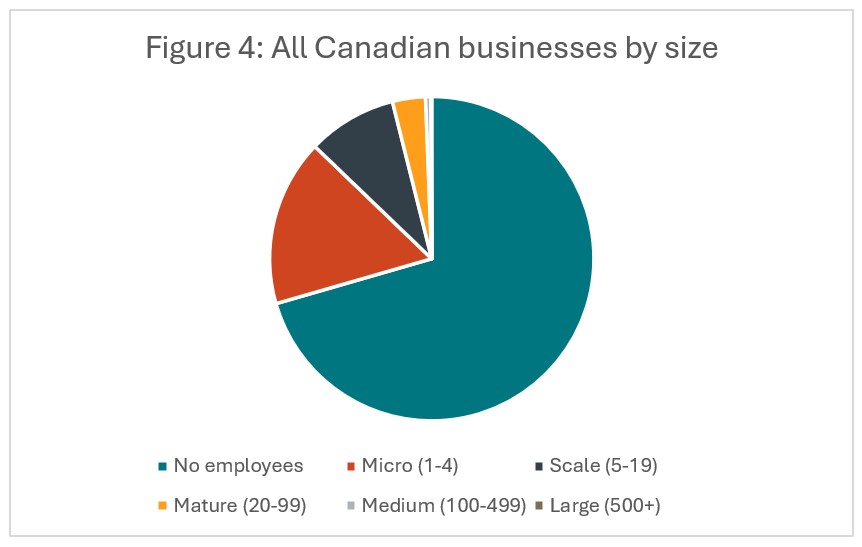
The distribution of tourism businesses at the national level is not very different from that across the whole of the economy, although tourism has a smaller share of zero-employee businesses and a larger share of small businesses (micro, scale, and mature). Small businesses jointly account for 40% of tourism businesses, compared to 29% across the entire economy. This means that small businesses in tourism do a relatively better job of providing employment in their communities than the average small business across the entire economy.
The Industry Lens
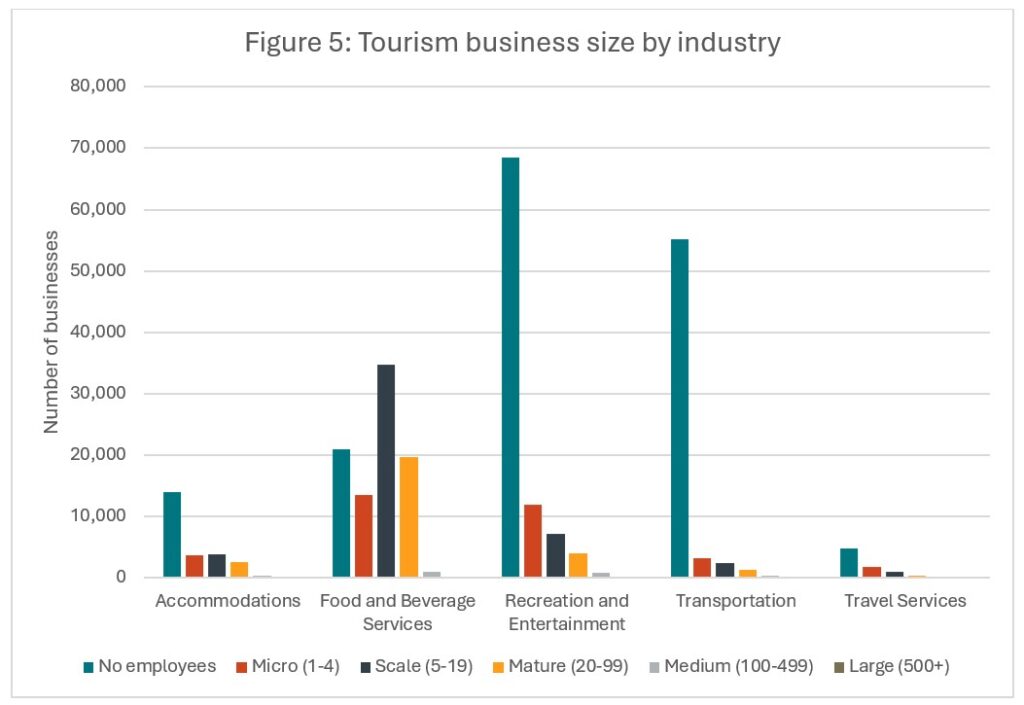
Of course, aggregate sector data can only tell us so much. Figure 5 looks at business size distribution across the five industries that comprise tourism, at the national level. The overwhelming majority of tourism businesses across all industries are in the category of “small businesses”, so the further detail available by the micro-scale-mature sub-groupings is a useful lens on the sector. Food and beverage services has the highest absolute number of businesses with more than 4 employees, but it also has the largest percentage of businesses with more than 4 employees—unsurprising, given both the relative size of this industry compared to the others, and also the operational complexity of restaurants.
The high spikes of zero-employee businesses are particularly noteworthy in recreation and entertainment and in transportation. In recreation and entertainment, the largest sub-industry grouping that contributes to this category is independent artists, writers and performers: that is to say, self-employed workers in creative industries. In a similar vein, the largest single sub-industry grouping in transportation with no employees is taxi and limousine drivers, a classification that includes ride-share drivers. Like artists, writers and performers, these drivers are self-employed, so they are counted as unincorporated businesses for the purposes of this count. In accommodations, the largest contributors to zero-employee businesses are bed and breakfasts and a catch-all category that includes guest houses and youth hostels. Less sub-industry detail is available for food and beverage services, but it is likely that this category includes small, independent cafés and family-run restaurants.
A Regional Perspective
Nationally, tourism businesses make up 6% of all businesses, and this national average is not far removed from the provincial averages, which range from 4.4% in Saskatchewan to 6.9% in Prince Edward Island (see Table 1, column ‘Tourism share of all businesses’). Interestingly, tourism’s share of businesses is substantially higher in the territories, at over 10% in all three. Of course, the territories’ share of all tourism businesses (column ‘Share of tourism total’) is much smaller than in the provinces, but that is to be expected given the distribution of the population across the country. The importance of tourism in the north—in terms of both revenue and employment—highlights the challenges around tracking employment at this level: the territories are not included in the monthly LFS data sets, so it is complex to try to monitor seasonal shifts in the workforce in Nunavut, the Northwest Territories, and Yukon.
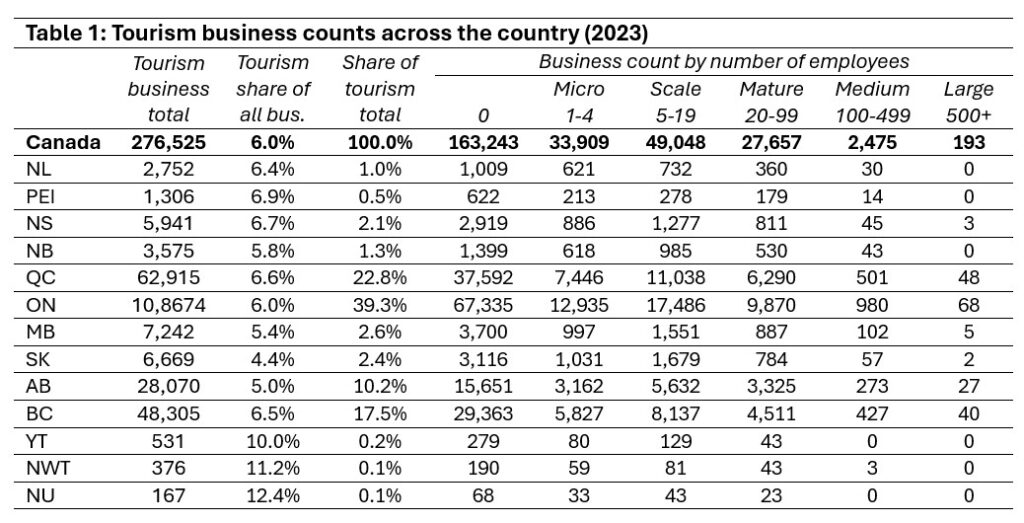
The bulk of tourism businesses (around 90%) are found in four provinces: Ontario, Quebec, British Columbia, and Alberta; given the distribution of the population across the country, this is not surprising. These same four provinces also have the largest share of large businesses (500 employees or more). At the national level, most of these large enterprises are airlines, urban transit systems, hotels/resorts, and a collection of amusement and recreation industries (including casinos).
Workforce Implications
There are several reasons why business size matters from an HR perspective, and perhaps more so for tourism than for other sectors. As noted above, small tourism businesses provide more employment opportunities than small businesses in general across the entire economy, making them cornerstones of local economies, and socially important anchors in their communities.
HR practices vary from business to business, and scale is part of the picture. Large enterprises are likely to have dedicated HR personnel, while smaller operations are more likely to have HR and staffing concerns handled as part of general management practices. These businesses without professional HR support may be struggling in ways that they do not immediately realize, or may be mistaking HR pinch-points for some other operational concern, or vice versa: what looks like a cash flow problem may actually reflect an underlying HR challenge. Having access to the right tools is important for small businesses.
One question often raised is whether (and to what extent) agencies such as Tourism HR Canada, with a mandate aimed at supporting the tourism workforce, should concern itself with zero-employee businesses. After all, if a business has no workforce, surely it falls outside of the scope of a workforce development council. However, there are at least three reasons why these sub-micro businesses matter.
First, they are important players in their local tourism ecosystems, providing goods and services for the visitor economy that directly and indirectly support other tourism businesses in their communities. Businesses are connected to each other in complex ways, and the health of one set of players is intimately connected with the health of others.
Second, many businesses start out small and then grow: as tourism becomes more central to many rural and small-town economies, these businesses may look to expand—and have need of a skilled, reliable, and resilient workforce. Staying connected with these businesses as they scale up, and building the HR resources in those businesses where owners suddenly find themselves acting as employers, is important for maintaining and improving the sector’s reputation as an employment destination.
And finally, many of these zero-employee businesses do, in fact, have people working for them: family members, volunteers, and contractors alike contribute to the wellbeing and viability of many tourism enterprises. With the increasing reliance on gig workers across a wide range of businesses—from rideshares to restaurant delivery to on-call positions as tour guides and cleaners—the way we think of our workforce is changing. Regardless of the legal classification of their attachment to business, these casual or informal workers are an important part of the tourism workforce. The current statistical approach to accounting for employment does not do a very good job of capturing these workers, but we should not let the difficulty of keeping track of them downplay their role in the success of tourism enterprises across the country.
[1] The December 2024 business counts were not yet available at the time this article was written, but tourism’s share of all businesses in Canada has been relatively stable over the past several years so these figures are unlikely to be wildly out of step.
This is the third in a series of articles looking at key topics that came out of our recent Losing Ground: The Definitive Workforce Update webinar. Read the first article, International Talent in Canadian Tourism, and the second article, Money Matters: Attraction and Retention.