Recreation and Entertainment Pulls Sector Above 2019 Levels
The tourism sector[1] in January 2025 saw a general decrease in labour force and employment over the previous month[2]. Employment saw a larger decrease than labour force, although both were modest (-1.4% and 0.9%, respectively). In more positive news, both indices had surpassed last year’s estimates by over 4%, and had also surpassed January 2019 by just over 1%.
At the industry group level, month-over-month changes were fairly consistent decreases, with recreation and entertainment and travel services being the two exceptions. As noted in previous reports, due to its small size relative to the tourism sector and the sampling methodology of the Labour Force Survey, estimates relating to travel services should be treated with some cautions.
Table 1 provides a snapshot of tourism’s and each of its five industry groups’ performance across labour force, employment, and unemployment, as compared with December 2024 [MoM] and January 2024 [YoY], and with January 2019 as a pre-pandemic baseline. Small arrows represent changes of less than 1%, or less than one percentage point (pp) in the case of unemployment.
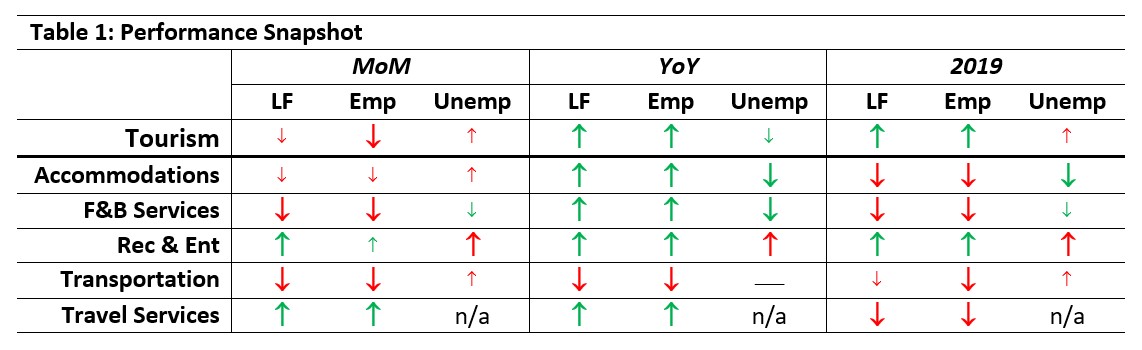
Although the sector shrank relative to December, year-over-year comparisons were generally more favourable. All industries except transportation saw strong growth over January 2024, while the sector in the aggregate was pulled up relative to 2019 by very substantial growth in recreation and entertainment. Unemployment rates were on the whole slightly elevated relative to December, lower than in January 2024, and variable across industry groups from 2019.
Tourism Labour Force
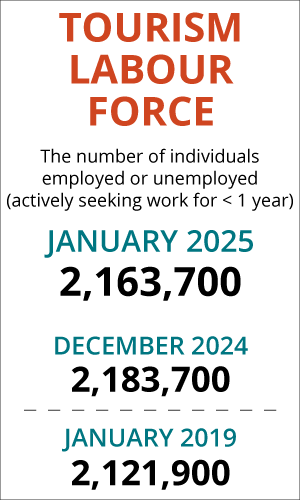
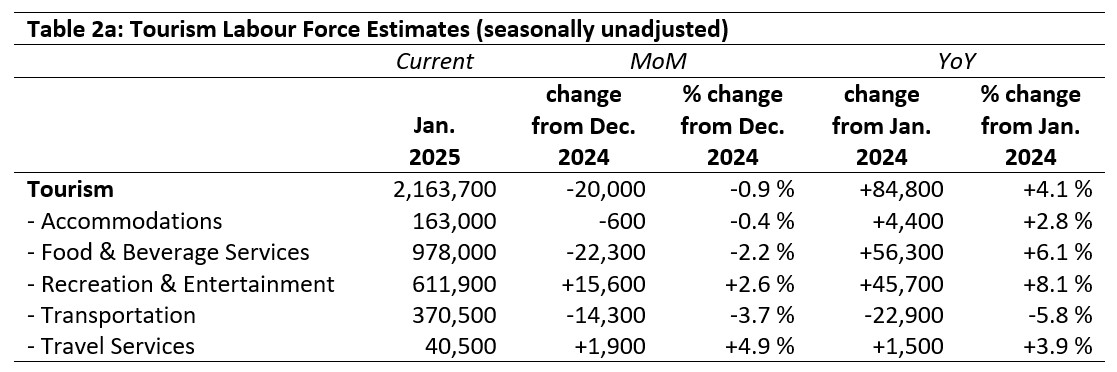
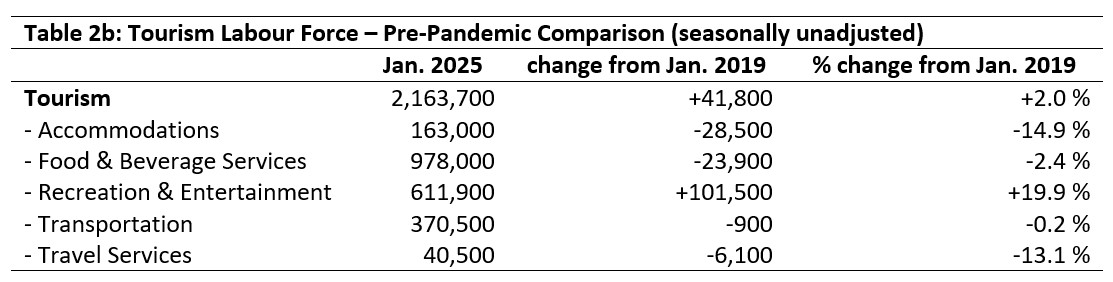
The tourism labour force[3] in January 2025 accounted for 9.7% of the total Canadian labour force, which is little changed from where it was in December (-0.1 percentage points). The tourism labour force reached 104.1% of its size in January 2024—and surpassed its pre-pandemic level (+2.0%). Tables 2a and 2b provide a summary of the tourism labour force as of January.
December 2024: Month-over-Month
The overall tourism labour force saw a slight decline from December, losing around 20,000 people from its pool of available workers. Between them, food and beverage services and transportation lost around 36,000 people, while recreation and entertainment gained over 15,000. Accommodations was virtually unchanged, and while travel services posted a strong gain, it remains to be seen whether this is an actual increase over the long run or a short-term fluctuation in the data.
January 2024: Year-On-Year
Relative to last January, the sector’s labour force saw nearly 85,000 extra people available for work. The strongest gains were in food and beverage services (+56,000) and recreation and entertainment (+46,000), while transportation saw a decrease of nearly 23,000 people. Although the increase in accommodations was smaller than those of other industries, it nevertheless saw its labour force grow by around 2.8%.
January 2019: Pre-pandemic Baseline
At the sector level, the tourism labour force saw an increase of nearly 42,000 people from 2019, although in reality this represents enormous gains in recreation and entertainment (+20%, just over 100,000 new entrants to the labour force) and losses across all other industries. Accommodations sustained the largest decrease in both absolute (-29,000) and relative (-15%) terms.
Tourism Employment
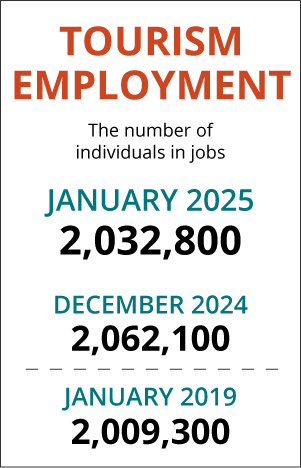
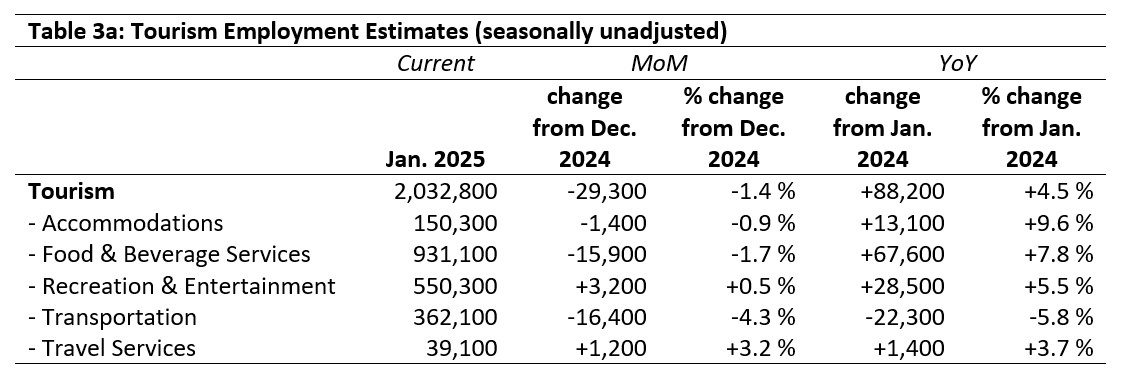
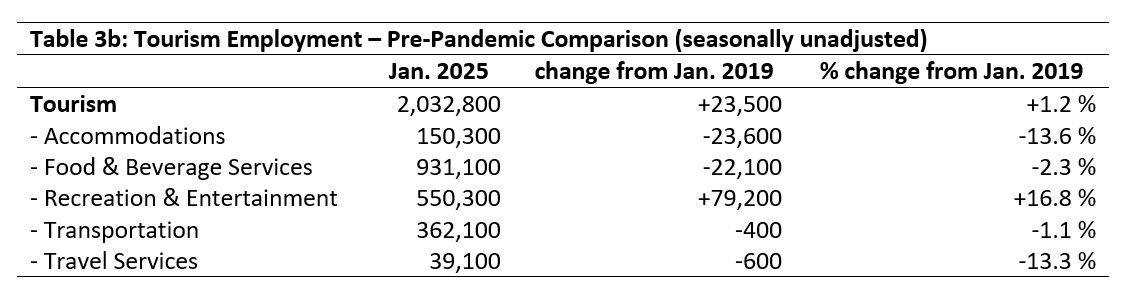
Tourism employment[4] accounted for 9.8% of all employment in Canada, and 9.1% of the total Canadian labour force was working in a tourism industry. These shares remain lower than those seen in December, although they are slightly higher than they were in January 2024. Tables 3a and 3b provide a summary of tourism employment as of January 2025.
December 2024: Month-Over-Month
The decline in employment from December was slightly higher than that in labour force, with around 29,000 people having left work in the sector (-1.4%). Recreation and entertainment showed slight growth, as did travel services, while all other industries saw losses. Transportation lost the most workers, followed by food and beverage services. Accommodations lost around 1% of its workers.
January 2024: Year-On-Year
The sector overall saw over 88,000 workers entering employment in tourism, with food and beverage services posting the strongest absolute gains (+68,000), and accommodations posting the largest relative gains (+9.6%). Transportation alone saw a decrease, losing nearly 6% of its workforce over the past year.
January 2019: Pre-pandemic Baseline
Employment in tourism had grown by around 1% over January 2019 levels, a gain of over 23,000 workers. As with labour force, however, the aggregate masks substantial losses in most industry groups counterbalanced by gains in recreation and entertainment. Accommodations remained the hardest hit among the industries, losing over 23,000 employees (around -14%). Transportation saw the smallest losses, but this loss is interesting because for most of the past year, transportation has paralleled recreation and entertainment in surpassing pre-pandemic levels in employment. Whether this is a long-term slowdown in the industry or a temporary departure from larger trends remains to be seen.
Part-time vs. Full-time Employment
The ratio of part-time to full-time work provides interesting insights into the stability of the workforce, and may signal long-term trends towards new working arrangements post-pandemic. Figure 1 provides an overview of the percentage of part-time employment across the industry groups, using Statistics Canada’s definition of full-time employment (working 30 hours or more per week).
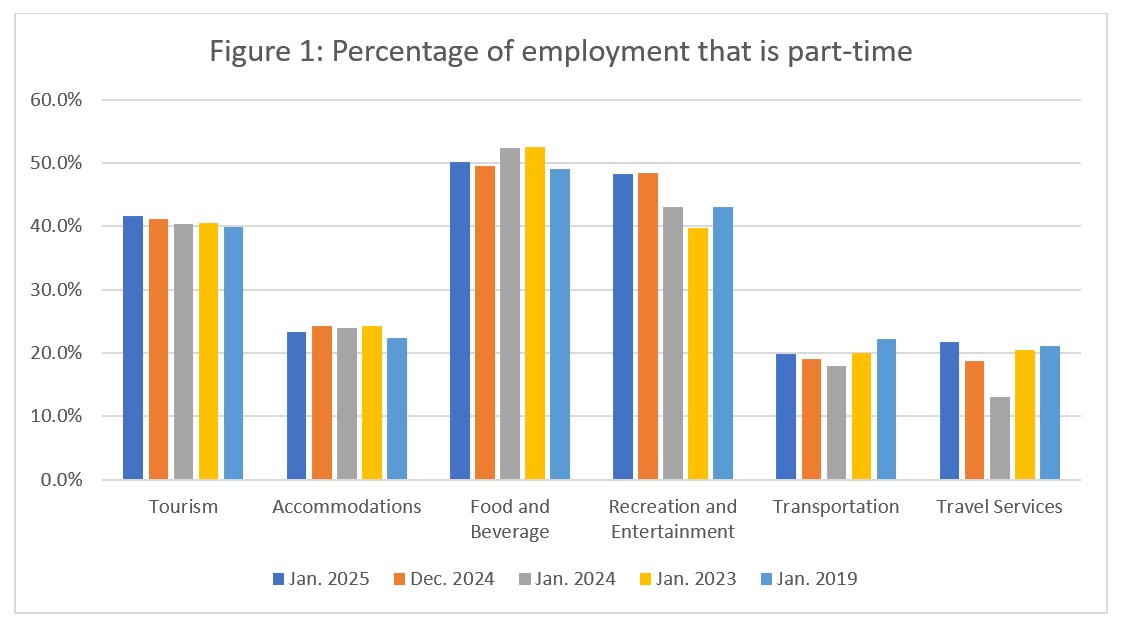
As in previous months, the ratio of part-time to full-time work has largely stabilized since the chaos of the peak of the pandemic disruptions. The sector overall remained steady at around 40% part-time work, with most industries having returned broadly to their pre-pandemic levels. The exception is recreation and entertainment, which remained largely unchanged from December but substantially elevated from pre-pandemic rates (+5%). This may signal a general shift in employment patterns across this industry group, where larger numbers of part-time employees are replacing smaller numbers of full-time staff. This is another trend worth keeping an eye on.
Hours Worked
Another useful metric to assess the stability of the labour market is the total hours worked (see Figure 2), as this index can be more immediately responsive to shifts in consumer demand that raw employment figures alone. This is particularly true where part-time employment is relatively high, as employers can scale work hours in response to demand more quickly (and more easily) than they can hire or fire staff.
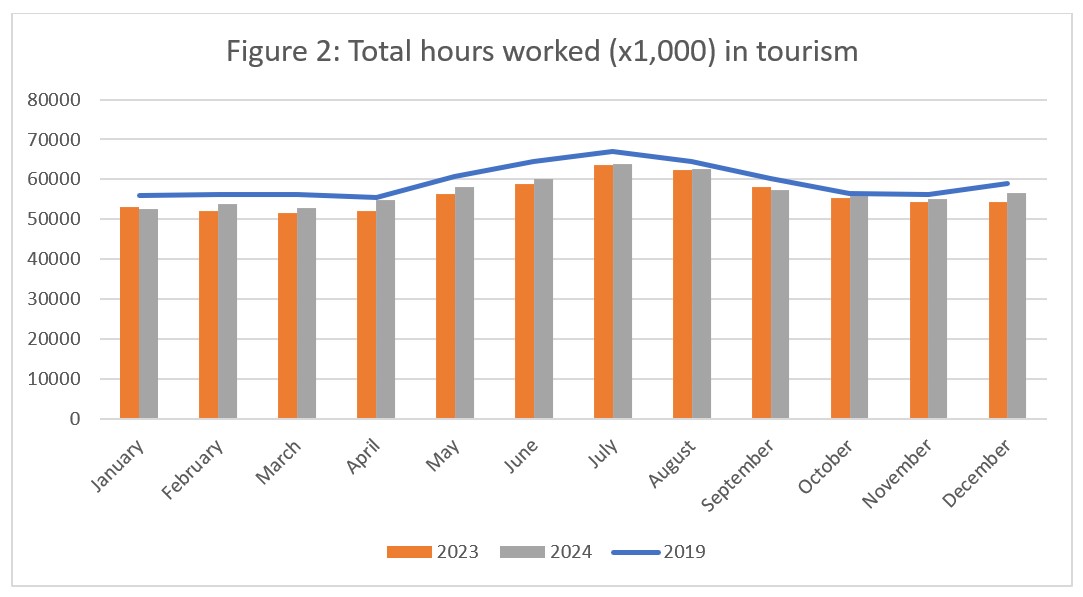
As always in January, the figure is quite sparse, but there was growth in the number of hours worked from last January (around +2.2%, slightly higher than year-over-year growth in employment). There was a drop of 4.2% from December 2024, also slightly larger than the month-over-month decrease in employment. The estimate for January remained below pre-pandemic levels (-3.3%).
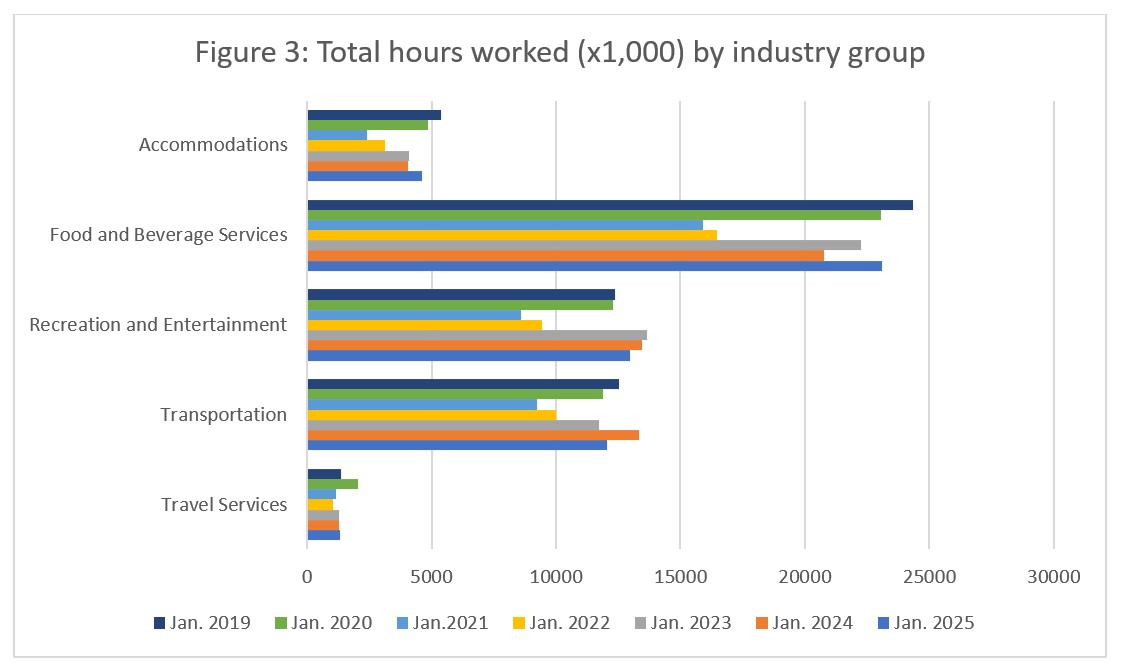
At the industry group level (see Figure 3), the six-year annual snapshot (successive Januaries from 2019 to 2025) shows that hours worked generally remained below pre-pandemic levels except in recreation and entertainment, which surpassed 2019 in 2023, and has stayed above this threshold since then, mirroring what we saw in employment numbers. However, it has seen decreases in recent years. Transportation saw a substantial decrease from last year, when it had surpassed 2019. Overall, travel services has remained fairly consistent in the number of hours worked over the past few years, while accommodations has generally increased year-over-year from the peak of the pandemic disruptions in 2021.
Unemployment
The unemployment rate[5] in the tourism sector in January 2025 was 6.0%, around one percentage point lower than the national economy-wide average (7.1%, calculated using seasonally unadjusted data). The unemployment rate was slightly higher than in December (+0.4 percentage points), which is unsurprising given the relative changes in labour force and employment over the past month. Table 4 provides a summary of tourism unemployment as of January 2025.
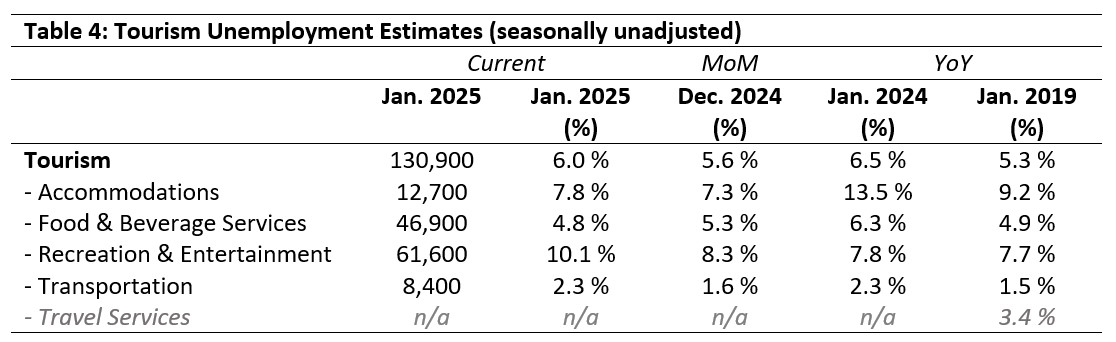
December 2024: Month-Over-Month
Across most industry groups, unemployment rose slightly from December, except in food and beverage services where it shrank slightly (-0.5 percentage points). In total, around 131,000 people were unemployed across the sector, with the largest number in recreation and entertainment. Again, this is not entirely surprising given the magnitude of increases seen in the labour force for this industry group. As is often the case, there was no unemployment data available for travel services.
January 2024, 2019: Year-On-Year
The aggregate unemployment rate in tourism fell slightly from this time last year (-0.5 percentage points) but was around 0.7 percentage points higher than in January 2019. The unemployment rate in accommodations was substantially lower than last year (-5.7 percentage points), and was also below the pre-pandemic rate of January 2019. There has been some fluctuation in the unemployment rates in food and beverage services and transportation, although they have remained within the same general range. The unemployment rate in recreation and entertainment marks an increase over both last year and 2019.
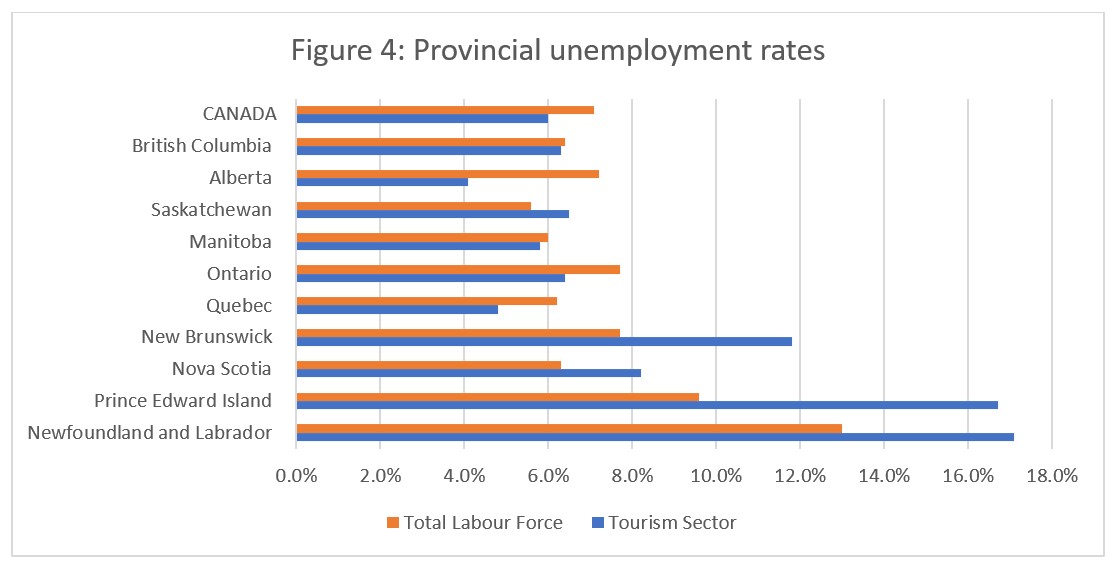
Provincial Tourism Unemployment
At the aggregate national level, the unemployment rate in tourism was lower than that of the national economy-wide average (see Figure 4), a pattern which held true for most provinces as well, excepting Saskatchewan and the Atlantic provinces (which are always susceptible to seasonal highs this time of year). The gap between the tourism unemployment rate and that of the larger economy averaged 4.3 percentage points across the Atlantic provinces, rising to 5.1 percentage points if Nova Scotia is excluded. The tourism unemployment rates were highest in Newfoundland and Labrador (17.1%) and Prince Edward Island (16.7%), and lowest in Alberta (4.1%) and Quebec (4.8%).
View more employment charts and analysis on our Tourism Employment Tracker.
[1] As defined by the Canadian Tourism Satellite Account. The NAICS industries included in the tourism sector those that would cease to exist or would operate at a significantly reduced level of activity as a direct result of an absence of tourism.
[2] SOURCE: Statistics Canada Labour Force Survey, customized tabulations. Based on seasonally unadjusted data collected for the period of January 12 to 18, 2025.
[3] The labour force comprises the total number of individuals who reported being employed or unemployed (but actively looking for work). The total Canadian labour force includes all sectors in the Canadian economy, while the tourism labour force only considers those working in, or looking for work in, the tourism sector.
[4] Employment refers to the total number of people currently in jobs. Tourism employment is restricted to the tourism sector, while employment in Canada comprises all sectors and industries.
[5] Unemployment is calculated as the difference between the seasonally unadjusted labour force and seasonally unadjusted employment estimates. The percentage value is calculated against the labour force.