The Mid-Season Slump Returns
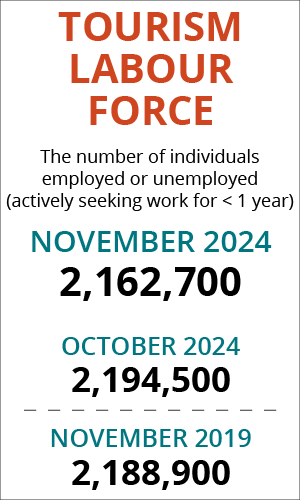
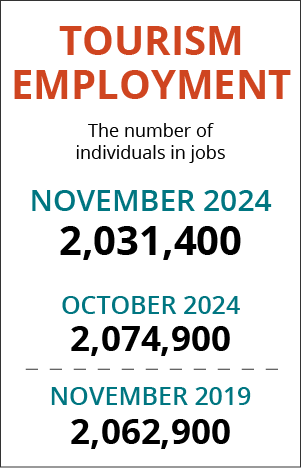
The tourism sector[1] in November 2024 saw a moderate contraction from October[2], with labour force falling by around 32,000 people (-1.4%) and employment by around 44,000 (-2.1%). Both were in a stronger position than last year, but remained between 1% and 2% below 2019 levels. A labour slump in November is not unusual, falling as it does between the travel peaks of the summer and winter holidays.
At the industry group level, month-over-month changes were generally decreases; accommodations alone showed growth. Year-over-year changes were more variable, and benchmarked against 2019, most industry groups continued to struggle.
Table 1 provides a snapshot of tourism’s and each of its five industry groups’ performance across labour force, employment, and unemployment, as compared with October 2024 [MoM] and November 2023 [YoY], and with November 2019 as a pre-pandemic baseline. Small arrows represent changes of less than 1%, or less than one percentage point (pp) in the case of unemployment.

Month-over-month, only accommodations improved on both labour force and employment. Food and beverage services saw only slight changes, but all other industries contracted by over one percent.
Year-over-year, the sector as a whole was in a stronger position, buoyed by gains in the two largest employment groups (food and beverage services and recreation and entertainment).
Compared with 2019, recreation and entertainment and transportation had surpassed pre-pandemic baseline levels for both labour force and employment, while other industry groups remained depressed. Unemployment rates at the sector level were slightly elevated (by less than one percentage point) at all time scales, but there was considerable variation across industry groups. Recreation and entertainment saw the largest relative increase in unemployment since October.
It is worth reiterating that, due to some unexpectedly volatile fluctuations in LFS data for travel services over the past 12 months, the data for this industry groups should be treated with caution. The stats for November do not show this same degree of unpredictability, so it may be that the points of concern in previous months marked a transition in the population sampling for this period (more detail on the LFS methodology can be found here), and that the data is returning to a more reliable pattern. We remain cautious but optimistic that the labour force trends in this industry group will return to stability.
Tourism Labour Force
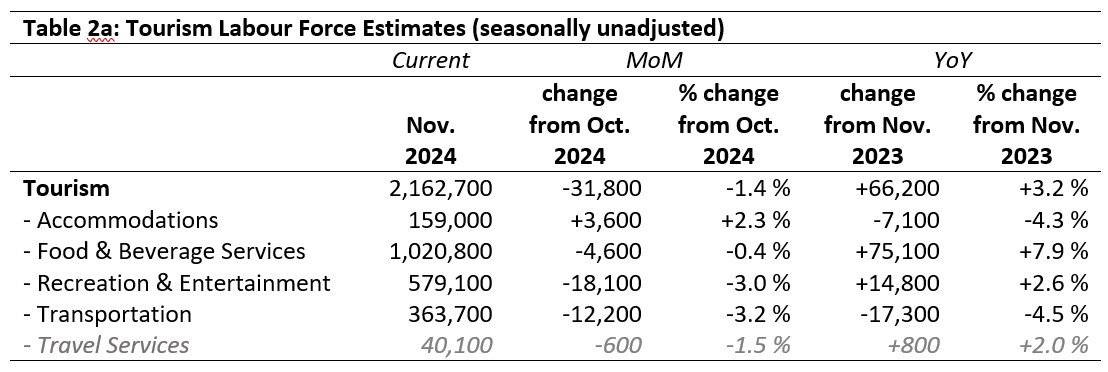
The tourism labour force[3] in November 2024 accounted for 9.8% of the total Canadian labour force, which is a slight fall from October, but on par with November 2023. The labour force in November was 98.8% of what it was in 2019. Tables 2a and 2b provide a summary of the tourism labour force as of November.
October 2024: Month-over-Month
The overall tourism labour force saw the departure of almost 32,000 people from the tourism labour force, a drop of 1.4%. The largest absolute loss was in recreation and entertainment, and the largest relative loss was in transportation. Food and beverage services saw only a very slight drop, less than half a percent, while accommodations saw a modest increase (over 3,500 people, an increase of 2.3%).
November 2023: Year-on-Year
Relative to last November, the sector’s labour force grew by over 66,000 people, a gain of 3.2%. In spite of month-over-month growth, accommodations remained over 4% below where it was last year, as did transportation. In contrast, food and beverage services and recreation and entertainment—the two largest industry groups in terms of employment—saw substantial increases in labour force, particularly in food and beverage services, which had added over 75,000 people since last year.
November 2019: Pre-pandemic Baseline
At the sector level, the labour force had not yet fully returned to pre-pandemic levels, remaining around 1.2% below this benchmark. The labour force in recreation and entertainment was in a much stronger position, however, having added nearly 51,000 people (+9.6%); transportation had also surpassed its pre-pandemic levels. These two industry groups have shown broadly consistent gains across this past year relative to 2019, suggesting that they have not only fully recovered, but have in fact returned to their pre-pandemic growth trajectories. In contrast, accommodations remained 15% below where it was in 2019, and travel services remained 37% below its own high-water mark.

Tourism Employment
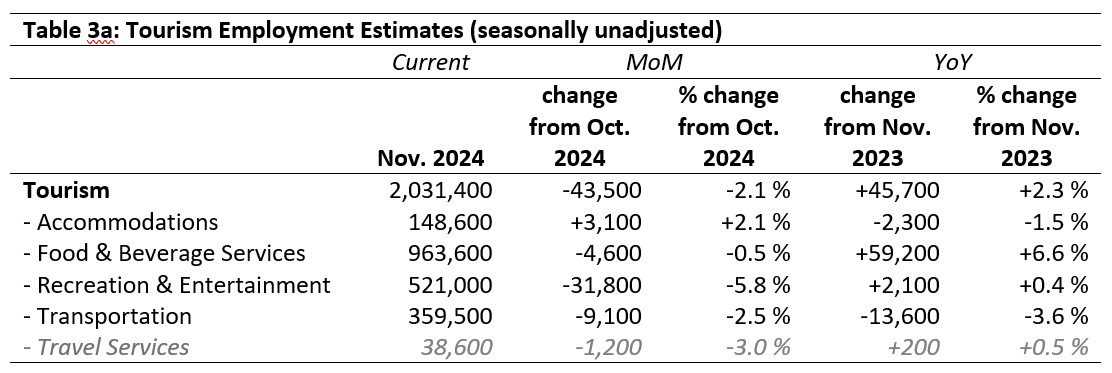
Tourism employment[4] accounted for 9.8% of all employment in Canada, and 9.2% of the total Canadian labour force was working in a tourism industry. This figure is a full percentage point below where it was in 2019. The fall in employment surpassed that in labour force, so the unemployment rate also rose (discussed below). Tables 3a and 3b provide a summary of tourism employment as of November 2024.
October 2024: Month-over-Month
At the sector level, tourism employment fell by 1.4%, a loss of nearly 44,000 workers. The loss was felt most deeply in recreation and entertainment, which saw employment levels fall by nearly 32,000 in that industry group alone (-5.8%); this may reflect the wrap-up of the late autumn shoulder season and the lull before winter activities come into force. Transportation also saw a decrease of over 9,000 workers (-2.5%), while food and beverage services was essentially unchanged. Accommodations added over 3,000 workers (+2.1%), which is encouraging given the difficulties the industry group has been grappling with recently.
November 2023: Year-on-Year
Relative to last year, the sector was in a substantially stronger position, having added over 45,000 workers in employment across the country. This represents impressive growth in food and beverage services (+6.6%, nearly 60,000 people newly working), offset by losses in accommodations and transportation. Recreation and entertainment saw modest growth.
November 2019: Pre-pandemic Baseline
The sector had recovered to an aggregate 98.5% of its pre-pandemic employment strength in November, buoyed in this instance by strong performance in recreation and entertainment (+7.1%) and transportation (+4.2%). Accommodations remained 14% below its 2019 employment levels, and travel services trailed even further behind (-36%). Food and beverage services was a more modest 3.5% below where it had been five years ago. This year’s overall mid-season slump was more pronounced than it was in 2019, but the sector was still on its year-over-year trajectory of recovery and regrowth.

Part-time vs. Full-time Employment
The stability of the tourism workforce can offer interesting insights into the overall recovery of the sector, and in which areas it is returning to pre-pandemic patterns and where it is settling into new norms. The ratio of part-time to full-time work is one such metric. Figure 1 provides an overview of the percentage of part-time employment across the industry groups, using Statistics Canada’s definition of full-time employment (working 30 hours or more per week).
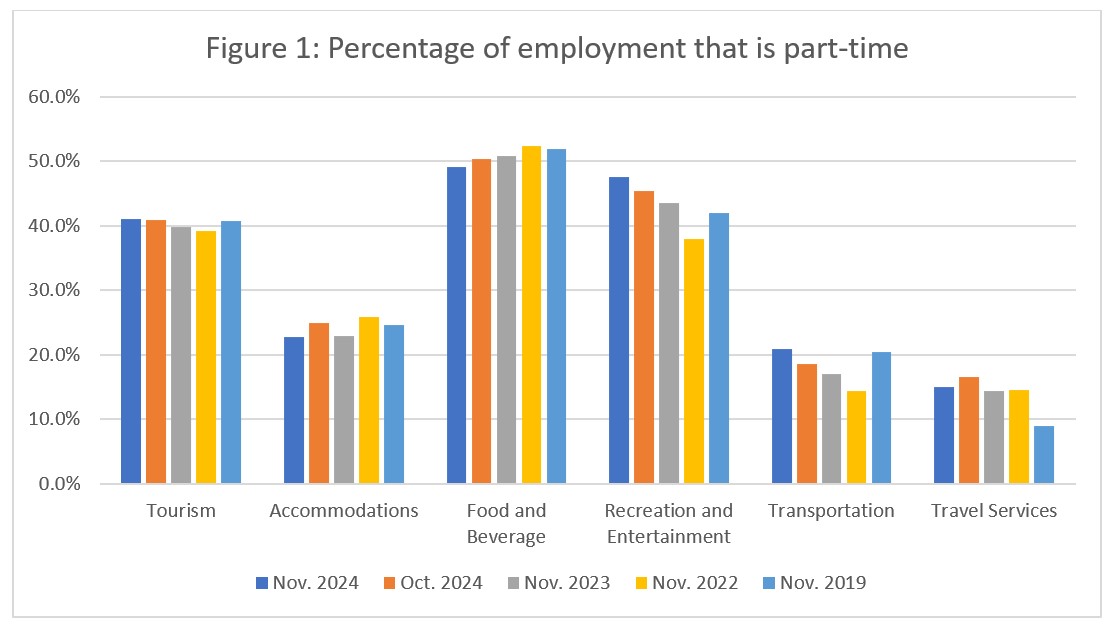
In the aggregate, part-time employment in tourism in November 2024 had essentially re-stabilized to pre-pandemic levels, with very little change from October and directly comparable to the 41% observed in 2019. Accommodations has sown some volatility year over year, but there is a general downward trend, indicating greater reliance on full-time workers (part-time employment fell by just shy of 2 percentage points from 2019). Food and beverage services has also seen a consistent decrease in part-time work, from 52% part-time work in 2019 to 49% this past month. In contrast, recreation and entertainment is seeing a rapid rise in part-time employment—which may in some way correlate with a return to more traditional tertiary education patterns post-pandemic (with more students studying on campus, living away from home, and taking up part-time work), and very likely accounts for the precipitous rise in raw employment numbers (where no distinction is made between part-time and full-time employment). Travel services has also seen a considerable increase in part-time employment since 2019 (+6%), although the ratio dropped slightly from October. In transportation, the part-time ratio has returned to its pre-pandemic average of 21% after a fairly steady year-over-year increase.
Hours Worked
Another useful perspective on the stability of the tourism labour market is the total hours worked (see Figure 2), as this index can be more immediately responsive to shifts in consumer demand than raw employment figures alone. This is particularly true where part-time employment is relatively high, as employers can scale work hours in response to demand more quickly (and more easily) than they can hire or fire staff.
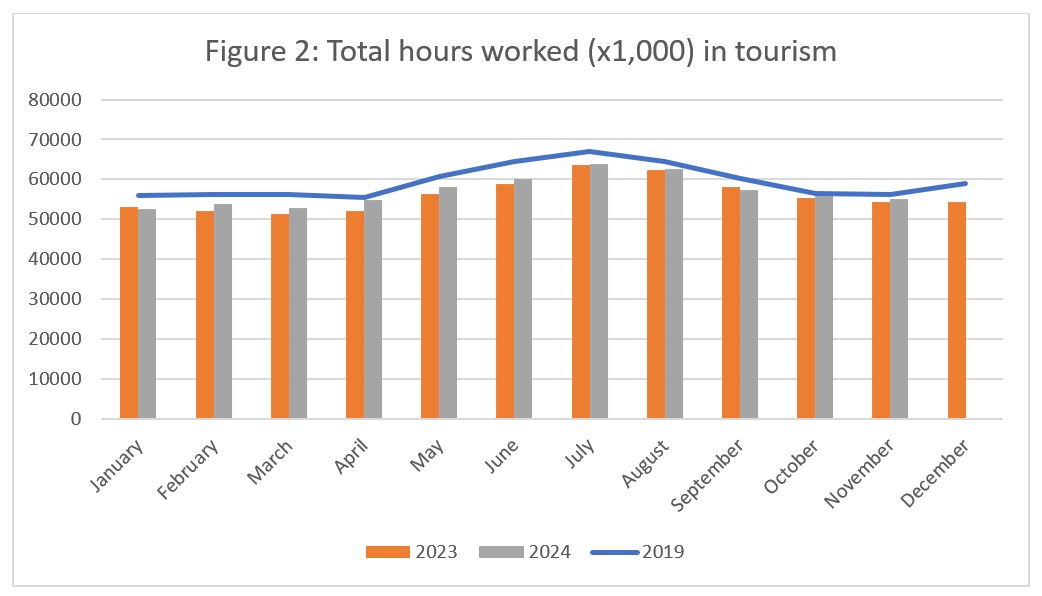
Although total hours worked in tourism in November 2024 remained below 2019 levels, there was a year-over-year increase from 2023. The month-over-month decrease in hours worked (-1.4%) was slightly smaller than the decrease in employment (-2.1%), suggesting that, to a limited extent, losses in employment were partially offset by an increase in average hours worked (although in all likelihood, those increases were not distributed evenly across the entire workforce).
The curve (blue line) for 2019 in Figure 2 shows an uptick in December, but last year’s data (orange bars) do not follow the same pattern, so it remains to be seen what the November-December transition will look like in 2024.
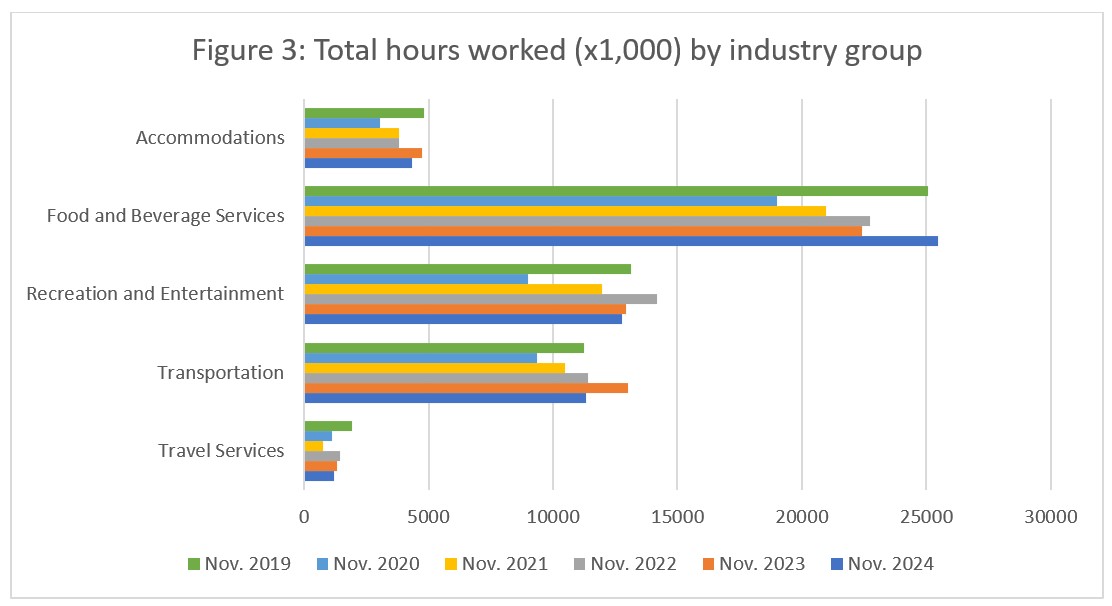
At the industry group level (see Figure 3), the year-on-year perspective shows month-over-month increases in hours worked in food and beverage services (+2.7%), while all other industry groups saw a decrease. This closely parallels the trends in employment. Hours worked relative to last year increased for accommodations and food and beverage services, but fell for other industry groups. November 2024 surpassed 2019 in food and beverage services and transportation only, indicating the complexity of the relationship between employment numbers and those for hours worked.
Unemployment
The unemployment rate[5] in the tourism sector in November 2024 was 6.1%, around 0.4 percentage points below the national economy-wide average (6.5%, calculated using seasonally unadjusted data). The tourism unemployment rate was slightly higher than it was in October, reflecting an increase of nearly 12,000 people looking for work in tourism industries, to just over 131,000.
While it is tempting to be frustrated at high unemployment figures amid the difficulties tourism operators are having in rebuilding their workforces, it is important to recall that structural challenges around skill levels and worker mobility complicate the relationship between vacancies and unemployment at the aggregate level.

October 2024: Month-over-Month
The unemployment rate in accommodations saw a slight increase from October. There was no change in the unemployment rate in food and beverage services, while that in recreation and entertainment increased by around 2.5 percentage points (nearly 14,000 people newly out of work). Travel services reported an unemployment figure for the first time in a very long time, so while it is not possible to make any comparisons to previous time frames, it is interesting to note that it is lower than the sector average.
November 2023 and 2019: Year-on-Year
There was some variability across industry groups in unemployment compared to November 2023 and 2019. At the aggregate level, the unemployment rate was higher this year than previous years, but the rate in accommodations was quite a bit lower, as it was in transportation. The unemployment rate in food and beverage services was about a percentage point higher than 2023, but only 0.5 percentage points higher than in 2019. In recreation and entertainment, this year’s unemployment rate is around 2 percentage points higher than either previous reference, suggesting that this year’s employment slump may be more concentrated in this industry group than it has been in the past.
Provincial Tourism Unemployment
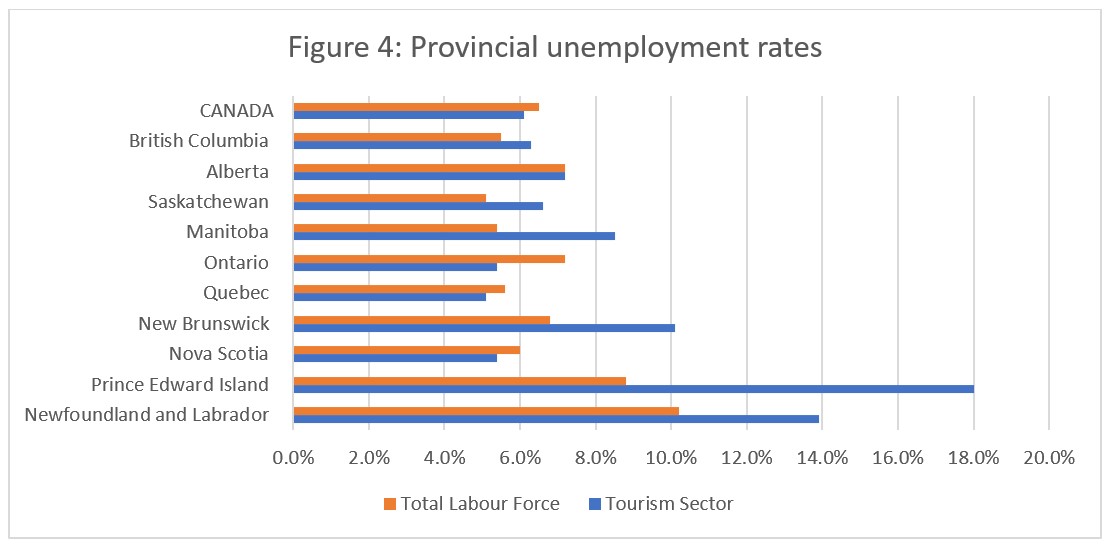
At the aggregate national level, the unemployment rate in tourism was lower than that of the national economy-wide average (see Figure 4), a pattern which was not widely seen across the provinces. Tourism unemployment rates were higher than provincial aggregate averages in most provinces, except for Nova Scotia, Quebec, and Ontario. Unemployment rates in tourism in most of the Atlantic provinces had jumped from the summer and autumn rates observed earlier this year, although clearly Nova Scotia is an exception to this regional patterns. Tourism unemployment rates were highest in Prince Edward Island (15%) and Newfoundland and Labrador (13.9%), and lowest in Quebec (5.1%) and in Nova Scotia and Ontario (both 5.4%).
View more employment charts and analysis on our Tourism Employment Tracker.
[1] As defined by the Canadian Tourism Satellite Account. The NAICS industries included in the tourism sector those that would cease to exist or would operate at a significantly reduced level of activity as a direct result of an absence of tourism.
[2] SOURCE: Statistics Canada Labour Force Survey, customized tabulations. Based on seasonally unadjusted data collected for the period of November 10 to 16, 2024.
[3] The labour force comprises the total number of individuals who reported being employed or unemployed (but actively looking for work). The total Canadian labour force includes all sectors in the Canadian economy, while the tourism labour force only considers those working in, or looking for work in, the tourism sector.
[4] Employment refers to the total number of people currently in jobs. Tourism employment is restricted to the tourism sector, while employment in Canada comprises all sectors and industries.
[5] Unemployment is calculated as the difference between the seasonally unadjusted labour force and seasonally unadjusted employment estimates. The percentage value is calculated against the labour force.
