Sector Edges Higher from September, but Gains Are Small
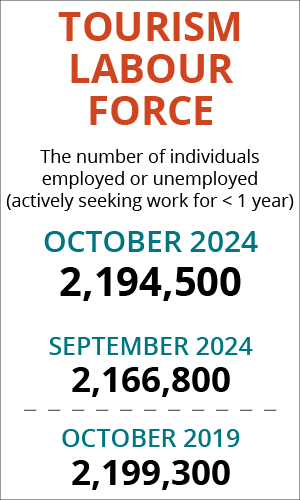
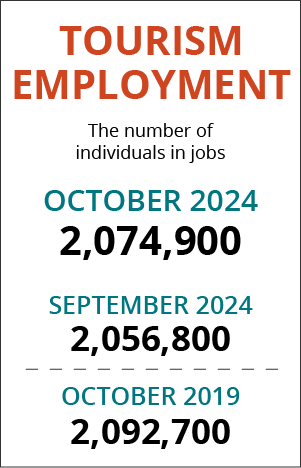
The tourism sector[1] in October 2024 saw slight gains over the previous month[2], with labour force gaining around 28,000 people (+1.3%) and employment growing by around 18,000 (+0.9%). Both indices showed growth over last year as well, but remained slightly below 2019 levels.
At the industry group level, the month-over-month changes were fairly consistent across the sector, although the picture became more varied when comparing with last year or with 2019.
Table 1 provides a snapshot of tourism’s and each of its five industry groups’ performance across labour force, employment, and unemployment, as compared with September 2024 [MoM] and October 2023 [YoY], and with October 2019 as a pre-pandemic baseline. Small arrows represent changes of less than 1%, or less than one percentage point (pp) in the case of unemployment.

Month-over-month, the labour force grew across all industry groups, while employment fell slightly in recreation and entertainment and in transportation. Unemployment was varied across industries, with the tourism unemployment rate seeing a net increase of +0.4 percentage points from September.
With respect to the state of the sector last year, both labour force and employment had grown in food and beverage services and in recreation and entertainment, but had contracted for all other industries. Unemployment rates were generally lower, except in recreation and entertainment.
The workforce remained overall smaller than it was in October 2019, but the labour force and employment numbers for recreation and entertainment and transportation showed growth.
Tourism Labour Force
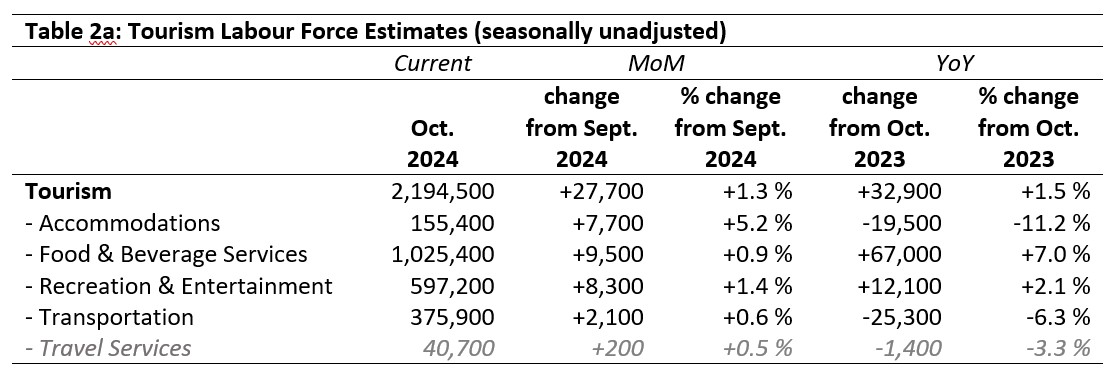
The tourism labour force[3] in October 2024 accounted for 10.0% of the total Canadian labour force, which was slightly higher than in September (+0.1 percentage points), slightly lower than one year ago (-0.1 percentage points), and 0.8 percentage points below where it was in 2019. Tables 2a and 2b provide a summary of the tourism labour force as of October.
September 2024: Month-over-Month
The overall tourism labour force saw a small increase on September, with around 28,000 people joining the labour market in the sector (+1.3%). All industry groups saw growth, ranging from +5.2% in accommodations (an addition of around 8,000 people) to a much more marginal increase of 0.6% (+2,000 people) in transportation. Travel services also reported very slight growth, and although the wild month-over-month variation of the past several months has settled down somewhat, it may still be worth treating the statistics for this industry group with some caution.
October 2023: Year-on-Year
Relative to last October, the sector’s labour force was in a stronger position, having added around 1.5% to the pool of available workers (+33,000 people). However, this net gain masks variability between the industry groups.
Accommodations remained nearly 20,000 people below where it was in 2023 (-11.2%), and transportation was likewise depressed (seeing a loss of just over 25,000 people, -6.3%). Travel services also remained slightly below where it was one year ago, but as noted, this data point should be treated with some suspicion. In contrast, food and beverage services was in a substantially stronger position than it was in October 2023, having seen a net gain of 67,000 people to the labour force (+7.0%), and recreation and entertainment also saw growth (+12,000 people, +2.1%).
October 2019: Pre-pandemic Baseline
At the sector level, the aggregate tourism labour force little changed from 2019, having regrown to 99.8% of where it was before the unprecedented disruption of the pandemic. However, as with the year-on-year comparison, the overall near-balance masks uneven trajectories of recovery across the different industry groups.
Accommodations had around 43,000 fewer people than it did in 2019 (-21.6%), and food and beverage services was likewise reduced relative to its pre-pandemic situation (-16,000 people, -1.6%), although not to the same extent as accommodations. Of course, travel services also remained enormously impacted, and although we have been treating the monthly data from this industry group cautiously, this is likely one comparison that is not wildly out of step with reality: five years on, travel services remains well below where it was. On the flip side, the labour pool for recreation and entertainment has expanded considerably since 2019, having added nearly 66,000 people (+12.4%). The labour force for transportation was likewise somewhat larger than it was five years ago, with nearly 13,000 people added to the pool of workers (+3.6%).

Tourism Employment
Tourism employment[4] in October accounted for 10.0% of all employment in Canada, and 9.4% of the total Canadian labour force was working in a tourism industry. With increases in labour force at the sector level, it is not surprising to see that employment has also risen, although not to the same extent as labour force, so there will also be movement in the unemployment estimates. Tourism employment’s share of the Canadian labour force was consistent with this September and with last October, but was around 0.9 percentage points lower than it was in October 2019. Tables 3a and 3b provide a summary of tourism employment as of October 2024.

September 2024: Month-over-Month
At the sector level, there was an increase from September of just over 18,000 people in tourism industry employment, the lion’s share of which was seen in food and beverage services (growth of +13,000 workers, an increase of 1.3%). Relative to industry size, the largest increase was in accommodations (+5.0%, amounting to nearly 7,000 people entering the industry). Travel services also reported a modest increase. Transportation saw a very slight decline of around 1,400 people (-0.4%), while recreation and entertainment was essentially unchanged from the previous month.
October 2023: Year-on-Year
Employment in the tourism sector was around 1.8% higher than it was one year ago, with a net gain of 37,000 people in the aggregate. Food and beverage services gained around 68,000 workers in that time (+7.6%), while accommodations and transportation saw considerable losses in their workforces (-10.4% and -5.1%, respectively). Recreation and entertainment saw much more modest changes.
October 2019: Pre-pandemic Baseline
At the sector level, employment had reached 99.2% of the employment levels seen in October 2019, an aggregate which averages out very strong gains in recreation and entertainment (+51,000 workers, a growth of 10.2%) and transportation (+16,500 workers, +4.7%) with substantial losses in accommodations (-41,000, -22.1%), food and beverage services (-20,000, -2.1%) and travel services (-24,000, -37.5%). As we noted with the labour force discussion, although we should exercise caution when looking at data relating to this industry group, the order of magnitude of the difference between pre-pandemic employment and the current state of the industry group has remained fairly stable over time, so we can have some degree of confidence that employment in travel services remains well below where it was five years ago.

Part-time vs. Full-time Employment
The ratio of part-time to full-time work provides an interesting perspective on the types of employment that people pursue in tourism, and a longitudinal view gives some insight into the stability of the workforce as it adjusts to the post-pandemic employment context. Figure 1 provides an overview of the percentage of part-time employment across the industry groups, using Statistics Canada’s definition of full-time employment (working 30 hours or more per week).
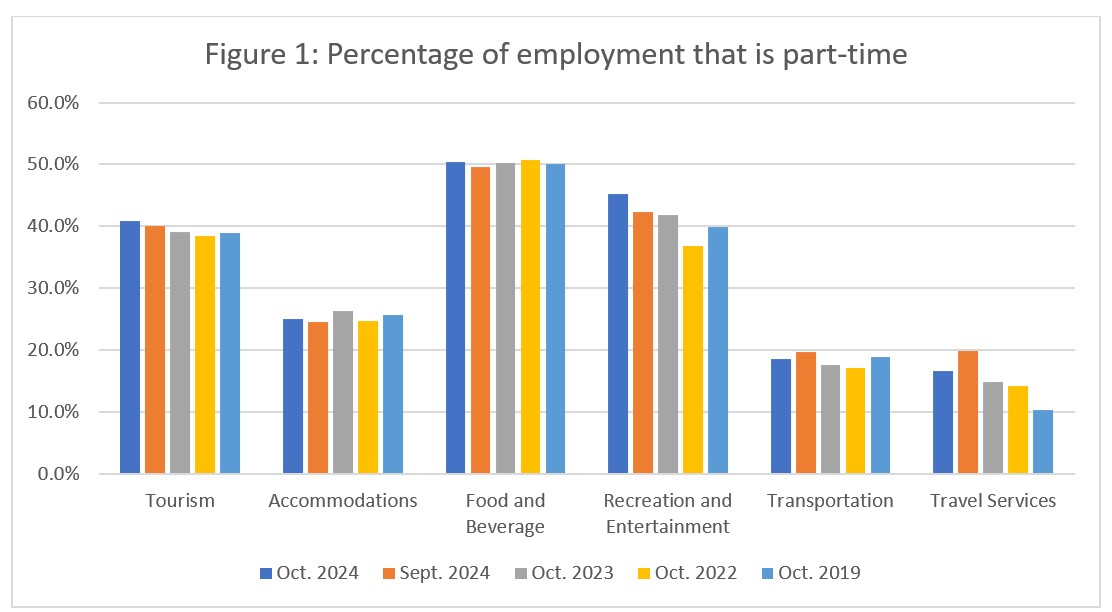
There was a slight shift from September to October towards more part-time work across the sector as a whole (+0.9 percentage points), and the October 2024 level was not far removed from what we have seen over the past several years, or in 2019. In both accommodations and food and beverage services, the pattern was much the same, with a slight month-over-month increase in the share of work that was part-time, but overall levels have held steady. Transportation showed slightly more year-over-year volatility recently, but has tended to stay within a few percentage points of a steady mean. Recreation and entertainment has seen a substantial shift towards higher rates of part-time employment, as has travel services. These may reflect longer-term trends for these two industry groups, while the others are returning to a more stable configuration that closely matches the state of things before the pandemic.
Hours worked
Another useful metric to assess the stability of the labour market is the total hours worked (see Figure 2). This index can be more immediately responsive to shifts in consumer demand than raw employment figures alone, as employers are able to scale hours up (or down) in response to customer demand more quickly and easily than they can hire or fire personnel.
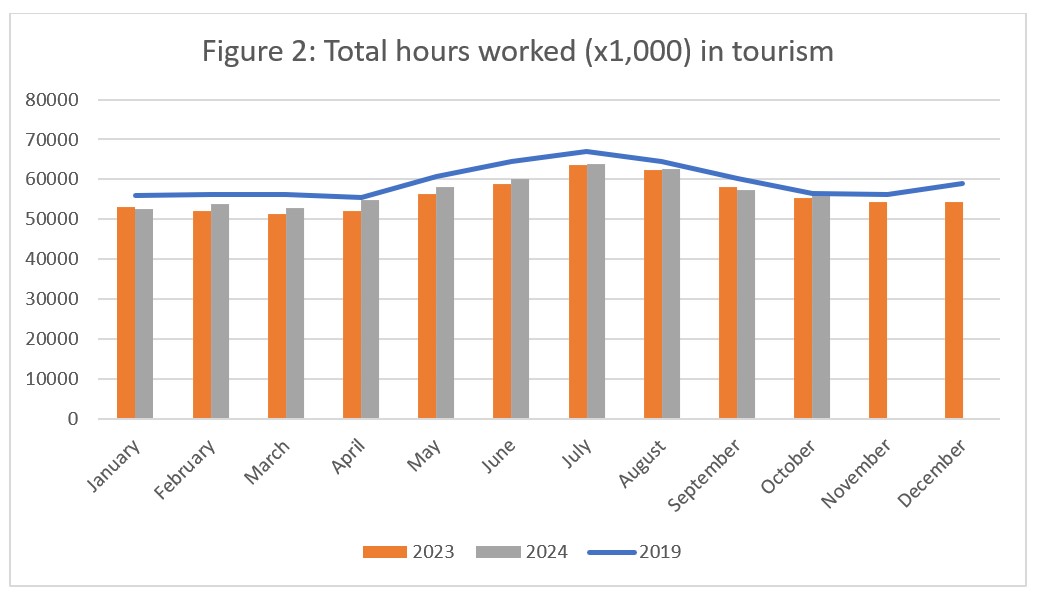
There was a decrease from September in the total number of hours worked, as the sector entered the pre-holiday/New Year dip, a pattern which closely parallelled 2023 and 2019 trends. Hours in October 2024 were slightly higher than they were in 2023, and the gap between 2024 and 2019 has narrowed to 1.3%, which is slightly higher than the gap between employment estimates for 2024 and 2019. However, given the slight increase in part-time employment, this is not entirely unsurprising: it suggests that more people are, on average, working slightly fewer hours.
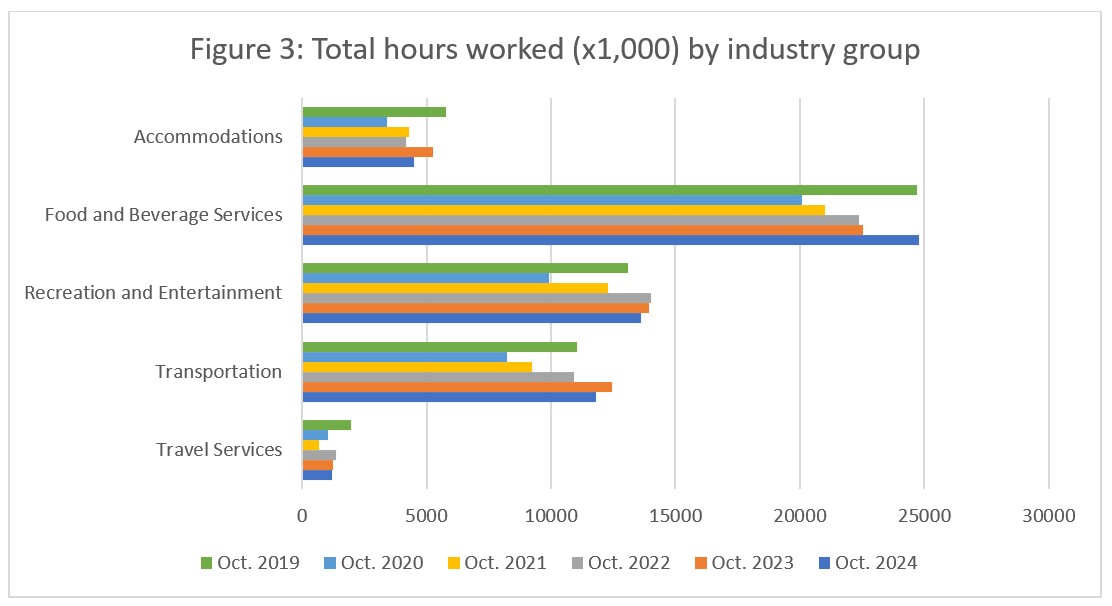
At the industry group level (see Figure 3), the year-on-year perspective shows some variation in trends. The overall year-on-year increase in hours worked is entirely due to a surge (+10.1%) in food and beverage services from 2023 to this year, while all other industry groups saw a fall in hours worked over the past year. Relative to 2019, food and beverage services reached parity (+0.3%), while transportation increased overall hours worked (+6.7%), as did recreation and entertainment (+3.9%). Accommodations remained around 22.4% below 2019 hours worked, and travel services was around 39.4% below. Year-over-year trends of post-pandemic regrowth have tapered off for all but food and beverage services.
Unemployment
The unemployment rate[5] in the tourism sector in October 2024 was 5.4%, around 0.5 percentage points lower than the national economy-wide average (5.9%, calculated using seasonally unadjusted data). The tourism unemployment rate was slightly higher than last month, but below where it was a year ago. The tourism unemployment rate in October was highest in recreation and entertainment, and lowest in transportation. Table 4 provides tourism unemployment rates across four of the five industry groups; because of its small size relative to the sector overall, and because of the sampling size of the LFS, unemployment data for travel services is unavailable.

September 2024: Month-over-Month
In October, there were almost 120,000 people without work in the tourism labour force, with the largest numbers reported in food and beverage services and in recreation and entertainment. Likely these numbers reflect either restricted geographic mobility—unemployed people in one area being unable or unwilling to move for work—and/or a mismatch between the skills needed to fill current vacant positions and the training and experience of those looking for work. The unemployment rate rose from September for recreation and entertainment (+1.5 percentage points) and for transportation (+0.9 percentage points), was essentially unchanged for accommodation (+0.1 percentage points), and fell slightly for food and beverage services (-0.4 percentage points).
October 2023 and 2019: Year-on-Year
The sector-level unemployment rate was slightly lower this month than it was last year (-0.3 percentage points), but slightly higher (+0.6 percentage points) than in 2019. The unemployment rate had come down from last year in accommodations, in food and beverage services, and in transportation, while it had come up in recreation and entertainment.
Provincial Tourism Unemployment
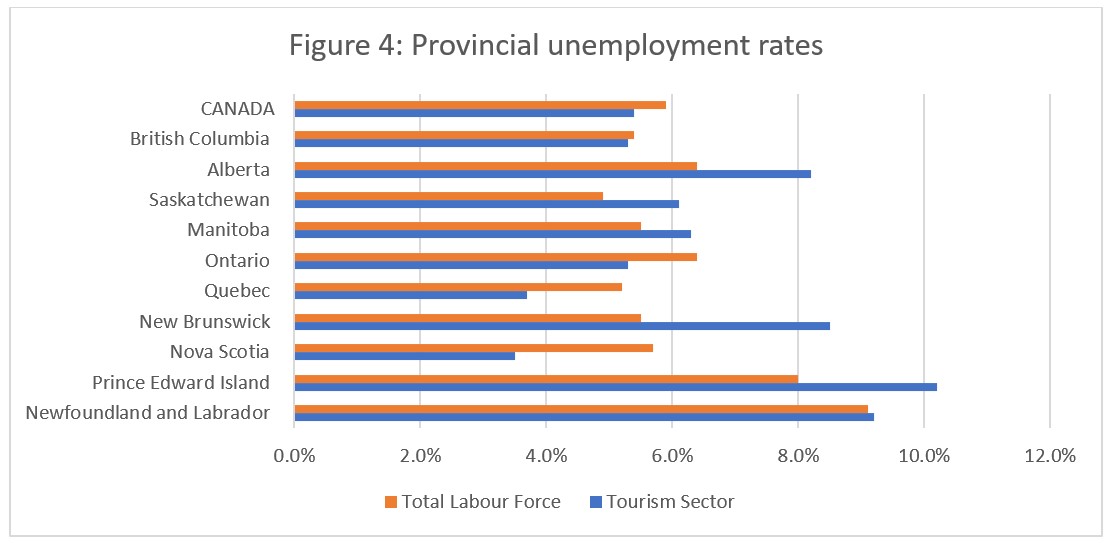
At the aggregate national level, the unemployment rate in tourism was lower than that of the national economy-wide average (see Figure 4), a pattern which held true for British Columbia, Ontario, Quebec, and Nova Scotia. In the remaining provinces, the tourism unemployment rate was higher than that of its equivalent economy-wide average.
The tourism unemployment rate was highest in Prince Edward Island (10.2%) and Newfoundland and Labrador (9.2%), and lowest in Quebec (3.7%) and Nova Scotia (3.5%). Tourism unemployment rates were generally higher in the Atlantic provinces, except for Nova Scotia, although it is interesting to note the high tourism unemployment rate in Alberta (8.2%). This may be a long-term effect of the wildfire season; in September, tourism unemployment was also elevated in Alberta, but so was the overall provincial level of unemployment—in the past month, the gap between the two indices has grown from 0.2 percentage points in September to 1.8 percentage points in October. It will be interesting to see if this high unemployment rate in tourism persists into the winter season.
View more employment charts and analysis on our Tourism Employment Tracker.
[1] As defined by the Canadian Tourism Satellite Account. The NAICS industries included in the tourism sector those that would cease to exist or would operate at a significantly reduced level of activity as a direct result of an absence of tourism.
[2] SOURCE: Statistics Canada Labour Force Survey, customized tabulations. Based on seasonally unadjusted data collected for the period of October 13 to 19, 2024.
[3] The labour force comprises the total number of individuals who reported being employed or unemployed (but actively looking for work). The total Canadian labour force includes all sectors in the Canadian economy, while the tourism labour force only considers those working in, or looking for work in, the tourism sector.
[4] Employment refers to the total number of people currently in jobs. Tourism employment is restricted to the tourism sector, while employment in Canada comprises all sectors and industries.
[5] Unemployment is calculated as the difference between the seasonally unadjusted labour force and seasonally unadjusted employment estimates. The percentage value is calculated against the labour force.
