Summer Cools Down Slightly from July
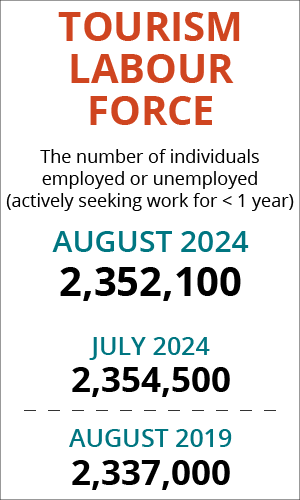
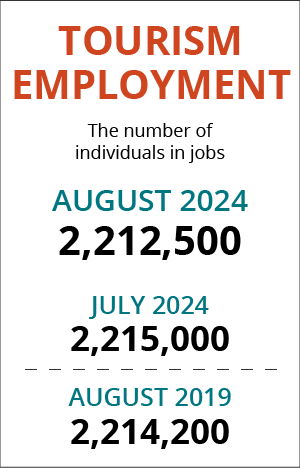
August is generally a busy month for travel, although labour force and employment in the tourism sector[1] contracted very slightly from July[2]. Both indices were higher this August than in 2023, and while labour force surpassed pre-pandemic levels (at 100.65% of 2019), employment did not quite reach those levels—although it came very close (99.9% of 2019).
At the industry group level, the profile overall showed more variability, and it is likely that at least some of the volatility reflects the impacts of wildfires that raged out of control in key tourism destinations in Alberta and British Columbia. It interesting to note, however, that recreation and entertainment—which saw substantial losses from July—saw its most substantial employment decreases in Ontario, rather than out west, so there are clearly multiple factors driving the patterns noted here.
Table 1 provides a snapshot of tourism’s and each of its five industry groups’ performance across labour force, employment, and unemployment, as compared with July 2024 [MoM] and August 2023 [YoY], and with August 2019 as a pre-pandemic baseline. Small arrows represent changes of less than 1%, or less than one percentage point (pp) in the case of unemployment.
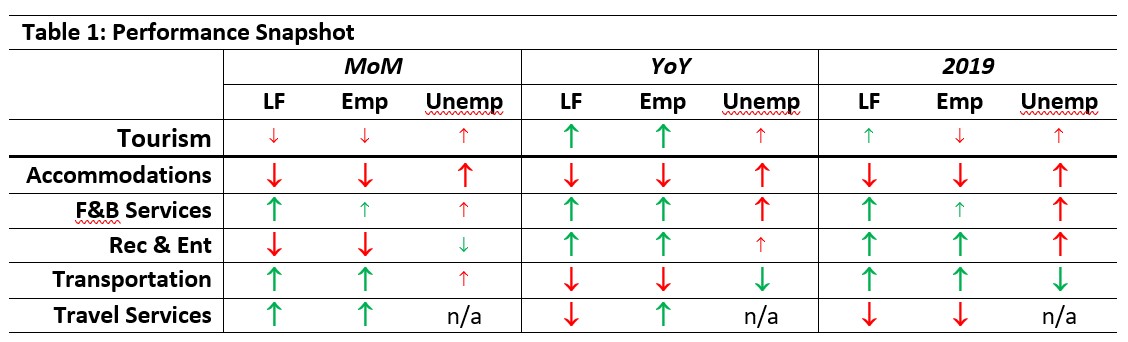
Month-over-month growth was inconsistent, with food and beverage services and transportation showing improvement, but accommodations and recreation and entertainment losing ground.
Year-on-year, the picture is equally varied, with accommodations and transportation seeing losses, while food and beverage services and recreation and entertainment grew.
Worth noting is that food and beverage services, recreation and entertainment, and transportation were all in a stronger position than in August 2019—surpassing the pre-pandemic labour force and employment levels for that month.
As noted in previous Labour Force Survey snapshots, the data on travel services has been fluctuating more than the industry’s labour market is likely to be changing, so although the changes from July into August are modest, there is some overall doubt as to the accuracy of sampling for this industry group within the larger Labour Force Survey. The data is included throughout this snapshot, but is not discussed in any detail, and should not be considered particularly accurate.
Tourism Labour Force
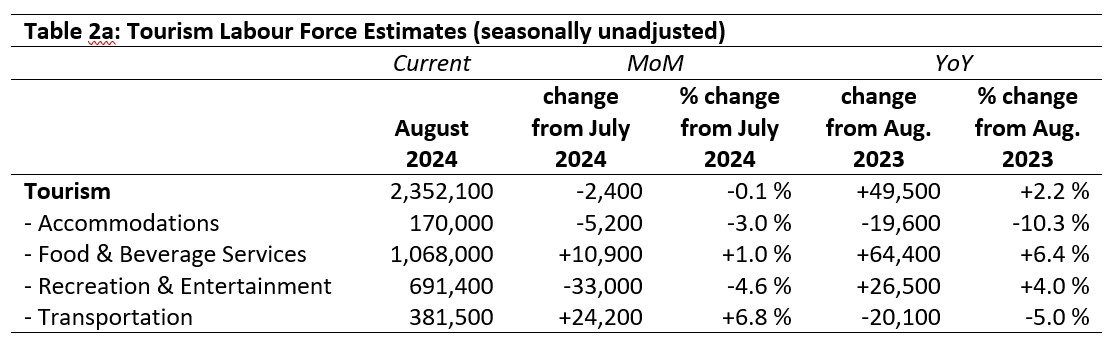
The tourism labour force[3] in August 2024 accounted for 10.5% of the total Canadian labour force, which is 0.1 percentage point below July, and 0.8 percentage points below where it stood in 2019. Tables 2a and 2b provide a summary of the tourism labour force as of August.
July 2024: Month-over-Month
The overall tourism labour force saw a slight decline (-0.1%) from July, which amounted to a net loss of 2,400 people. The largest loss was seen in recreation and entertainment, reversing the trend of growth seen over the past several months; accommodations also saw a decline of 5,200 people, a considerable reversal from the gains seen in July. Transportation saw considerable increases (+24,200 people), as did food and beverage services (+10,900 people).
August 2023: Year-on-Year
Relative to last August, the sector’s labour force had grown by around 2%, representing nearly 50,000 people newly available for work in tourism. The bulk of the growth was in food and beverage services, which saw year-over-year growth of over 6%. Recreation and entertainment likewise saw considerable gains. On the other hand, transportation remained 20,000 people below its 2023 number, with accommodations only slightly behind it. The accommodations industry has been struggling to rebuild following the pandemic, and transportation has seen some month-over-month variability that may be tied to larger labour issues the industry is facing.
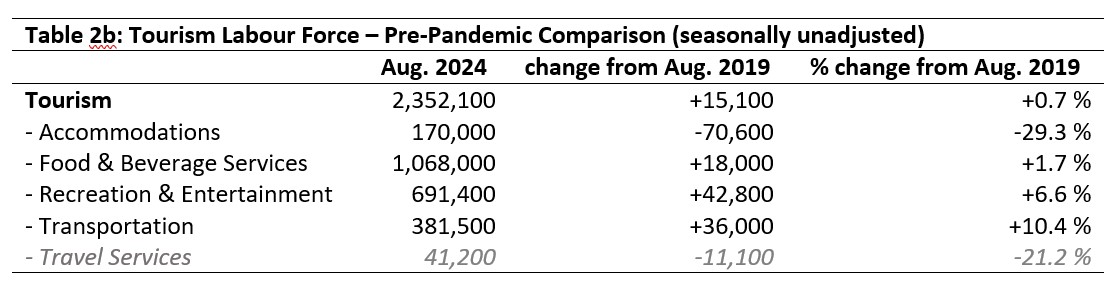
August 2019: Pre-pandemic Baseline
At the sector level, the tourism labour force surpassed August 2019 levels, albeit by a very slim margin. It had around 15,000 more people this year than five years ago, with most industry groups being in a stronger position. Accommodations remained below pre-pandemic levels, a shortfall of over 70,000 people (nearly 30% below 2019). In contrast, recreation and entertainment and transportation both showed very healthy gains, and although food and beverage services saw smaller growth, it nevertheless had surpassed its August 2019 highwater mark.
Tourism Employment
Tourism employment[4] accounted for 10.7% of all employment in Canada, and 9.9% of the total Canadian labour force was working in a tourism industry. Tourism employment levels remained steady from July and from last August, and were slightly higher (+0.2 percentage points) than August 2019. Tourism’s share of the employed Canadian labour force was slightly below where it was in July and last August (-0.1 percentage points) and remained 0.8 percentage points below 2019. Tables 3a and 3b provide a summary of tourism employment as of August 2024.
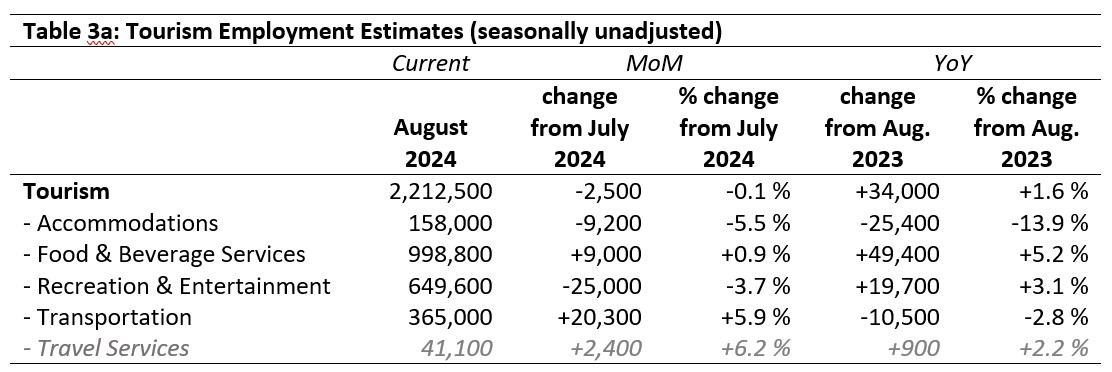
July 2024: Month-over-Month
The changes in the tourism employment level closely paralleled those noted in the labour force, with food and beverage services and transportation showing some gains (+0.9% and +5.9%, respectively) and accommodations and recreation and entertainment seeing losses. The loss in recreation and entertainment was the largest overall change, followed by the gains in transportation. Changes in other industry groups were more modest, but still indicate overall volatility in employment across the sector. It is likely that employment in outdoor recreation is particularly sensitive to seasonal extremes, and August 2024 may have seen considerable climate-related displacement of workers.
August 2023: Year-on-Year
The tourism sector on the whole saw gains of 34,000 people in employment since last year, reflecting growth in food and beverage services (+5.2%) and recreation and entertainment (+3.1%) that surpassed the losses in accommodations (-13.9%) and transportation (-2.8%).
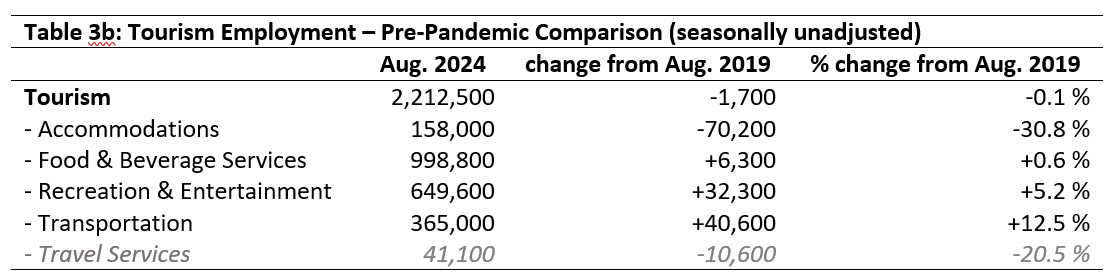
August 2019: Pre-pandemic Baseline
Employment across the sector didn’t quite surpass 2019 levels, although it came very close, reaching 99.9% of where it was in August 2019. Accommodations remained substantially below pre-pandemic employment (-70,000 workers, a decrease of over 30%), while transportation gained just over 40,000 people (+12.5%) and recreation and entertainment added over 32,000 people (+5.2%). Travel services reported a loss of just over 10,000 people, but as noted previously, the reliability of estimates for this industry group is questionable, although it is likely that its employment levels were depressed relative to pre-pandemic baselines.
Part-time vs. Full-time Employment
The ratio of part-time to full-time work provides interesting insights into the stability of the workforce and may signal long-term trends towards new working arrangements post-pandemic. Figure 1 provides an overview of the percentage of part-time employment across the industry groups, using Statistics Canada’s definition of full-time employment (working 30 hours or more per week).
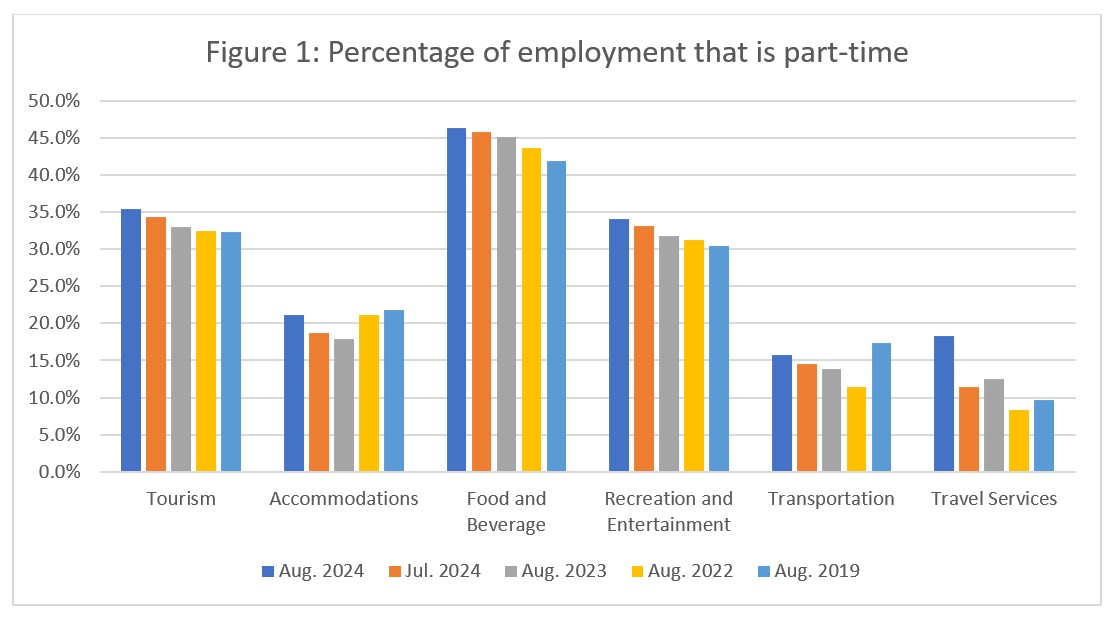
Part-time work was elevated across all industry groups from July, and was also a higher share of overall employment from last year. This may suggest young workers (students in particular) beginning to shift back to part-time work, although the timing is not obviously motivated by a return to school.
Across the sector as a whole, the share of part-time work was elevated by around 3 percentage points from 2019, but was closer to 5 percentage points in food and beverage services and 4 percentage points in recreation and entertainment. Part-time work in accommodations narrowed the gap with 2019, as did transportation. This generalized successive increase in part-time work suggests some kind of realignment of working conditions, although looking only at August does not permit a full picture of the extent of this realignment. It may be something particular to this time of year, or it may be part of a larger shift. The past few LFS analyses have also noted a general trend of increasing part-time employment, so this may be an area that needs further investigation: if there is a shift underway, what are the long-term effects this will have on labour market dynamics across the sector?
Hours worked
Another useful metric to assess the stability of the labour market is the total hours worked (see Figure 2), as this index can be more immediately responsive to shifts in consumer demand than raw employment figures alone. This is particularly true where part-time employment is relatively high, as employers can scale work hours in response to demand more quickly (and more easily) than they can hire or fire staff.
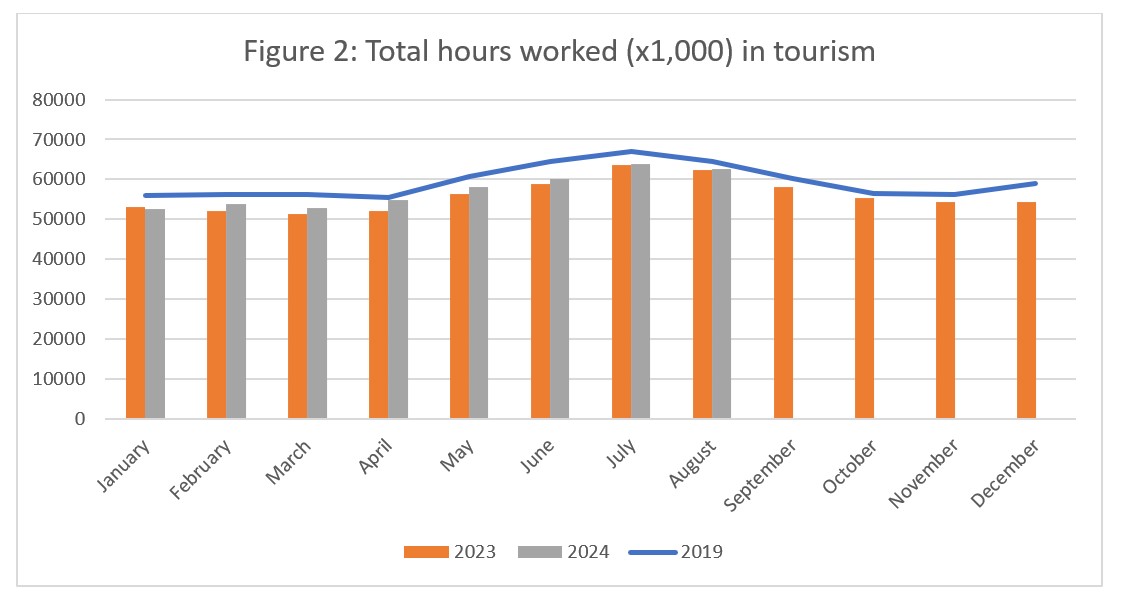
The total hours worked across the sector in August saw a slight decrease from July (-1.7%), which aligns with the increase in part-time work over the same period. The total was essentially unchanged from last year, and remained below 2019 levels, although the gap between 2024 and 2019 has narrowed slightly. Nevertheless, this pattern looks as though overall growth towards pre-pandemic levels is stagnating—and seems unlikely to rebound much further without some other external factor acting on the system.
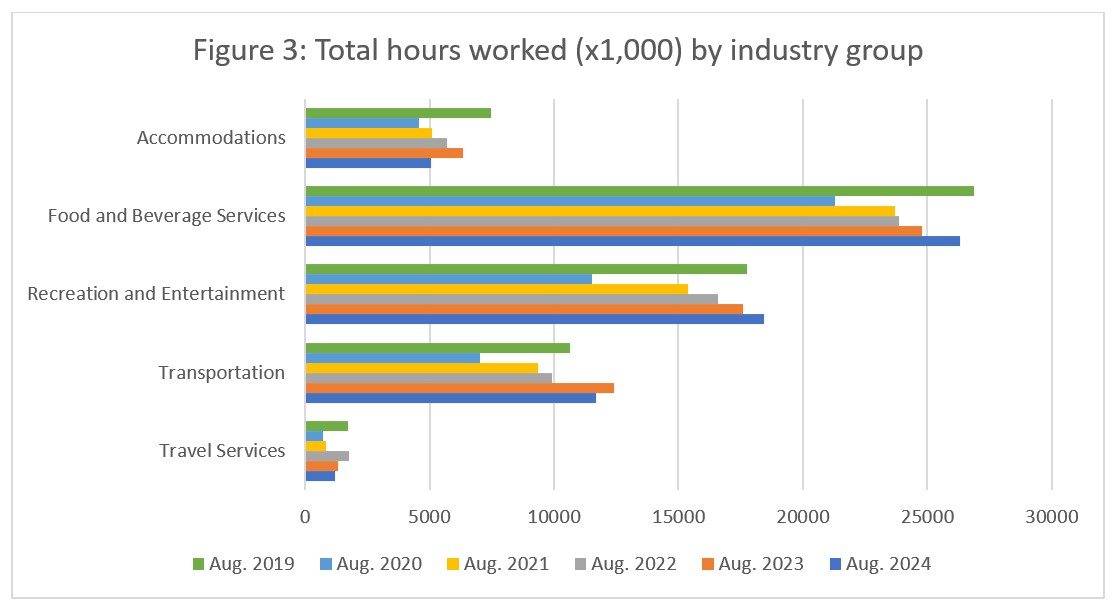
At the industry group level (see Figure 3), the year-on-year perspective shows monotonic increases since the pandemic for most industry groups, although accommodations saw a marked decrease (-20.5%) from August 2023, further widening the gap between 2019 and current conditions. Transportation also saw a much more modest decrease from 2023 (-5.7%), but its total hours worked remained higher than in 2019. Hours worked also surpassed 2019 levels in recreation and entertainment, which has generally shown a strong performance all year across most indices, making the slight contraction across this industry group in August more interesting. Longer-term monitoring of trends across this industry is needed to tell if this slowdown is the beginning of a change in recreation and entertainment employment conditions, or if it is an artefact of external pressures that will be corrected over time.
Unemployment
The unemployment rate[5] rate in the tourism sector in August 2024 was 5.9%, around 1.6 percentage points below the national economy-wide average (7.5%, calculated using seasonally unadjusted data). The sector saw around 140,000 people unemployed but looking for work, unchanged from July. This is as expected, given that both labour force and employment numbers fell. Table 4 provides a summary of tourism unemployment rates in August.
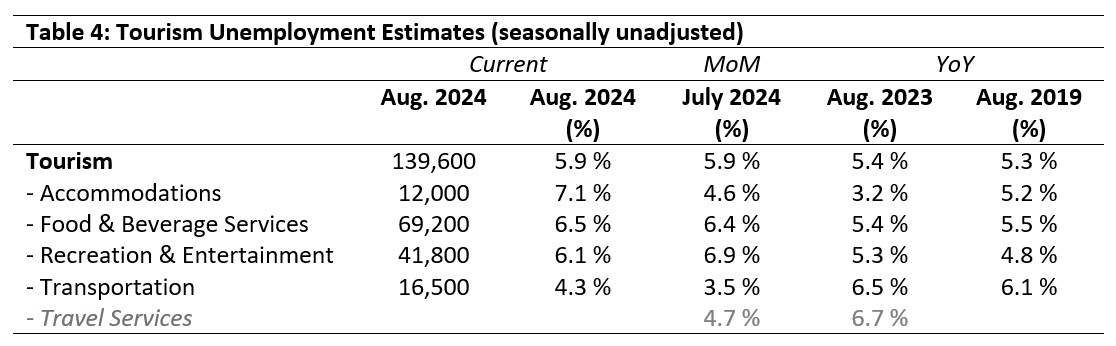
July 2024: Month-over-Month
The unemployment rate in tourism held steady from July, although there was some movement at the level of industry groups. The largest rise in unemployment rates was in accommodations (+2.5 percentage points), while the unemployment rate fell by 0.8 percentage points in recreation and entertainment. Transportation posted the lowest unemployment rate overall, while accommodations posted the highest.
August 2023 and 2019: Year-on-Year
For the most part, unemployment rates across the industry groups were higher than they were in August 2023, except for transportation, which fell by 3 percentage points year-on-year. The tourism sector overall had a lower unemployment rate in August 2023 and 2019 than that of the broader national economy (6.3% and 6.4% respectively, seasonally unadjusted), which likely reflects the summer surge in employment for many tourism enterprises. Relative to 2019, unemployment rates were generally higher in August 2024, except for transportation.
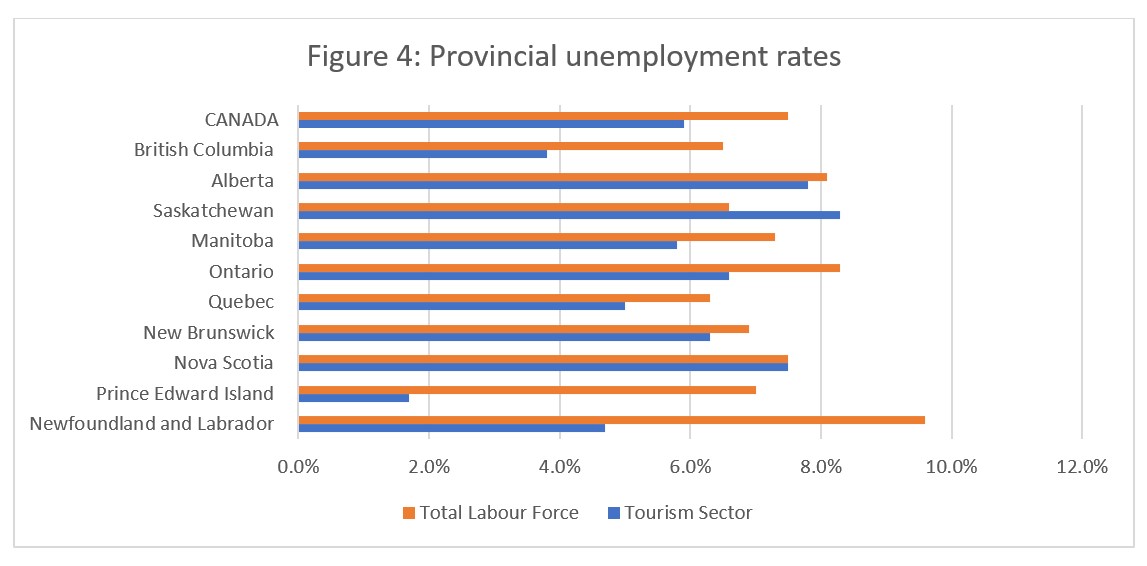
Provincial Tourism Unemployment
At the aggregate national level, the unemployment rate in tourism was lower than that of the national economy-wide average (see Figure 4), a pattern which held true for all provinces except Saskatchewan (where tourism unemployment was 1.7 percentage points higher) and Nova Scotia (where the two figures were tied). The tourism unemployment rates were highest in Saskatchewan (8.3%) and Alberta (7.8%), and lowest in British Columbia (3.8%) and Prince Edward Island (1.7%).
View more employment charts and analysis on our Tourism Employment Tracker.
[1] As defined by the Canadian Tourism Satellite Account. The NAICS industries included in the tourism sector those that would cease to exist or would operate at a significantly reduced level of activity as a direct result of an absence of tourism.
[2] SOURCE: Statistics Canada Labour Force Survey, customized tabulations. Based on seasonally unadjusted data collected for the period of August 11 to 17, 2024.
[3] The labour force comprises the total number of individuals who reported being employed or unemployed (but actively looking for work). The total Canadian labour force includes all sectors in the Canadian economy, while the tourism labour force only considers those working in, or looking for work in, the tourism sector.
[4] Employment refers to the total number of people currently in jobs. Tourism employment is restricted to the tourism sector, while employment in Canada comprises all sectors and industries.
[5] Unemployment is calculated as the difference between the seasonally unadjusted labour force and seasonally unadjusted employment estimates. The percentage value is calculated against the labour force.