Pre-Pandemic Gap Narrows with Strong Growth in Labour Force and Employment
Overall, the tourism sector[1] in May saw substantial growth over the previous month[2], representing the first surge of the summer period when post-secondary students re-enter the workforce and/or increase their hours. The sector was in a generally stronger position than in May 2023, and the gap between the current state of the sector and where it was in 2019 narrowed to around 1%.
At the industry group level, the profile overall was fairly consistent, with a few outliers.
Table 1 provides a snapshot of tourism’s and each of its five industry groups’ performance across labour force, employment, and unemployment, as compared with April 2024 [MoM] and May 2023 [YoY], and with May 2019 as a pre-pandemic baseline. Small arrows represent changes of less than 1%, or less than one percentage point (pp) in the case of unemployment.
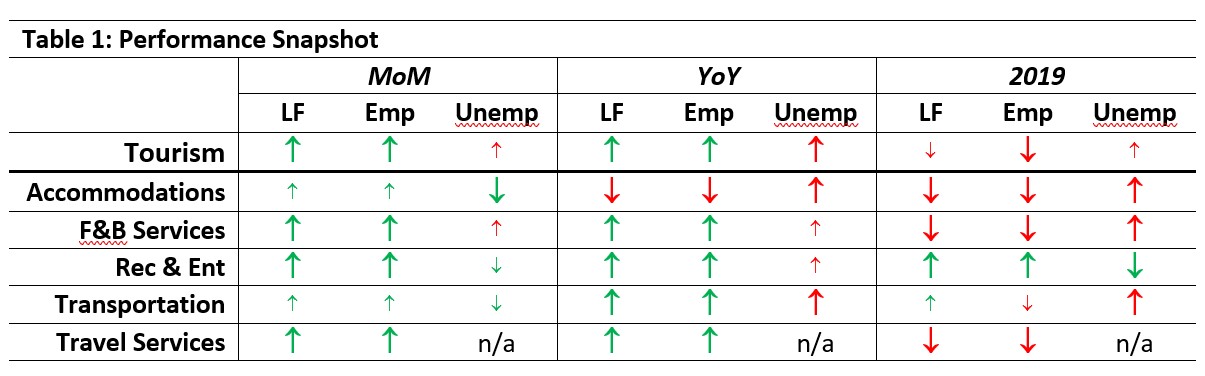
All sectors grew over April, and most (except for accommodations) also grew over May 2023. Month-over-month labour growth was strongest in recreation and entertainment (+7.6% for labour force, +8.1% for employment), and smallest for transportation (+0.1% for labour force, +0.2% for employment). Only recreation and entertainment had substantially higher figures for labour force (+12%) and employment (+13.2%) than in 2019. Transportation saw a very slight increase in labour force (+0.4%), offset by a drop in employment (-0.7%). Unemployment generally fell from April, but was higher than last year or in 2019.
Tourism Labour Force
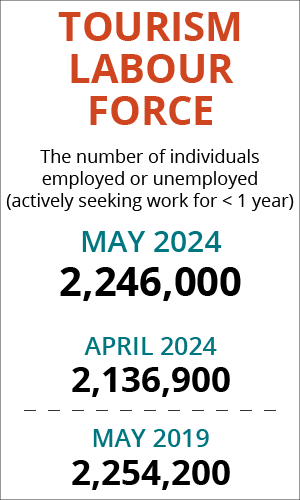
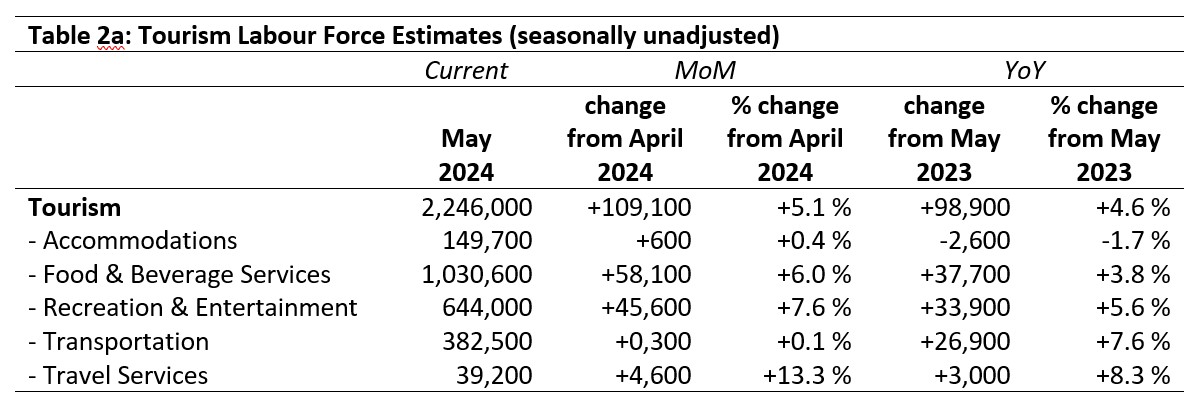
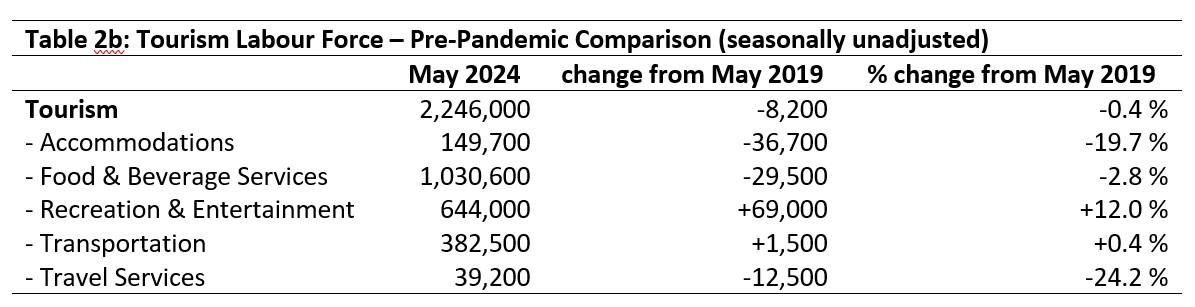
The tourism labour force[3] in May 2024 accounted for 10.2% of the total Canadian labour force, around 0.4 percentage points higher than in April but nearly a full percentage point below May 2019. Overall, the sector’s labour force was 99.6% of its size in May 2019. Tables 2a and 2b provide a summary of the tourism labour force as of May 2024.
April 2024: Month-over-Month
The overall tourism labour force increased by nearly 100,000 people, an increase from April of 5%. Transportation and accommodations saw very little growth over last month, while food and beverage services, recreation and entertainment, and travel services saw much more substantial increases. The largest absolute increase was in recreation and entertainment, which saw an additional 45,000 people enter the labour force. The increase in travel services was on par with fluctuations we have noted over the past year on a fairly regular basis, suggesting that this industry group—likely because of its relatively small size compared to the sector as a whole—is not reliably reflected in the Labour Force Survey (LFS) instrument. While there may be volatility within the workforce, it is unlikely to be as dynamic as the longitudinal LFS data seems to suggest. It is more likely that this is an artifact of the sample size, which can artificially inflate or exaggerate small changes as the sample distribution is scaled up to estimate the full the economy.
May 2023: Year-on-Year
Compared to last May, the sector was also in a much stronger position, having grown by around 4.6% (a net increase of nearly 99,000 people). All industry groups posted a gain except for accommodations, which saw a net loss of 2,600 people (-1.7%). As noted above, the increase reported in travel services should be treated with some suspicion. Food and beverage services saw the largest absolute increase (nearly 38,000), and transportation saw the largest relative increase (+7.6%), setting aside travel services.
May 2019: Pre-pandemic Baseline
The sector’s overall labour force remained around 8,200 below where it was in May 2019, a net loss of only 0.4%. Recreation and entertainment saw the addition of a substantial number of workers over the intervening five years (+69,000; +12%), while transportation saw a much more modest increase of 1,500 people (+0.4%). All other industry groups saw a net decrease in their labour force, with the largest being seen in accommodations, where nearly 37,000 people had left the labour force. Travel services remained 12,000 below its 2019 levels, a loss of around 24%.
Tourism Employment
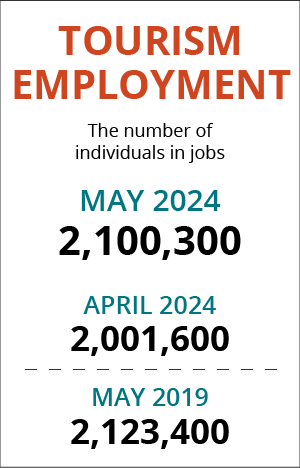
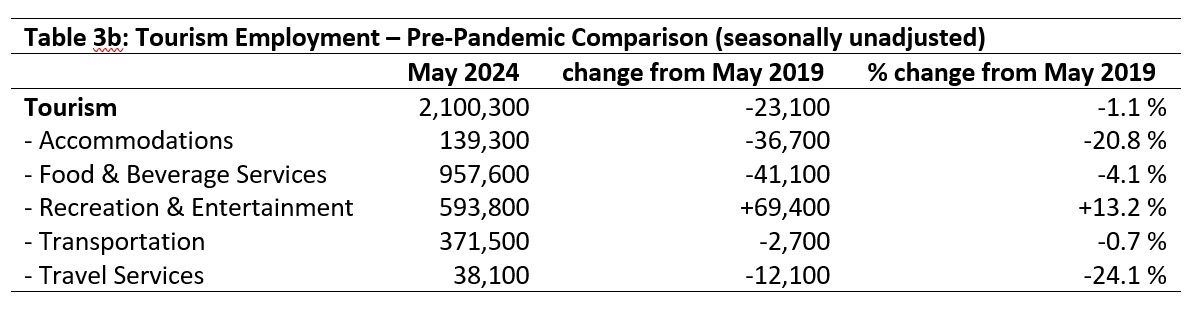
Tourism employment[4] accounted for 10.1% of all employment in Canada, and around 9.5% of the Canadian labour force worked in a tourism industry. Tourism’s share of the Canadian labour force increased by 0.4 percentage points from April, while its share of employment grew by 0.3 percentage points. Both indices were close to the numbers reported in May 2023, but remained nearly 1 percentage point below 2019 levels. Tourism employment was overall 98.9% of what it was in May 2019. Tables 3a and 3b provide a summary of tourism employment as of May 2024.
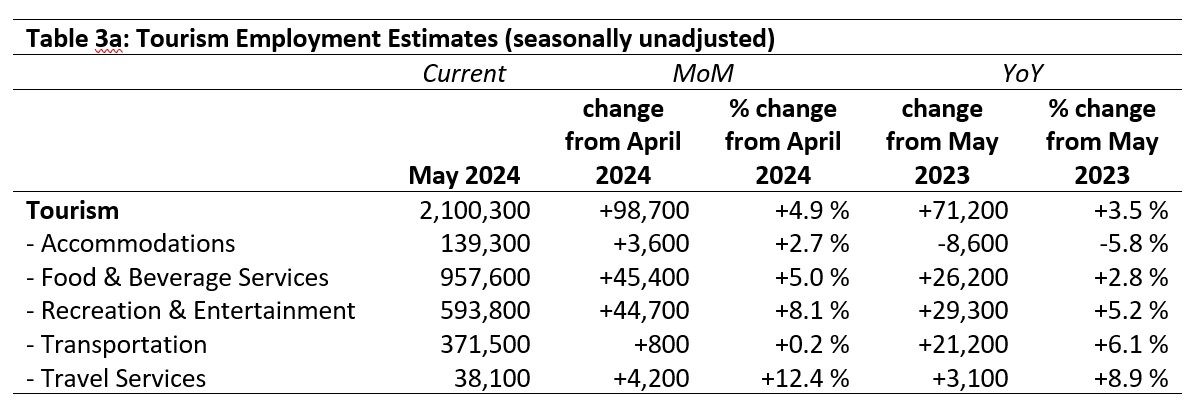
April 2024: Month-over-Month
Since April, employment in tourism overall grew by nearly 99,000 people, an increase of 4.9%. All industries saw growth in employment, with food and beverage services and recreation and entertainment each adding over 44,000 workers. Transportation saw fewer than 1,000 workers added, while accommodations saw a more modest growth of 2.5% (3,600 workers). Travel services posted 12.4% growth, but as noted in the Labour Force section above, this is likely to be an artifact arising out of the survey sampling.
May 2023: Year-on-Year
Compared to last year, the sector’s position had strengthened, posting a 3.5% increase in employment. This was reflective of growth across most industry groups, except for accommodations, which saw a loss of 8,600 workers (-5.8%). The largest absolute gains were seen in recreation and entertainment, which added nearly 30,000 people to its workforce. Aside from travel services (which, as previously mentioned, is likely not an accurate snapshot of the industry’s profile), the strongest relative growth was in transportation, which saw an increase of 6.1% over May 2023.
May 2019: Pre-pandemic Baseline
Employment in tourism remained around 1.1% below where it was in 2019, a loss of just over 23,000 workers. Recreation and entertainment alone outperformed its pre-pandemic employment levels, with a net gain of over 69,000 workers (+13.2%). Transportation saw the smallest losses, at only 0.7% below its 2019 levels (-2,700 workers). Accommodations and food and beverage services were both substantially below 2019, with accommodations in particular feeling the pressure with the loss of one-fifth of its pre-pandemic workforce.
Part-time vs. Full-time Employment
The stability of the ratio of part-time to full-time work provides interesting insights into the workforce dynamics of the sector. Figure 1 provides an overview of the percentage of part-time employment across the industry groups, using the Statistics Canada definition of part-time work as being fewer than 30 hours per week.
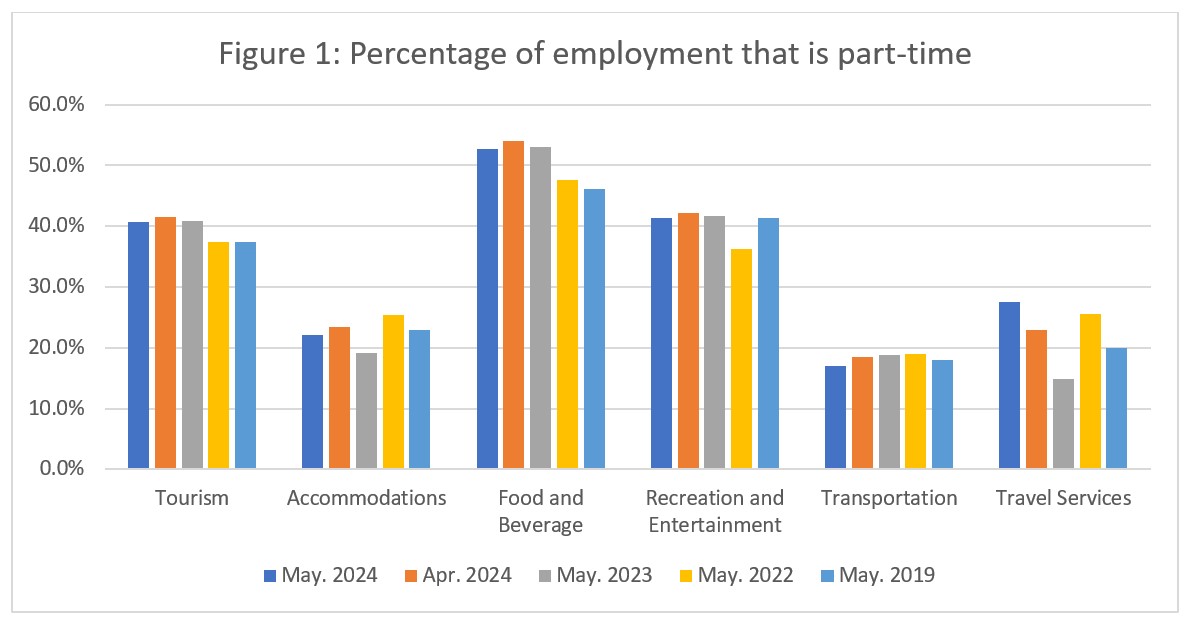
Across the sector as a whole, and in most industry groups, the ratio of part-time work fell slightly from April, which is unsurprising given that May marks the start of the summer surge. Many post-secondary students who had been working part-time throughout the academic year will have taken up full-time hours, so this shift is as anticipated.
Travel services saw an increase in the share of work that was part time, which runs counter to the broader trends, but given the small sample size, this may not be a particularly reliable index of the state of the industry group. Food and beverage services has seen a shift over the past few years towards a higher percentage of part-time workers overall (+6.6 percentage points since 2019), which has also pulled the sector-wide average up by around 3 or 4 percentage points.
Hours worked
The total actual hours worked within the tourism sector is another useful metric by which to assess the state of the labour market (see Figure 2), given that employers are able to scale the hours worked more easily and rapidly than they are able to change their payroll roster entirely, particularly in industries that rely heavily on part-time workers. This means that hours worked can be more sensitive to shifts in customer demand than raw employment figures.
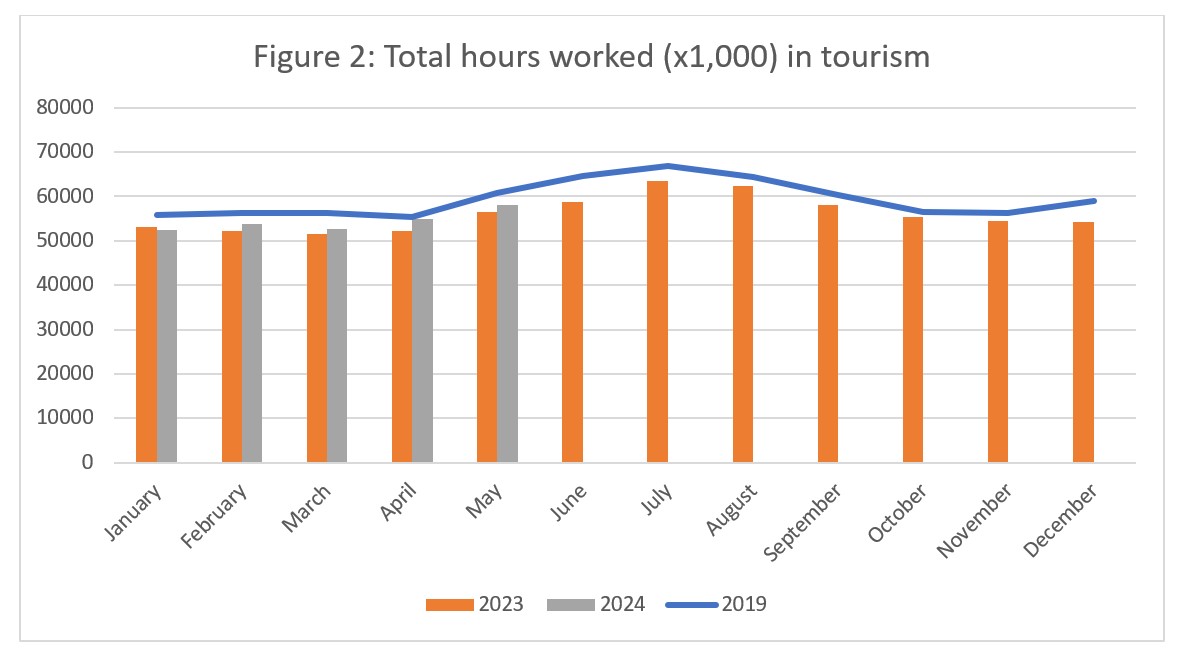
Across the sector as a whole, the total hours worked in 2024 have generally been higher than in 2023, except in January. The gap between 2023 and 2024 narrowed from April to May, but widened between 2019 and 2024. The trends for both 2019 and 2023 indicate that hours worked tend to peak in July, which corresponds with when secondary students are finished school and entering the workforce. This is also when tourism demand picks up, as families are able to travel without taking their children out of school. The curve for 2023 shows a more dramatic increase between June and July than the pre-pandemic pattern, and 2024 looks to be on track to more closely mirror the 2023 distribution. This may indicate a shift in demand trends more generally, with the summer peak period starting a month later than before the pandemic.
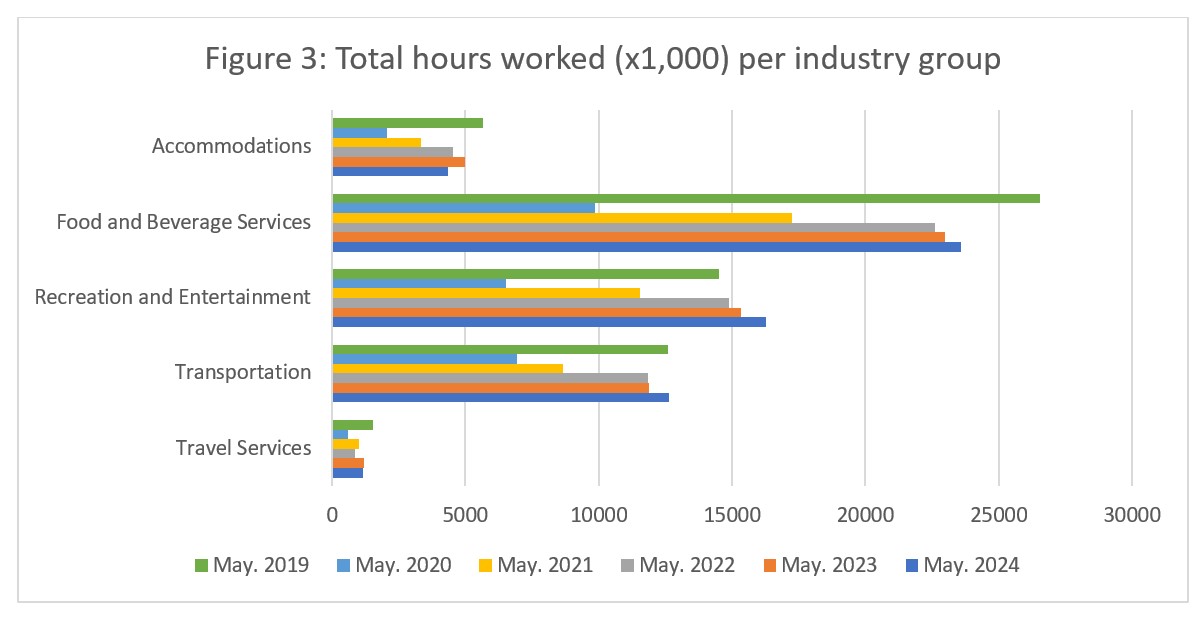
Figure 3 presents a year-over-year comparison of hours worked across the industry groups, starting in 2019. Recreation and entertainment and transportation were the only two industry groups to have surpassed 2019 hours worked in May (+12.2% and +0.4%, respectively). Accommodations saw a drop from last year, as did travel services, a reversal of the overall patterns of year-on-year growth. Food and beverage services, recreation and entertainment, and transportation all saw an increase in hours worked from last year.
Unemployment
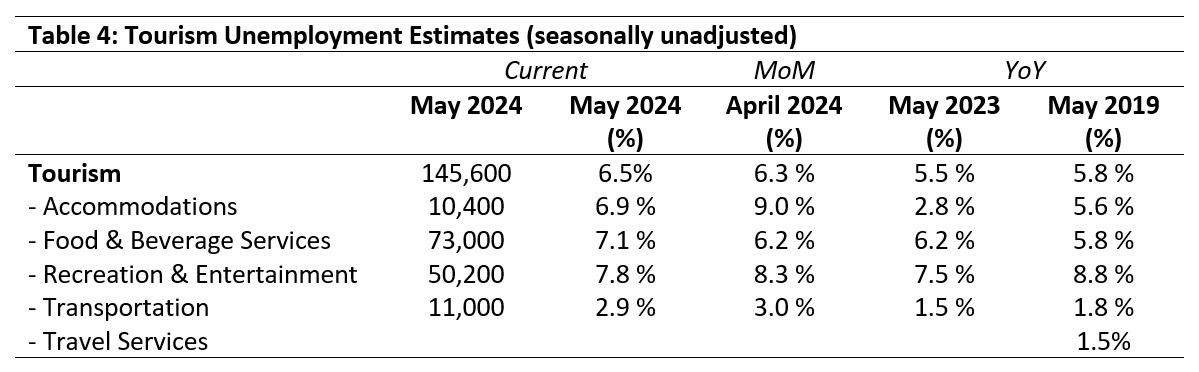
Unemployment[5] in the tourism sector in May 2024 was 6.5%, slightly higher than the economy-wide national average (6.3%, using seasonally unadjusted data). The sector unemployment rate was higher than in May 2023 or 2019. Table 4 provides a summary of tourism unemployment rates in May.
April 2024: Month-over-Month
The unemployment rate in accommodations fell substantially from April (-2.1 percentage points), as it did to a lesser extent in recreation and entertainment (-0.5 percentage points), while transportation held relatively steady (-0.1 percentage points). Unemployment grew slightly in food and beverage services. No unemployment data was available for travel services.
May 2023 and 2019: Year-on-Year
At the sector level, tourism unemployment rates were a slightly higher than in 2023 or 2019, with some variability at the industry group level. The unemployment rate in recreation and entertainment was slightly higher than last year but a full percentage point below its 2019 rate. Transportation saw a higher unemployment rate than last year or before the pandemic, as did accommodations and food and beverage services. In spite of these year-on-year differences and fluctuations, at the national level unemployment rates in tourism have largely returned to pre-pandemic magnitudes, and are nowhere near as high as they were during peak pandemic years, when unemployment rates in the range of 20-30% were frequently reported.
Provincial Tourism Unemployment
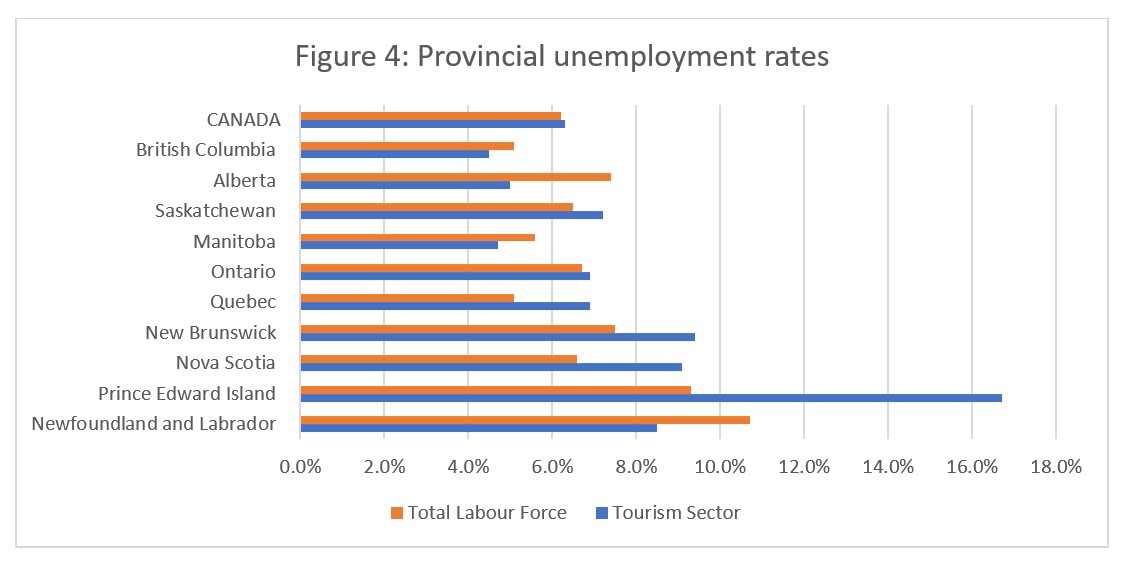
At the aggregate national level, the unemployment rate in tourism was slightly below that of the wider economy (see Figure 4), but this masks regional variation. Tourism unemployment was considerably higher in the Atlantic provinces, with the highest unemployment rates reported in Newfoundland and Labrador (15.3%) and Prince Edward Island (11.7%). The lowest unemployment rates were reported in Manitoba (3.7%) and Saskatchewan (4.8%). The unemployment rates for tourism were generally higher than those of the total provincial economic labour forces, except in Ontario, Manitoba, and Saskatchewan, where tourism unemployment rates were lower.
View more employment charts and analysis on our Tourism Employment Tracker.
[1] As defined by the Canadian Tourism Satellite Account. The NAICS industries included in the tourism sector those that would cease to exist or would operate at a significantly reduced level of activity as a direct result of an absence of tourism.
[2] SOURCE: Statistics Canada Labour Force Survey, customized tabulations. Based on seasonally unadjusted data collected for the period of May 12 to 18, 2024.
[3] The labour force comprises the total number of individuals who reported being employed or unemployed (but actively looking for work). The total Canadian labour force includes all sectors in the Canadian economy, while the tourism labour force only considers those working in, or looking for work in, the tourism sector.
[4] Employment refers to the total number of people currently in jobs. Tourism employment is restricted to the tourism sector, while employment in Canada comprises all sectors and industries.
[5] Unemployment is calculated as the difference between the seasonally unadjusted labour force and seasonally unadjusted employment estimates. The percentage value is calculated against the labour force.