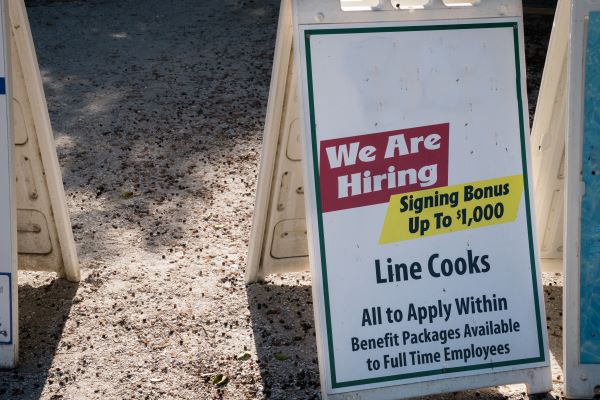
Statistics Canada has just released its job vacancy rates data for the month of September. The number of vacancies in the accommodation and food services industry was truly unprecedented.
Tourism HR Canada expected to see a slight decrease from August to September, given the reduced demand for tourism goods and services that usually accompanies the end of the summer season and return to school.
This year, however, the number of vacant jobs spiked to nearly 200,000. Almost 40,000 more jobs were vacant in September than in August.
This means 14.4% of jobs in this industry were unstaffed, impacting the ability to remain open to full capacity, stretching current staff members’ workloads, and likely diminishing service levels. Tourism HR Canada will continue to work with tourism stakeholders across the country to build on our coordinated, concerted effort to place tourism as a destination for employment and show that demand for employees is far outpacing supply. And this is demand that was only just starting to pick up as border restrictions were eased. As more restrictions lift (such as PCR tests) and the rate of vaccines in children increases, this demand will continue to rise. Our sector must ensure we have the skilled staff to welcome these visitors as they return.
The number of job vacancies did drop slightly in the arts, entertainment and recreation industry, falling just shy of 1,500 to 16,380 (leaving 5.5% of jobs unfilled). However, this industry is much more seasonal in nature, so there may be a return to higher rates in the spring.
Below are the charts for each of these industry groups. Further information can be found on the Stats Canada website, including data for other industries—tourism is far from the only sector facing historically high vacancy rates, leading to increased competition for workers.
| Accommodation and Food Services | |||||
| May 2021 | June 2021 | July 2021 | August 2021 | September 2021 | |
| Job vacancies | 78,365 | 123,700 | 132,800 | 156,755 | 196,050 |
| Payroll employees | 921,880 | 891,265 | 1,008,410 | 1,120,270 | 1,162,255 |
| Job vacancy rate | 7.8% | 12.2% | 11.6% | 12.3% | 14.4% |
| Arts, Entertainment and Recreation | |||||
| May 2021 | June 2021 | July 2021 | August 2021 | September 2021 | |
| Job vacancies | 13,615 | 16,900 | 10,940 | 17,875 | 16,380 |
| Payroll employees | 189,510 | 183,165 | 218,325 | 267,420 | 282,850 |
| Job vacancy rate | 6.7% | 8.4% | 4.8% | 6.3% | 5.5% |

