
Early Summer Employment Bump Sees Over 120k Workers Join Tourism
The tourism sector[1] in May 2026 saw substantial gains over the previous month[2], with labour force growing by around 107,000 (+4.8%) and employment by around 123,000 (+6.0%). May coincides with the first surge in summer employment, as many post-secondary students either enter the labour market for the season or increase their hours/shifts in the jobs that sustain them part-time throughout the year.
Tourism operators generally see increased demand in the coming months, although the current geopolitical and economic conditions facing Canadians may distort typical patterns. Border data for May 2026[3] suggest that Canadians are beginning to increase their visits to the United States, although the numbers remain substantially below 2024 figures. The extent to which Canadians choose to vacation domestically this summer will be an important factor in demand facing Canadian operators.
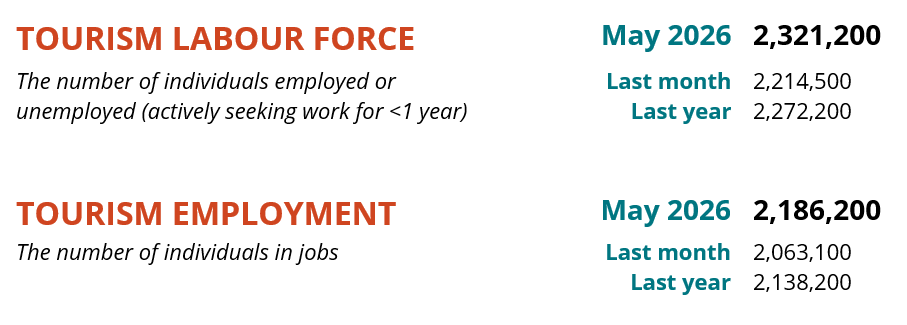
Table 1 provides a snapshot of each industry group’s performance across labour force, employment, and unemployment, as compared with April 2026 [MoM] and May 2025 [YoY], and with May 2019 as a pre-pandemic baseline. Small arrows represent changes of less than 1% (or one percentage point, in the case of unemployment).
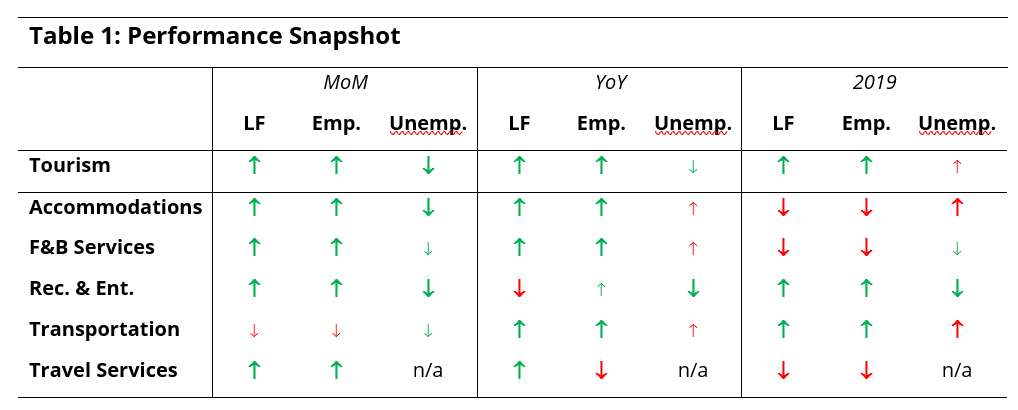
At the industry group level, all but transportation saw gains of over 1% from April across both labour force and employment, and almost all industries were similarly in stronger positions than last year. It’s not obvious why transportation contracted, although labour force contracted more than employment, which pulled the unemployment rate down.
Overall, the picture relative to 2019 was little changed from the patterns we have seen over the past year and a half: recreation and entertainment and transportation continued to outperform other industry groups, together pulling the aggregate sector into a position of growth.
Tourism Sector
Around 123,000 people found employment in tourism in May, bringing total employment to nearly 2.2 million workers (Table 2), while labour force rose to 2.3 million. The increase in labour force was slightly smaller, although substantial, which worked together to pull the aggregate unemployment rate down to 5.8%. The sector had gained a balance of around 50,000 people from last year, and over 60,000 relative to May 2019.

The tourism workforce saw relatively larger gains than the total Canadian economy (Table 3), with around one-third of all employment gains occurring in the tourism sector. The economy-wide unemployment rate fell to 6.6% from 7.1% in April (calculated using seasonally unadjusted data), with tourism’s unemployment rate remaining 0.8 percentage points below this benchmark.

Tourism employment accounted for 10.3% of all employment in Canada, which was a modest increase in share from 9.9% in April. Around 9.6% of the Canadian labour force worked in tourism, a parallel increase of 0.4 percentage points from last month.
Part-Time and Full-Time Employment
The ratio of part-time to full-time work provides a useful perspective on the stability of the labour force, particularly in industries that tend to offer part-time work across the off-peak seasons and ramp up their employment in summer. Tourism typically sees an aggregate part-time share of employment of around 40%, with some substantial variation between industries (Figure 1). Statistics Canada defines part-time work as working fewer than 30 hours per week.
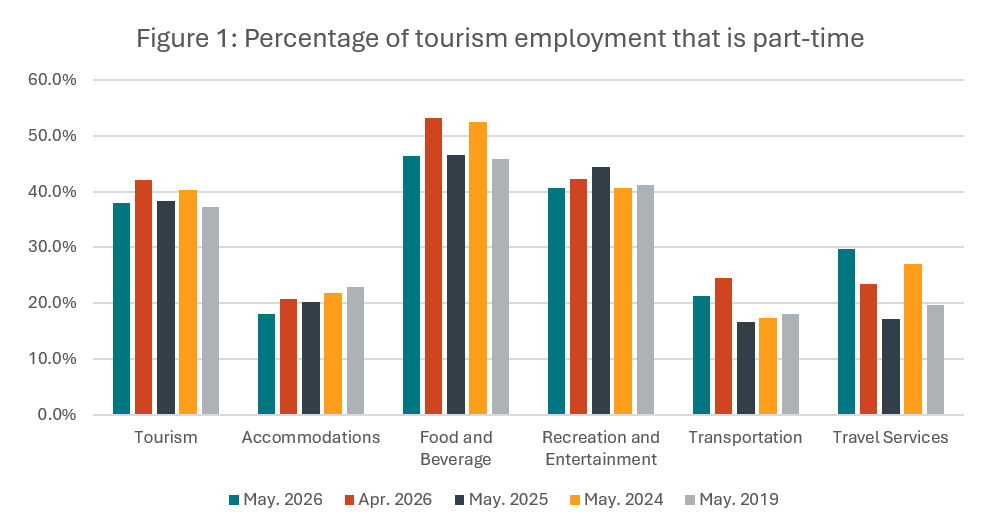
The overall sector saw a shift from part-time to full-time work of around 4 percentage points, and most industries followed this overall trend. The exception to this pattern was travel services, which tends not to be very accurately represented in the LFS survey data, thanks to its small size as compared to the overall Canadian labour force.
In accommodations, the part-time share of the workforce fell below where it was last year, continuing an ongoing trend towards greater reliance on full-time workers. The part-time share of employment in food and beverage services fell to comparable levels as last year and 2019, although May 2024 had abnormally high part-time employment. Recreation and entertainment also saw part-time employment fall into traditional patterns, but in this case 2025 was the abnormal year for comparison. Transportation’s share of part-time workers fell from April but remained several percentage points higher than in recent years, or indeed the pre-pandemic baseline of 2019.
Hours Worked
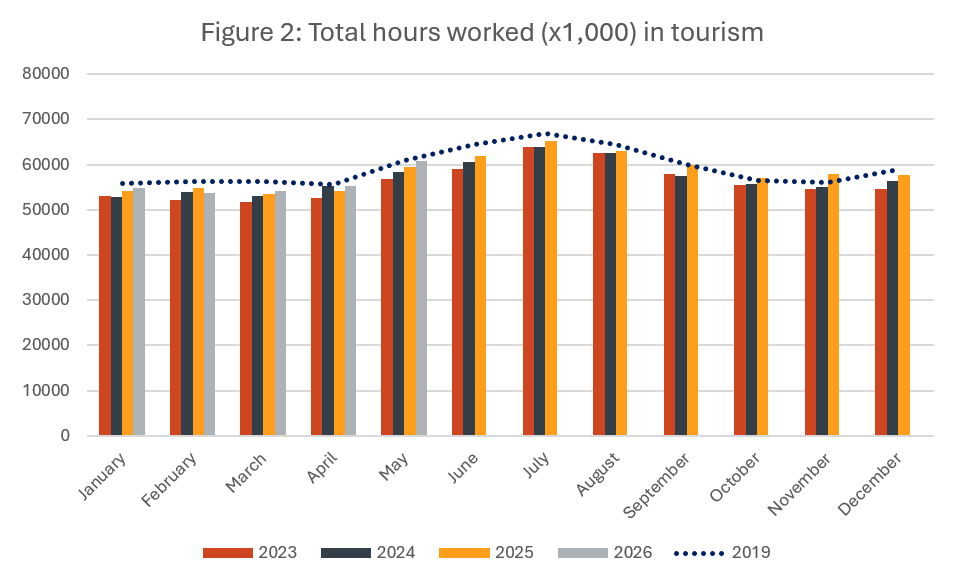
The total hours worked provides another useful perspective on the tourism workforce (Figure 2), as this metric is more immediately responsive to changes in customer demand than raw employment figures alone.
Hours worked increased by around 10% from April, a four-fold increase compared with the overall Canadian economy. Hours worked in tourism in May have increased steadily over the past three years, although the total has not yet reached parity with 2019.
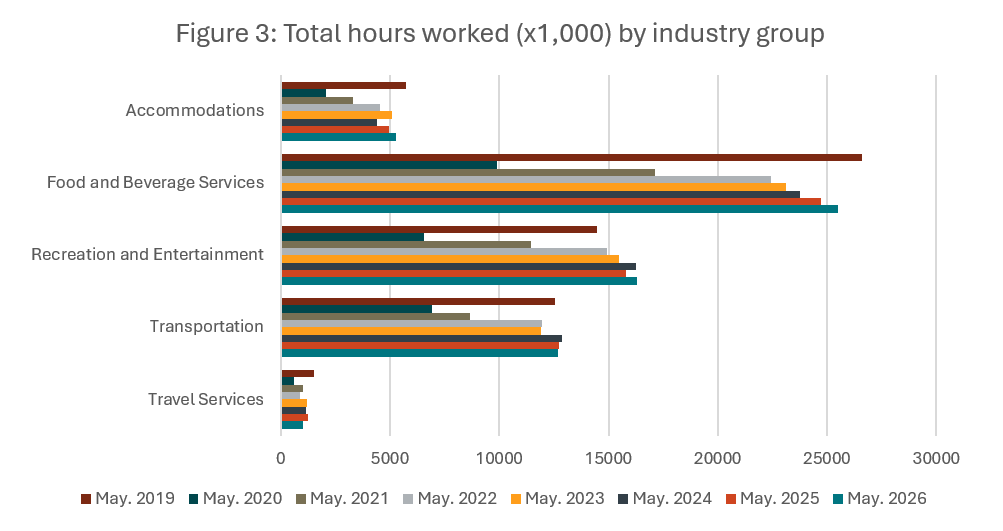
At the industry level (Figure 3), total hours worked trended upward from last year in accommodations (+6.4%), food and beverage services (+3.0%), and recreation and entertainment (+3.2%), while it contracted slightly in transportation (-0.2%) and—to the extent that the data is reliable—in travel services (-17%). Only recreation and entertainment and transportation surpassed May 2019 levels, although the gap continues to narrow for the other industry groups.
Youth in Tourism
Last month, we took a closer look at young workers in tourism, to draw attention to the differences between tourism as an employment destination for youth and the status of youth across the entire Canadian economy. This month, we continue to include high-level statistics on youth employment and youth unemployment. For more detailed demographic information on the tourism workforce, please see our Tourism Employment Tracker.
The importance that tourism plays in attaching young Canadians to the workforce is easily overlooked in public discourse. The skills that tourism jobs can impart even over a short tenure—as young people train towards careers in other sectors—are vital to the overall health of Canada’s economy, to say nothing of the rewarding careers that await those who choose to stay in our sector.

Tourism continues to be a more reliable source of employment for youth than many other sectors. The youth unemployment rate gap continued to persist in May compared to April, and even widened somewhat—the “all sectors” youth unemployment rate held steady, while that in tourism fell by 0.9 percentage points.
Likewise, there was very little change in tourism’s share of overall youth labour force or employment, although the share of unemployed youth in the tourism sector fell from 16% in April to 14.2% in May. This aligns with seasonal growth in employment across tourism industries as summer travel begins to pick up and post-secondary students enter the labour market in large numbers.
Industry Closeup: Accommodations
Both labour force and employment saw double-digit growth in accommodations from last month (Table 5), with over 22,000 people connecting with the labour market for this industry in May. Gains in employment outpaced those in labour force, which drew the unemployment rate down to 7.2%. The industry was also in a stronger position relative to last year, although it remained 4–5% below pre-pandemic baselines. It is interesting to note that the gap between 2026 and 2019 data narrowed considerably from April, when both labour force and employment were around 12% below 2019 levels.

Industry Closeup: Food and Beverage Services
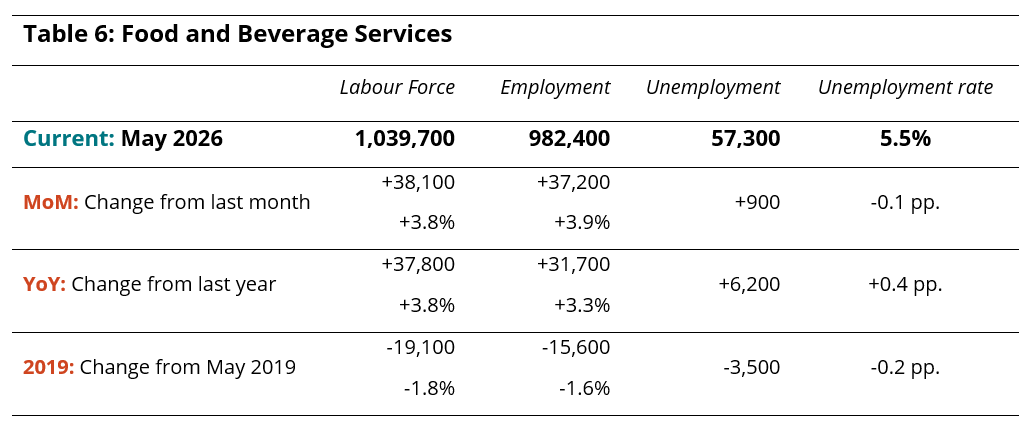
Food and beverage services saw growth of nearly 4% from April (Table 6), across both labour force and employment, figures that closely matched the year-over-year changes. Unemployment was little changed. The industry remained slightly below 2019 levels.
Industry Closeup: Recreation and Entertainment
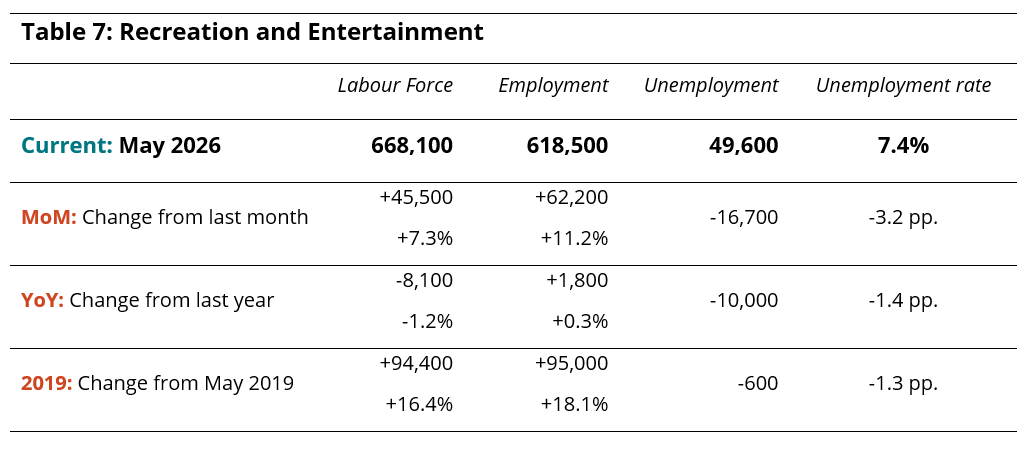
Unemployment in recreation and entertainment fell to 7.4% in May from 10.6% in April, with employment gains leading labour force gains (Table 7). The picture relative to last year was less consistent, although the net difference also resulted in a lowered unemployment rate. The industry was in a much stronger position than it was in 2019, with just short of 100,000 people having joined the industry since then.
Industry Closeup: Transportation
Transportation saw small losses from April, with decreases in both labour force and employment of less than 1% (Table 8). Relative to last year, the industry was in a somewhat stronger position, as it was with respect to 2019. While recreation and entertainment seems to be continuing its trajectory of strong growth, transportation—which rebounded relatively early after the pandemic—has begun to slow down.

Industry Closeup: Travel Services
Labour Force Survey (LFS) data for travel services is not always reliable, particularly in the short term, as it is prone to disproportionately large swings from month to month. Partly this is an effect of amplification resulting from converting raw numbers to percentages, but it’s also impacted by this industry’s small size relative to tourism overall, and even more so to the larger economy. Small absolute differences can become distorted in this analysis, which has led to unnaturally large swings month-to-month in recent years.
The data provided here reflects what is in the May 2026 LFS findings, but it should be treated with caution (Table 9). While the month-over-month—and to a lesser extent, year-over-year—changes are unreliable in terms of both magnitude and direction (gains vs losses), it is clear that this industry remains under serious labour pressure since the pandemic.

Provincial Perspectives
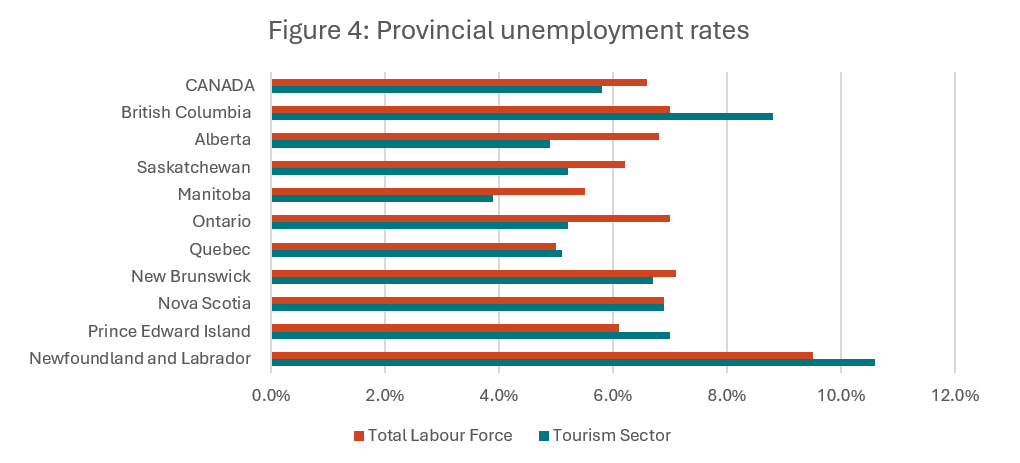
The Canadian economy is subject to some pronounced regional differences, and that is particularly true in the tourism sector. Figure 4 provides a comparison of provincial unemployment rates for the tourism sector in particular and for the total labour force (i.e., comprising all industries).
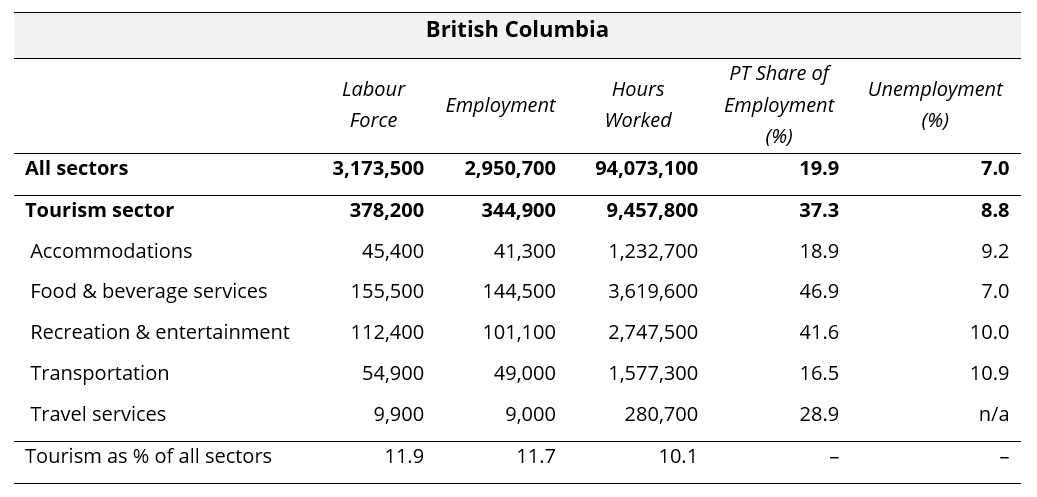
In May 2026, the national unemployment rate remained lower in tourism than it was across the total economy, a pattern which held true for the majority of the provinces. Only British Columbia, Quebec, Prince Edward Island, and Newfoundland and Labrador had tourism unemployment rates higher than those of their economy-wide counterparts.
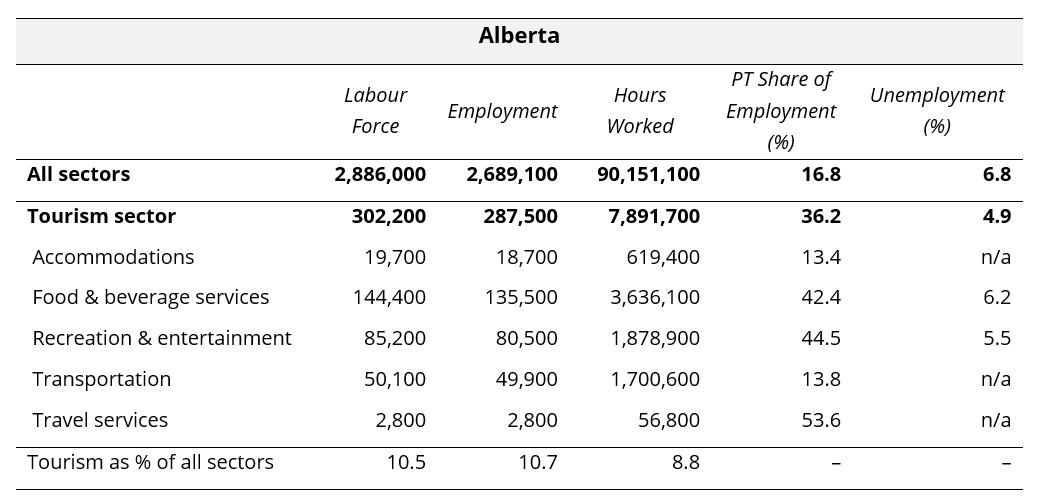
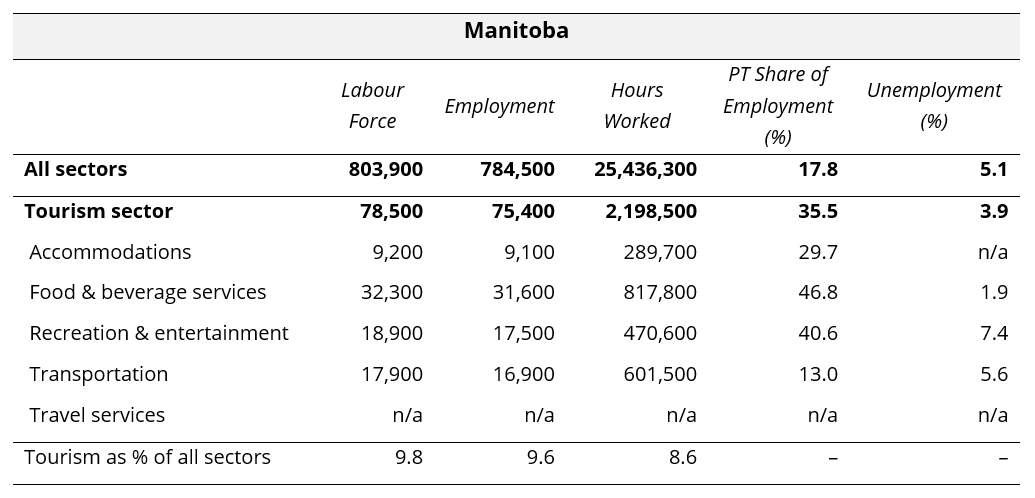
Provincial unemployment rates ranged from 3.9% in Manitoba and 4.9% in Alberta through to 8.8% in British Columbia and 10.6% in Newfoundland and Labrador. It remains to be seen whether these trends continue as summer tourism demand grows over the coming months.
Provincial Summaries for May 2026
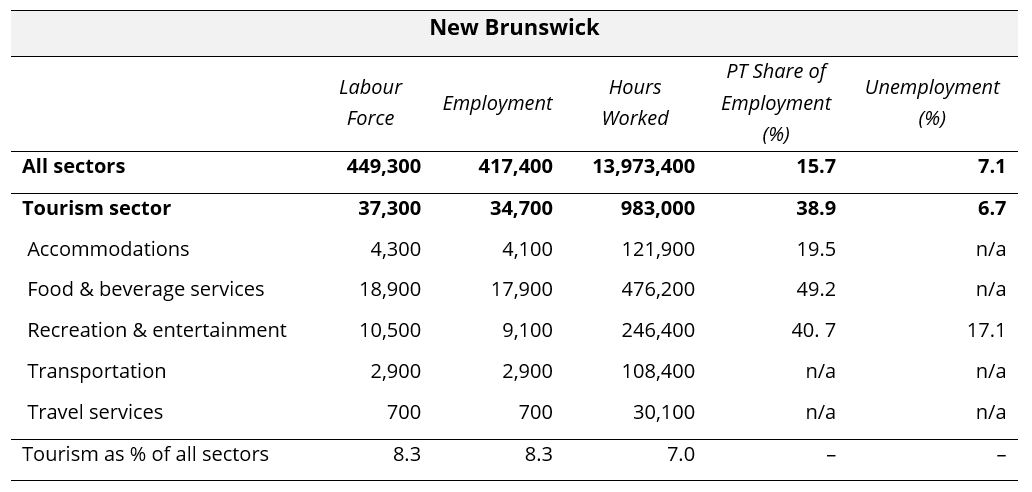
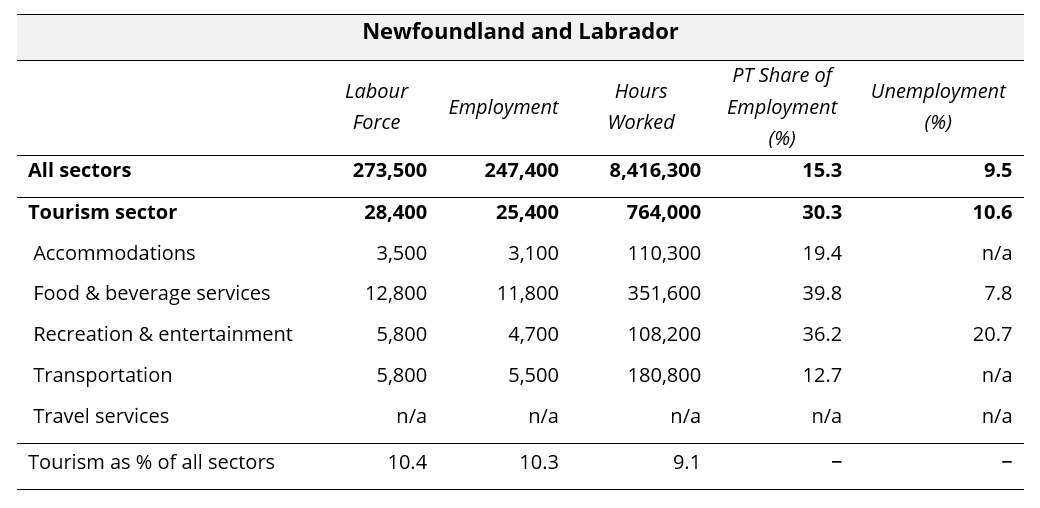
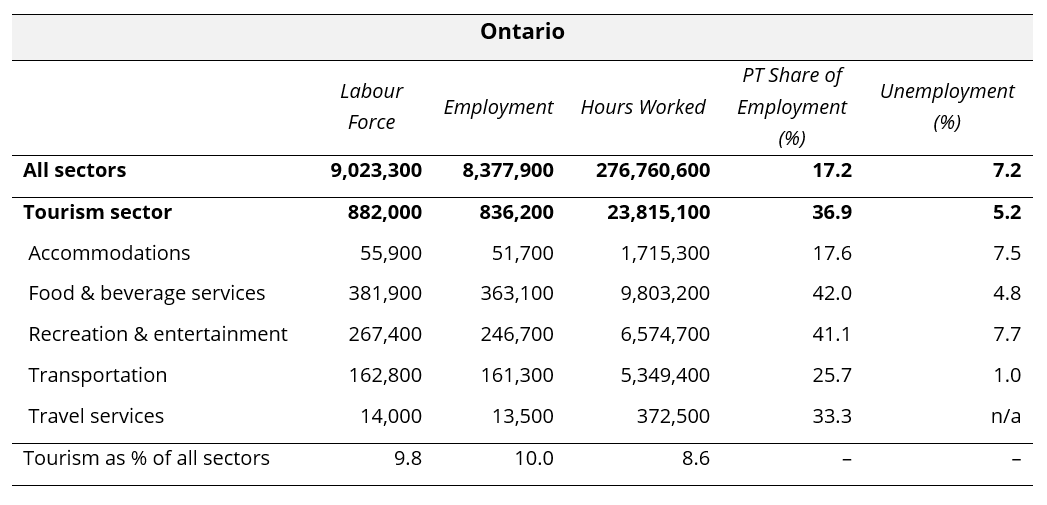
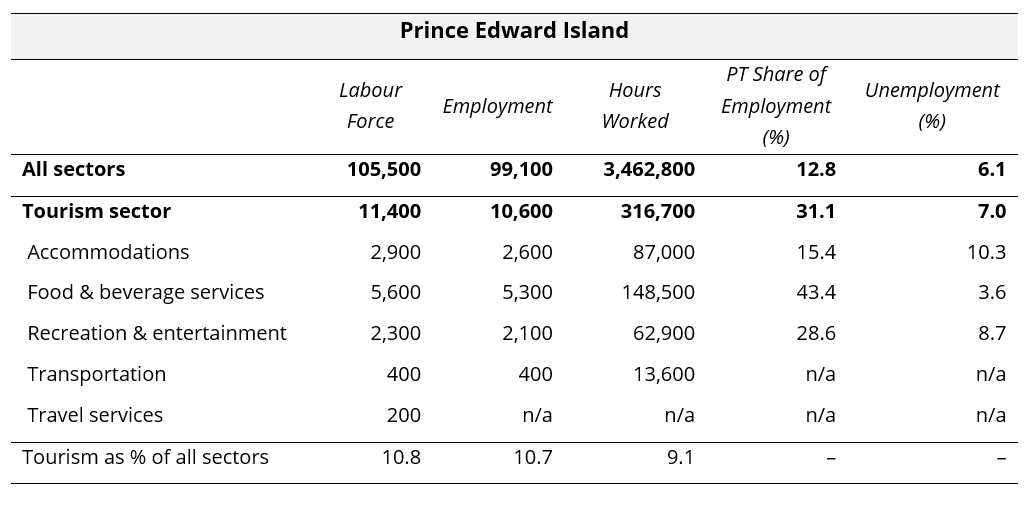
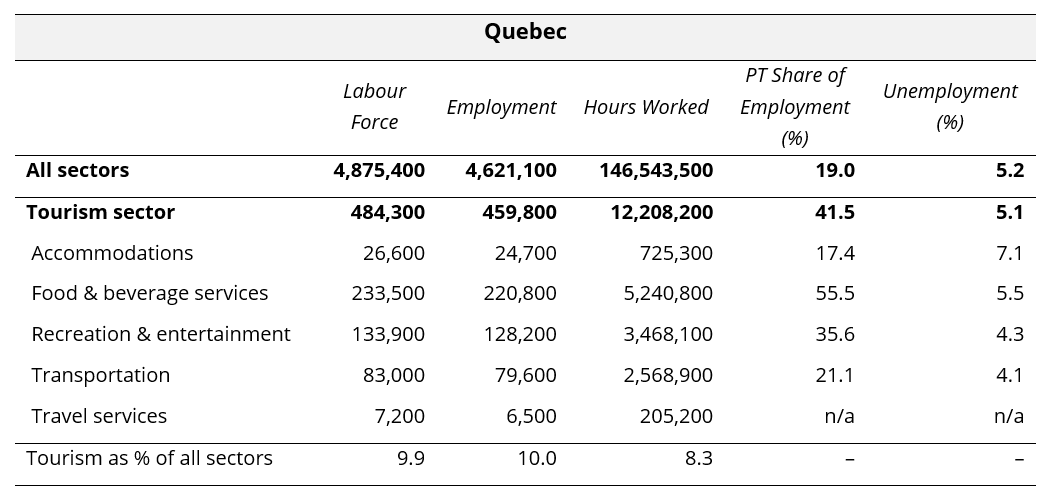
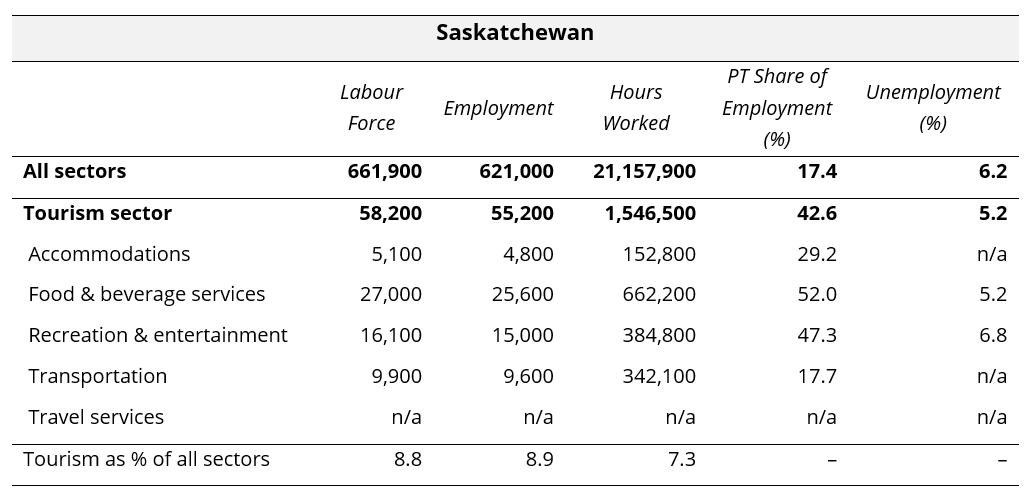
The following ten tables provide May 2026 summaries for the provinces, focusing on tourism and its five industry groups. Comparison data is provided for the larger provincial economy, as a benchmarking reference. Seasonally unadjusted estimates are provided for labour force, employment, and hours worked, and the final row of each table indicates tourism’s share of each of these metrics. The share of work that is part-time (as opposed to full-time) is also provided, as a rough indicator of the labour composition, as well as the unemployment rates.
Where data was not available due to suppression from Statistics Canada, “n/a” has been entered in the table. The three territories are not included in the LFS releases at this level of granularity, so no comparison is possible between the territories and the provinces. The provinces are listed alphabetically.

View more employment charts and analysis on our Tourism Employment Tracker.
[1] As defined by the Canadian Tourism Satellite Account. The NAICS industries included in the tourism sector those that would cease to exist or would operate at a significantly reduced level of activity as a direct result of an absence of tourism.
[2] SOURCE: Statistics Canada Labour Force Survey, customized tabulations. Based on seasonally unadjusted data collected for the period of May 10 to 16, 2026.
[3] SOURCE: Statistics Canada, Leading indicator of international arrivals to Canada, May 2026. https://www150.statcan.gc.ca/n1/daily-quotidien/260611/dq260611d-eng.htm