Industries Balance Each Other in Pre-Summer Ramp-Up
The tourism sector[1] in April 2026 grew slightly over the previous month[2], with both labour force (+20,000) and employment (+12,000) gaining by less than one percent.
April tends to mark a lag between labour force and employment, as many post-secondary students become available for summer work slightly in advance of tourism businesses hiring their full complement of summer staff. Historically, the seasonal surge in employment starts to be reflected in the Labour Force Survey (LFS) in May, so next month will be a more reliable indicator of the workforce situation than April’s data. However, the fact that both labour force and employment are slightly up on last year is a promising early indicator.

Table 1 provides a snapshot of each industry group’s performance across labour force, employment, and unemployment, as compared with March 2026 [MoM] and April 2025 [YoY], and with April 2019 as a pre-pandemic baseline. Small arrows represent changes of less than 1% (or one percentage point, in the case of unemployment).

At the industry group level, the strong performance in March for accommodations has been reversed, with month-over-month losses in April across both key labour indicators, which pulled the industry’s unemployment rate up by more than one percentage point. On the other hand, food and beverage services showed strong gains over the last month, in contrast with the losses seen in March.
Relative to last year, the sector was generally in a stronger position across most industry groups, although unemployment rates were higher across the board. This likely reflects broader economic pressures faced by the overall Canadian economy, rather than something particular to tourism.
Tourism Sector
Around 20,000 people entered the tourism labour force from March, bringing the total back up to over 2.2 million. Employment likewise increased, but only by around 0.6%, which pulled the unemployment rate up to 6.8%. The sector was also in a marginally stronger position than this time last year, although the gap between gains in labour force and employment was much more substantial in the year-over-year comparison. Relative to 2019, employment was essentially unchanged, while labour force had grown by around 1%. Table 2 provides a summary of sector-level labour statistics.

Tourism kept pace with the larger Canadian economy, seeing comparable relative growth in both labour force and employment (Table 3). The economy-wide unemployment rate rose to 7.1% (calculated using seasonally unadjusted data), slightly higher than tourism’s rate.
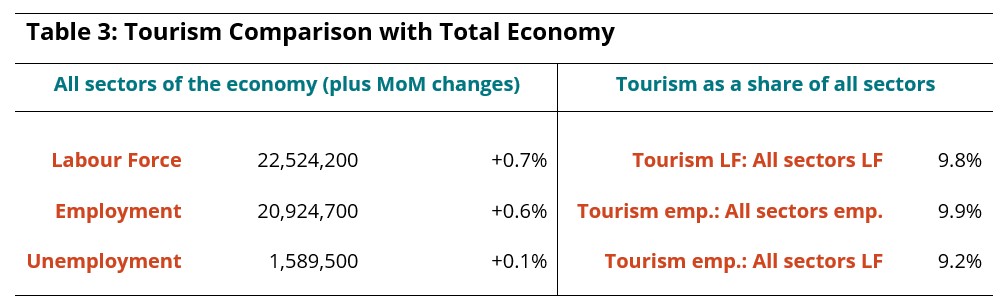
Tourism employment accounted for 9.9% of all employment in Canada, unchanged from March. Around 9.2% of the Canadian labour force worked in tourism, also unchanged from March.
Part-Time and Full-Time Employment
The ratio of part-time to full-time work provides a useful perspective on the stability of the tourism workforce. Tourism typically has an overall share of part-time work around 40%, although the ratio varies by industry (see Figure 1). Statistics Canada defines part-time work as working fewer than 30 hours per week.
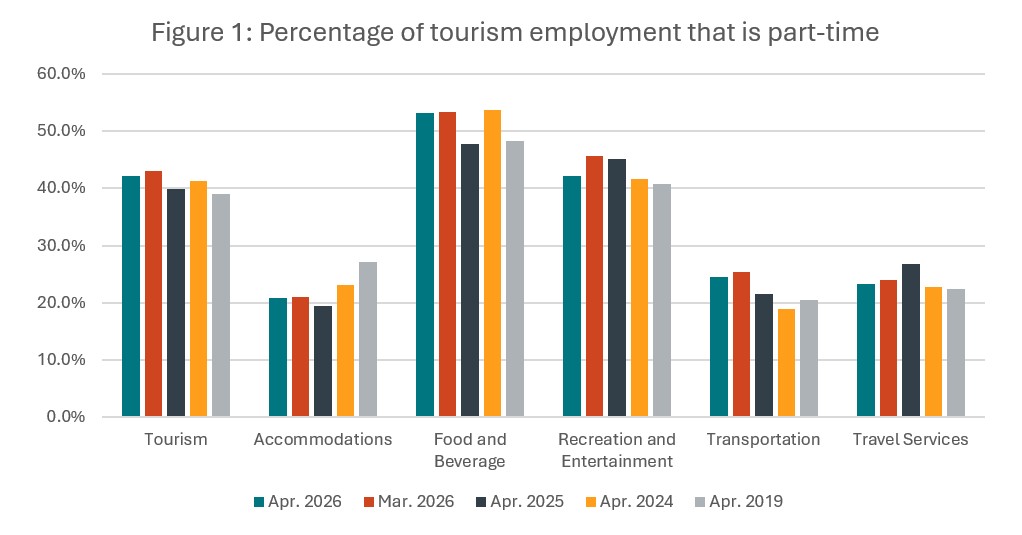
Changes in the ratio of part-time work at the sector level and across industry groups were not much different from what was observed in March: slight decreases month-over-month across industry groups, while the larger trends of the past few years (and relative to pre-pandemic baselines from 2019) have continued in a similar vein. Part-time work remains depressed in accommodations, while food and beverage services and transportation are trending towards higher shares.
Hours Worked
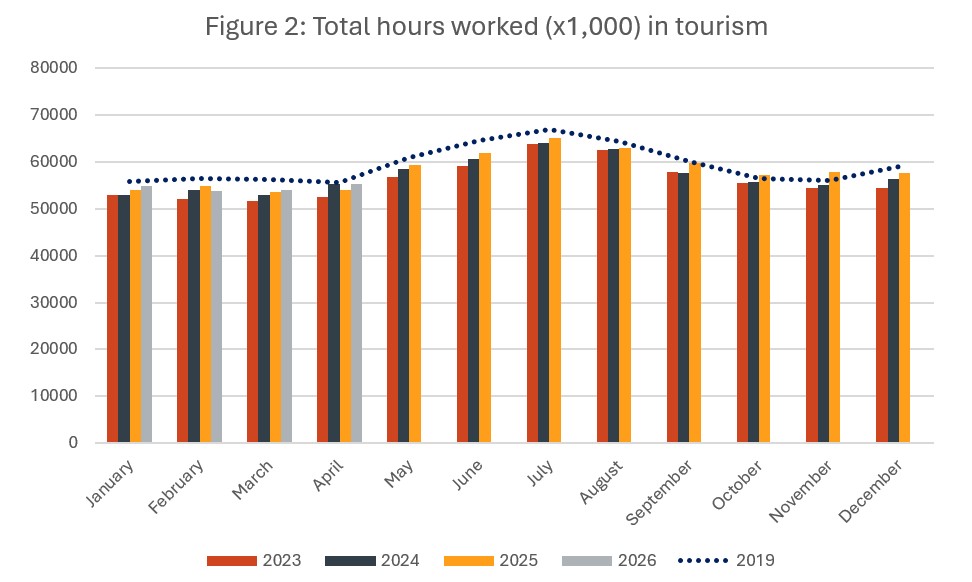
The total hours worked in tourism (Figure 2) provides another useful perspective on the tourism workforce, with employers more nimbly able to respond to changes in customer demand by scaling scheduled hours than by changing their employee roster on a more permanent basis. The sector saw modest gains from March (+2.0%) and from last April (+2.1%), but remained slightly below where it was in April 2019 (-0.6%).
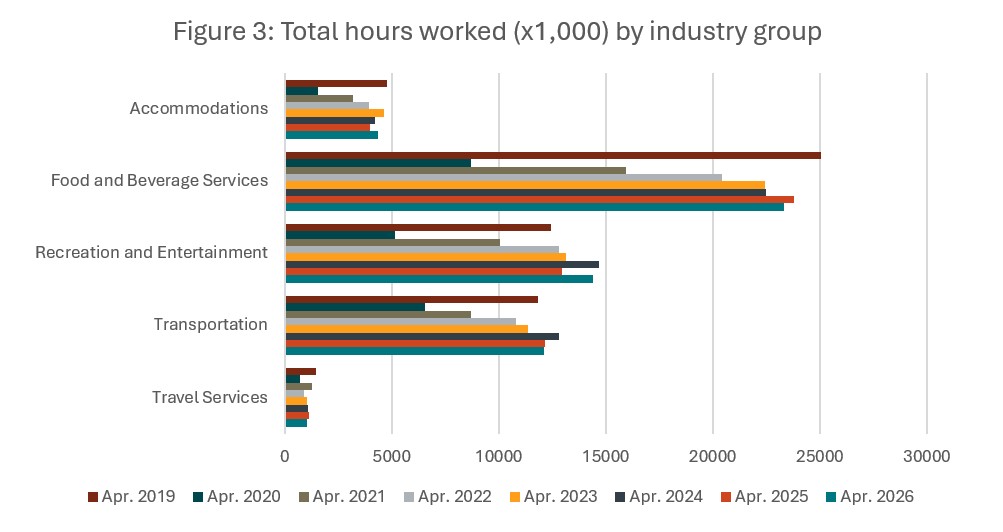
At the industry level (Figure 3), total hours worked rose from last year for accommodations (+8.7%) and more substantially for recreation and entertainment (+11.4%), but fell across other industries. Total hours worked surpassed 2019 levels for recreation and entertainment and transportation, while remaining below this baseline for all other industries.
Youth in Tourism
In the current socioeconomic climate, youth unemployment has become a dominant narrative in public discourse, with a lot of media coverage around the difficulties youth are having in getting a foothold in the labour market.
Tourism has always been a major employer of youth (defined by Statistics Canada as between 15 and 24 years of age), for a number of reasons:
- The wide availability of accessible entry-level positions, across all industry groups
- The summer peak season coincides with school breaks, offering ideal seasonal employment
- Many businesses can accommodate shiftwork throughout the year, making tourism jobs an important source of income for post-secondary students
- The presence of tourism businesses in every community in Canada
Given the focus on the challenges youth are facing, it’s worth putting tourism into the larger economic context. Table 4 provides a high-level comparison of youth participation in the labour market in tourism versus that across the total economy (“All sectors”), for April 2026.
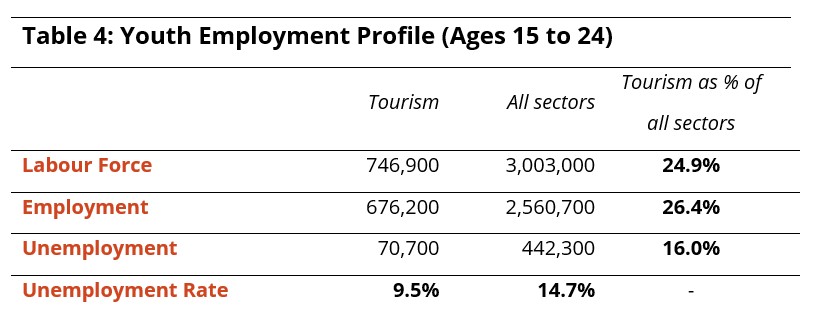
It is interesting to note that around one quarter of all youth who are in the labour market are working in tourism, but tourism accounts for only 16% of all youth unemployment. Equally important to note is that the youth unemployment rate in tourism (9.5%) is well below that seen across the total economy (14.7%)—and the tourism number is expected to drop as customer demand picks up over the summer.
There may be a post-pandemic effect at play in steering youth away from tourism work, where those whose formative years were spent in lockdown are averse to taking such intensive customer-facing roles, which exacerbates unemployment pressures in other sectors.
Youth should be encouraged to work in tourism, not only because they will find it easier to secure a flexible job that meets their needs, but also because the core employability skills they learn in tourism—customer service, problem-solving, collaboration, responsibility, time management—will be foundational across their careers, regardless of which sector they pursue in the long run.
Industry Closeup: Accommodations
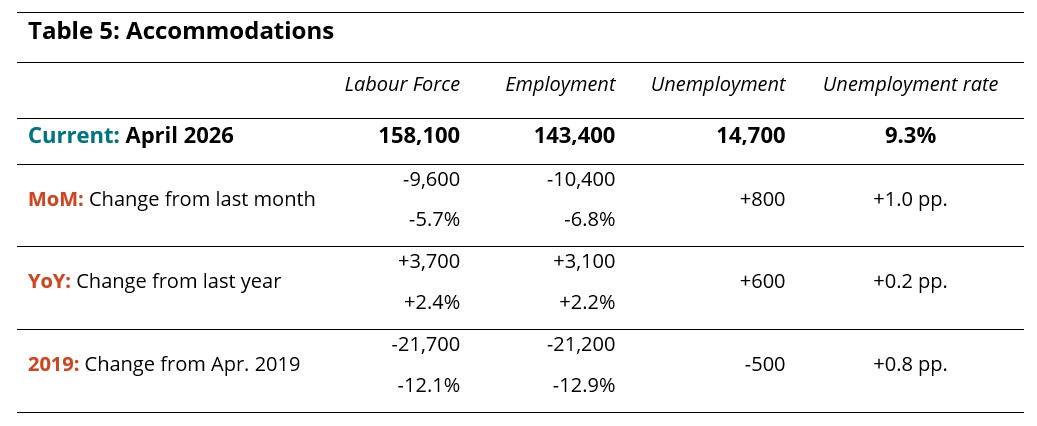
Accommodations reversed its growth from March, with a net loss of around 10,000 workers in April (Table 5), bringing unemployment up to 14,700 (9.3%). However, it was in a stronger position than this time last year, seeing gains of around 2% across both labour force and employment, which aligns with the total hours worked noted above (Figure 3). The industry remained around 21,000 people below where it was in 2019.
Industry Closeup: Food and Beverage Services
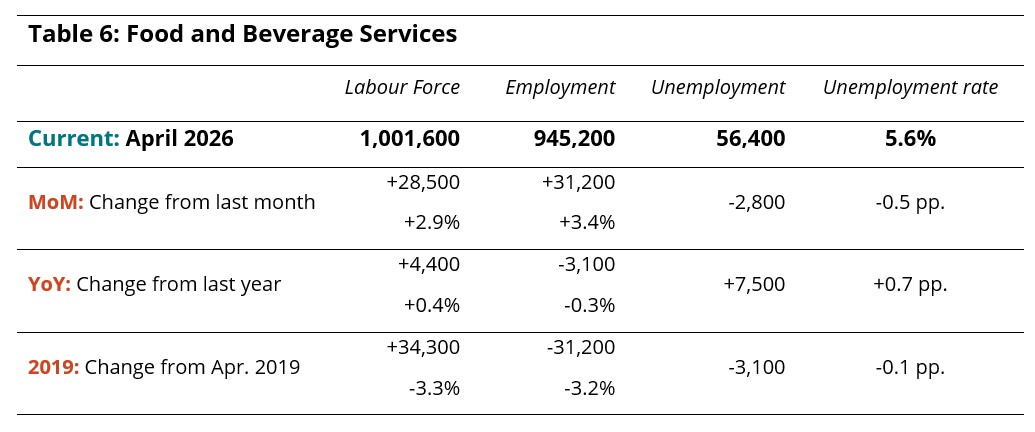
Food and beverage services saw strong gains from March, with over 30,000 people entering employment (Table 6). The unemployment rate fell to 5.6%, with employment growth larger than new labour force entrants. With this industry group being a particularly attractive and accessible route to employment for youth over the summer, it is likely that this month-over-month increase will continue over the next few months. Overall, employment remained around 3% below its 2019 pre-pandemic levels.
Industry Closeup: Recreation and Entertainment
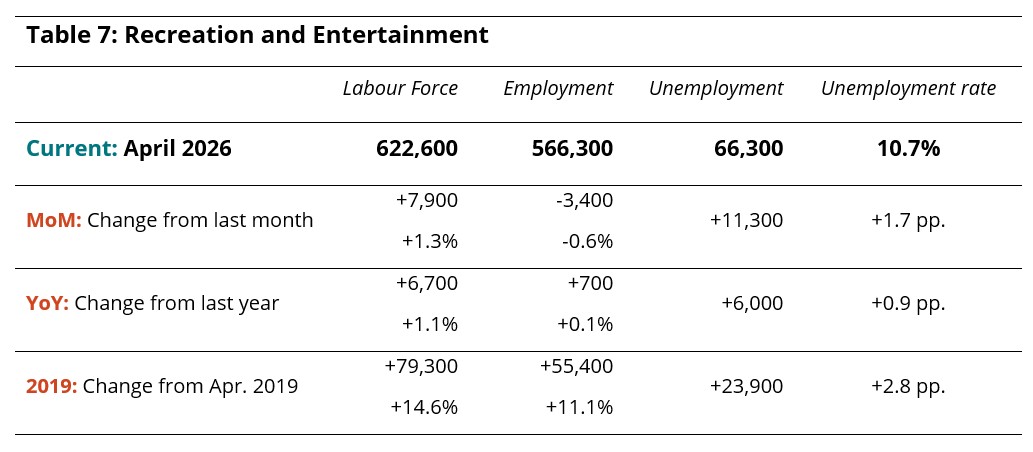
In April, labour force rose in recreation and entertainment while employment fell, pulling the unemployment rate up to 10.7% (Table 7). This is likely a shoulder season effect, with employment dipping in the gap between winter and summer recreation at the same time as students start to enter the labour force. Employment levels were virtually unchanged from last year, and the industry remained over 10% above its pre-pandemic baseline.
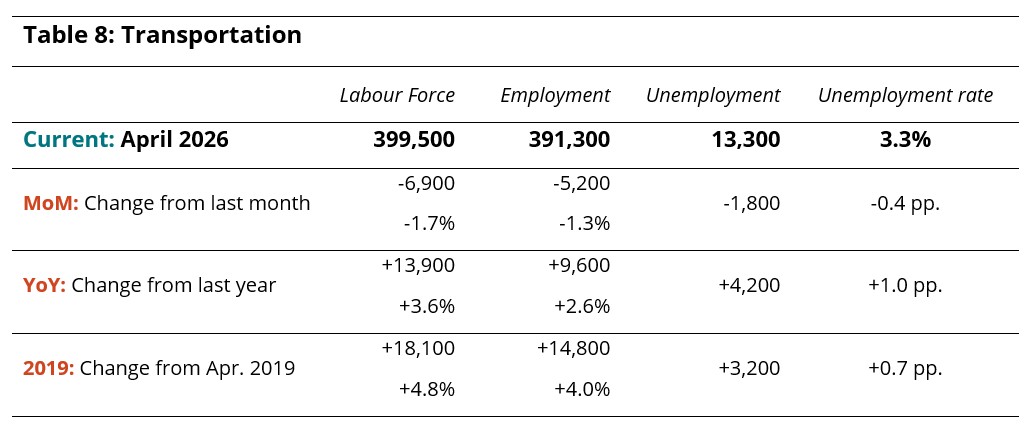
Industry Closeup: Transportation
Both labour force and employment contracted in April for the transportation industry group (Table 8), but unemployment remained low. There were moderate gains from last year, however, and net growth of around 4-5% from 2019.
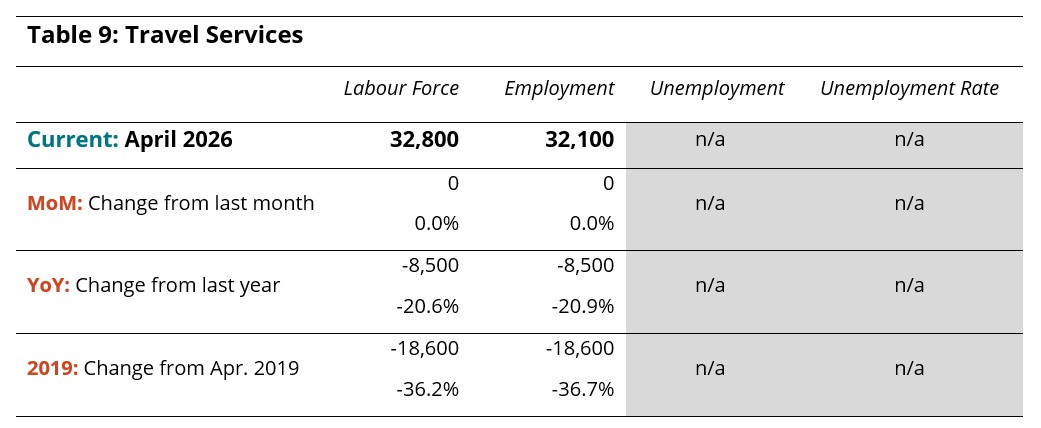
Industry Closeup: Travel Services
Data relating to the travel services industry group is not always reliable in the Labour Force Survey, in large part because of LFS sampling and the relatively small proportion of the Canadian workforce that this industry represents. Table 9 provides the latest estimates, but these should be interpreted cautiously. Trends suggest a rare moment of relative stability for this industry group, with no month-over-month changes reported, while the sector remained substantially below both 2025 and 2019 levels.
Provincial Perspectives
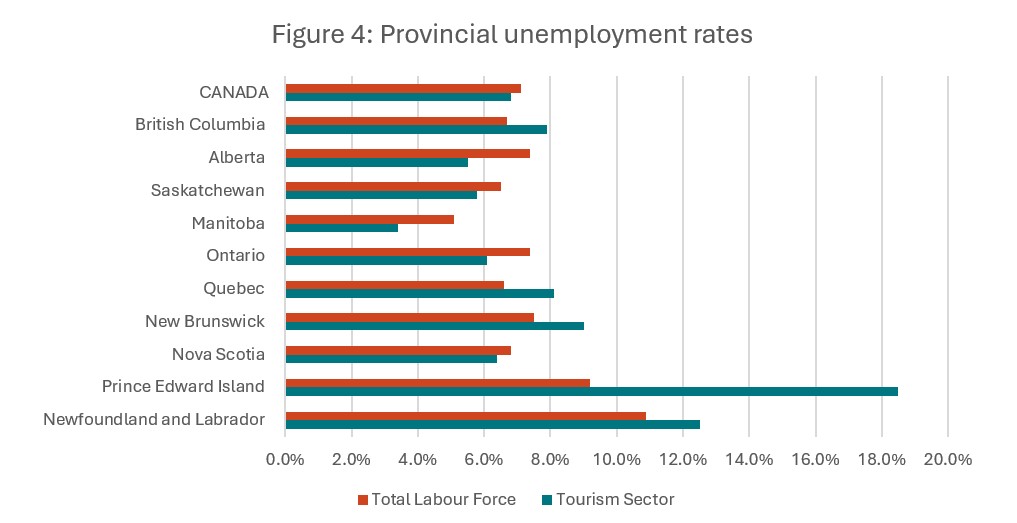
The Canadian economy is subject to some pronounced regional differences, and that is particularly true in the tourism sector, where seasonal demands can vary substantially. Figure 4 provides a comparison of provincial unemployment rates, for the tourism sector in particular and for the total labour force (i.e., comprising all industries).
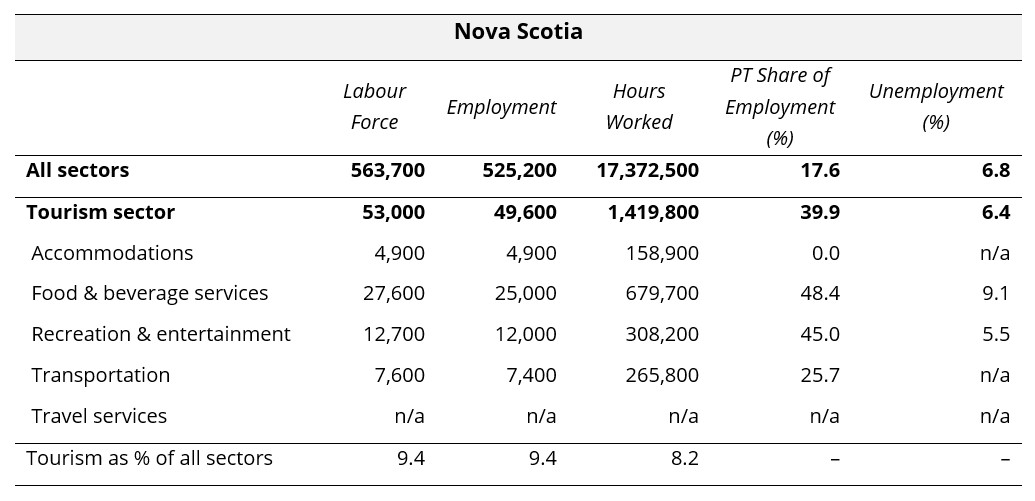
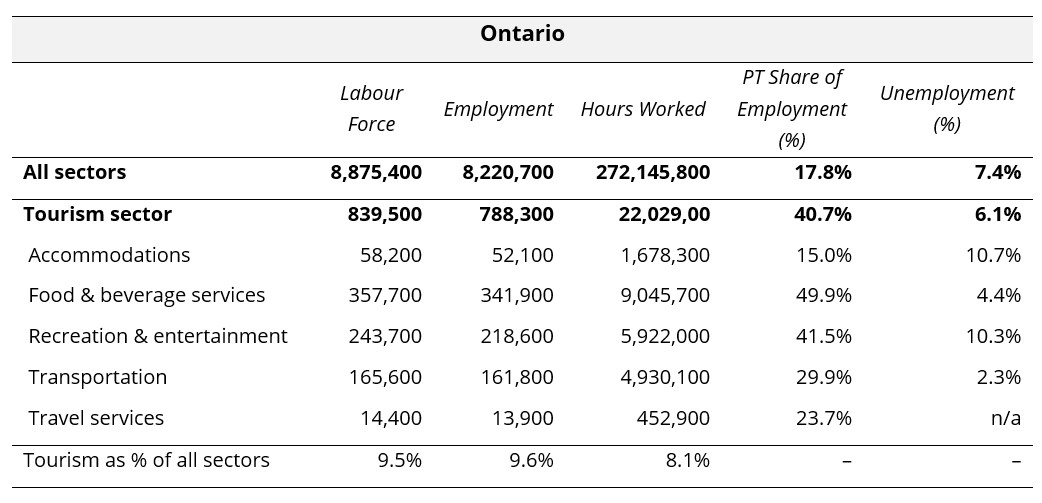
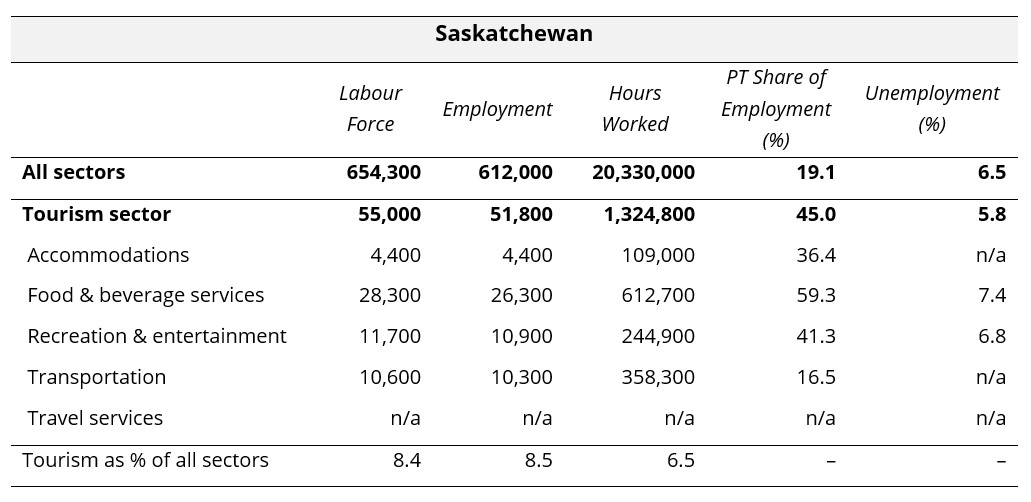
In April 2026, the national unemployment rate was slightly lower in tourism than it was across the total economy, a pattern that was sustained in five provinces: Nova Scotia, Ontario, Manitoba, Saskatchewan, and Alberta.
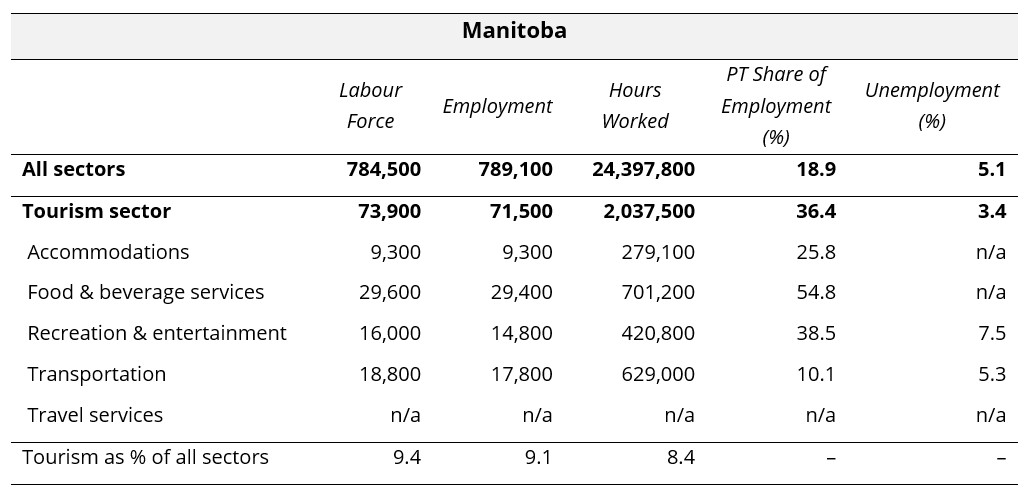
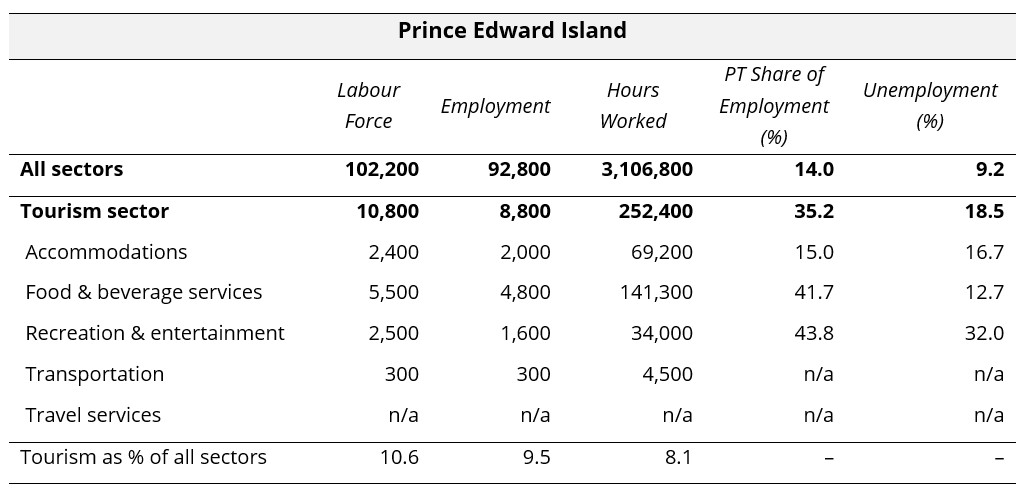
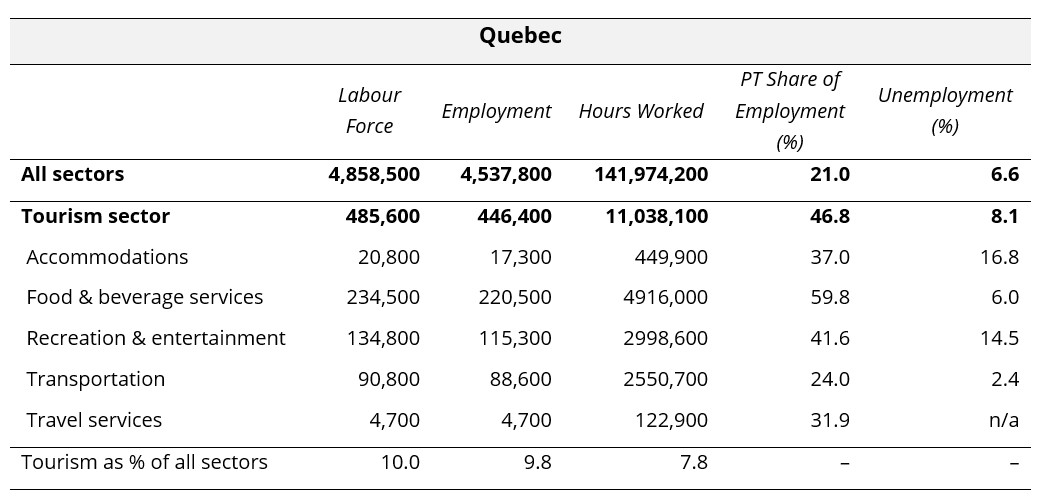
Provincial tourism unemployment rates were lowest in Manitoba (3.4%) and Alberta (5.8%), and highest in Newfoundland and Labrador (12.5%) and Prince Edward Island (18.5%).
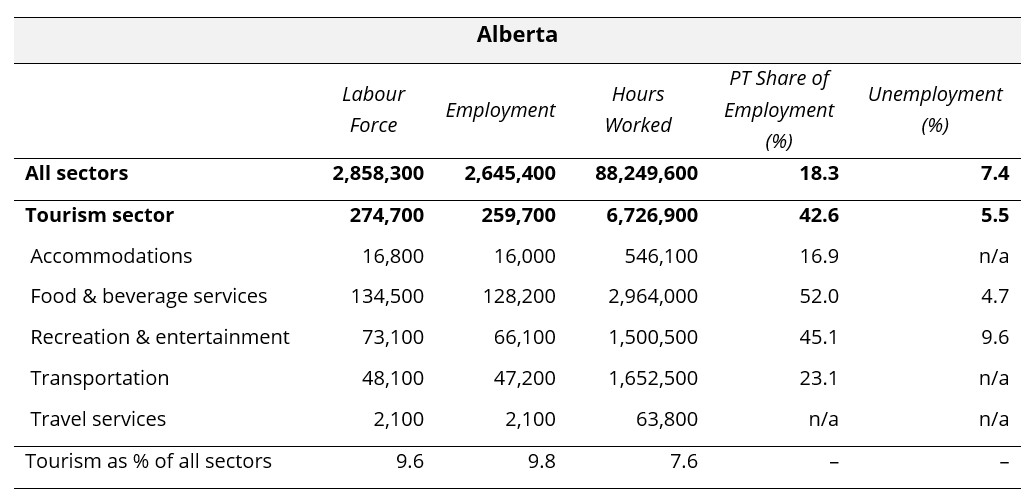
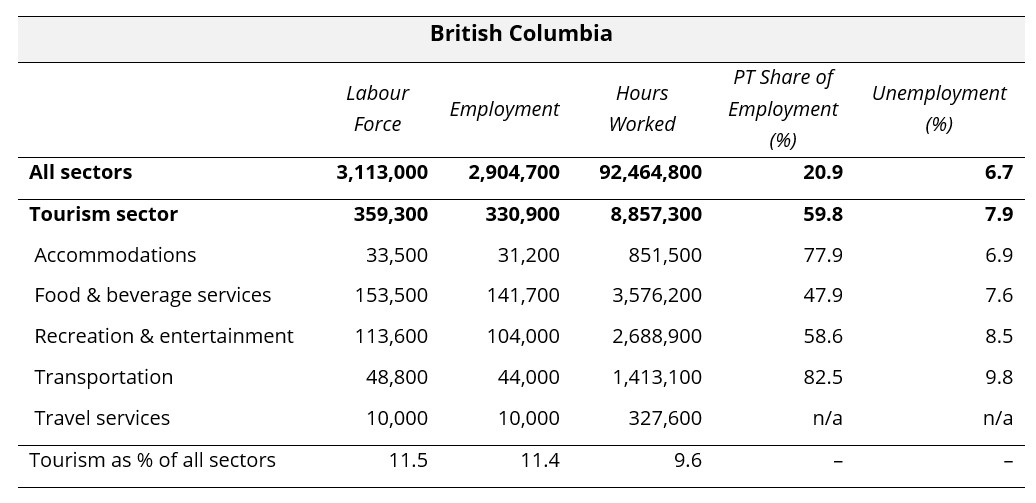
Provincial Summaries for April 2026
The following ten tables provide April 2026 summaries for the provinces, focusing on tourism and its five industry groups. Comparison data is provided for the larger provincial economy as a benchmarking reference. Seasonally unadjusted estimates are provided for labour force, employment, and hours worked, and the final row of each table indicates tourism’s share of each of these metrics. The share of work that is part time (as opposed to full time) is also provided, as a rough indicator of the labour composition, as well as the unemployment rates.
Where data was not available due to suppression from Statistics Canada, “n/a” has been entered in the table. The three territories are not included in the LFS releases at this level of granularity, so no comparison is possible between the territories and the provinces. The provinces are listed alphabetically.


View more employment charts and analysis on our Tourism Employment Tracker.
[1] As defined by the Canadian Tourism Satellite Account. The NAICS industries included in the tourism sector those that would cease to exist or would operate at a significantly reduced level of activity as a direct result of an absence of tourism.
[2] SOURCE: Statistics Canada Labour Force Survey, customized tabulations. Based on seasonally unadjusted data collected for the period of April 12 to 18, 2026.