
Tourism Employment Begins Summer Wind-Down
The tourism sector[1] in August 2026 saw some contraction of the workforce from July[2], which fits the pattern observed over the past few years, although slightly more pronounced. With trade tensions ramping up and the wildfire season overlapping with big storms and flooding in various parts of the country, tourism employment shrank by nearly 2%.
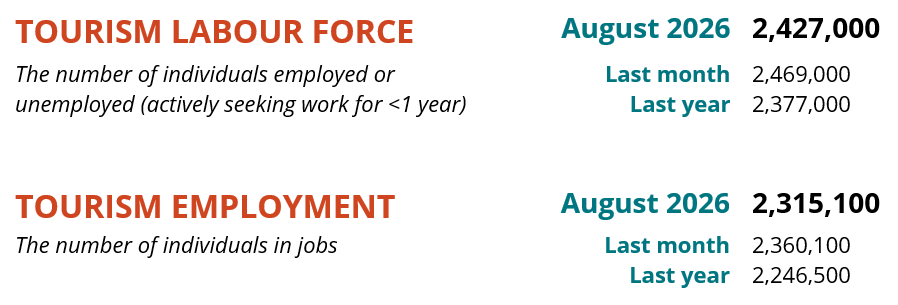
Table 1 provides a snapshot of each industry group’s performance across labour force, employment, and unemployment, as compared with July 2026 [MoM] and August 2025 [YoY], and with August 2019 as a pre-pandemic baseline. Small arrows represent changes of less than 1% (or one percentage point, in the case of unemployment).
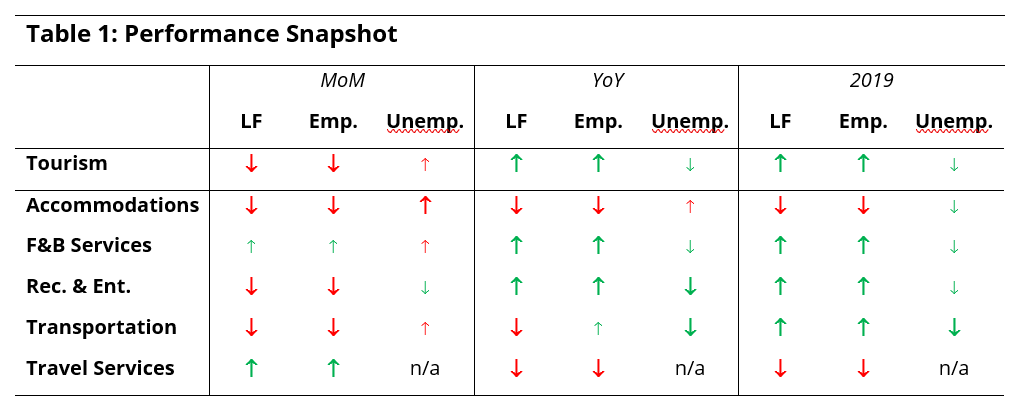
At the industry group level, labour force and employment losses were fairly evenly distributed. Food and beverage services saw slight growth on both indices, and travel services reported modest gains as well, although data pertaining to this industry is not always reliable in the month-over-month analysis. The sector as a whole was in a generally stronger position than last year, and remained overall above 2019 levels, although accommodations remained depressed across the board.
Tourism Sector
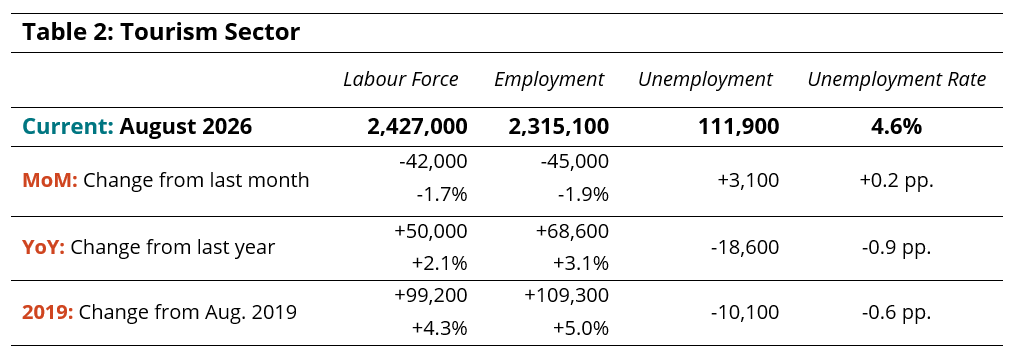
At the aggregate sector level (Table 2), employment fell by around 2% from July, a loss of 45,000 workers. The loss in labour force was slightly smaller, which pulled the unemployment rate up to 4.6%. The sector had grown by between 2% and 3% from last year, and was around 4.5% bigger than in 2019.
As a point of comparison, the wider national economy’s labour force grew slightly, although it also saw losses of around 113,000 people from employment, which pulled the unemployment rate from 6.7% in July to 7.3% in August (calculated using seasonally unadjusted data).
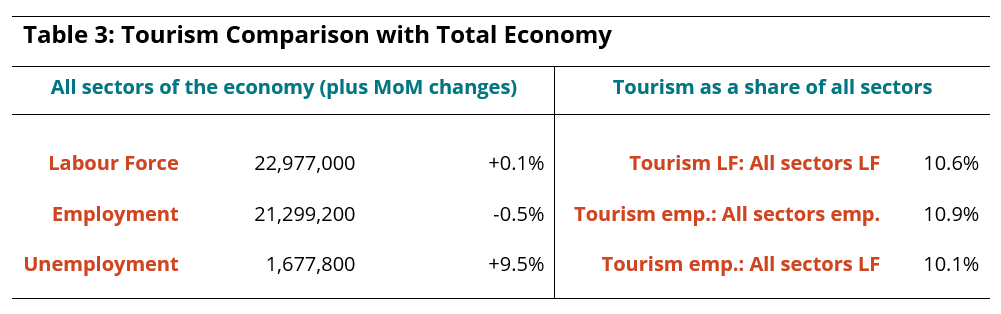
In August, tourism’s share of all employment in Canada was largely unchanged from July, and had risen to a full percentage point higher than in 2019. This may reflect the relative stability of tourism employment in the face of tariff-driven headwinds.
Part-Time and Full-Time Employment
Changes in the ratio of part-time to full-time employment provide a useful perspective on the stability of the tourism workforce. At the aggregate level, there was a slight shift towards full-time employment from July (Figure 1), although there was some variability across the industry groups.
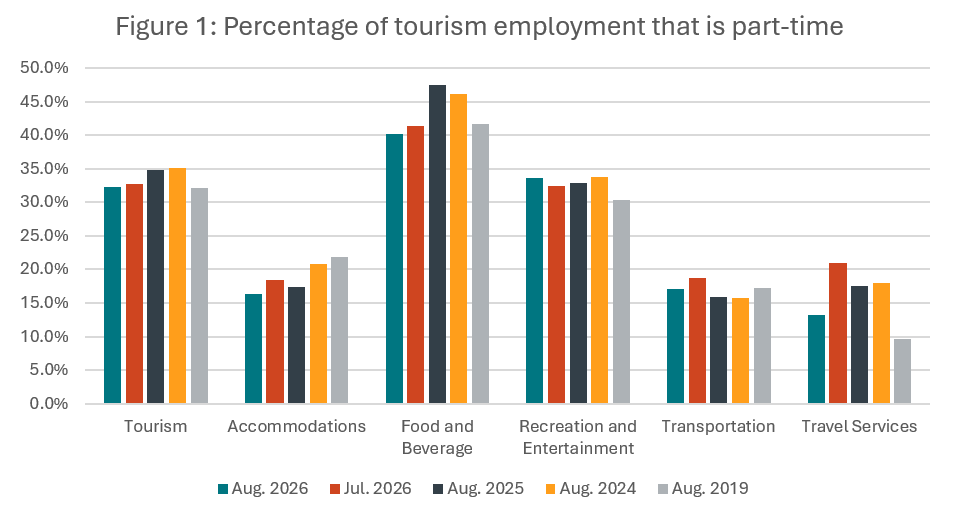
Relative to last year, food and beverage services saw a 7.4 percentage point shift towards full-time employment, and the share of part-time employment fell below 2019 levels again. The general shift over the past few months towards greater full-time employment continued in accommodations, while recreation and entertainment trended gently towards more part-time work. Transportation showed little change, and the large shift in travel services was likely due to data inconsistencies.
Hours Worked
The total number of hours worked provides another useful insight into the stability of the tourism workforce (Figure 2), particularly where part-time employment accounts for a substantial proportion of the workforce, and where businesses can respond to changes in demand by scaling hours worked more quickly than they can adjust their baseline staff rosters (raw employment numbers).
August 2026 saw slight losses in hours worked relative to July (-3%), but had gained 6% over last year, and continued last month’s trend of outpacing 2019 levels by 3.6%.

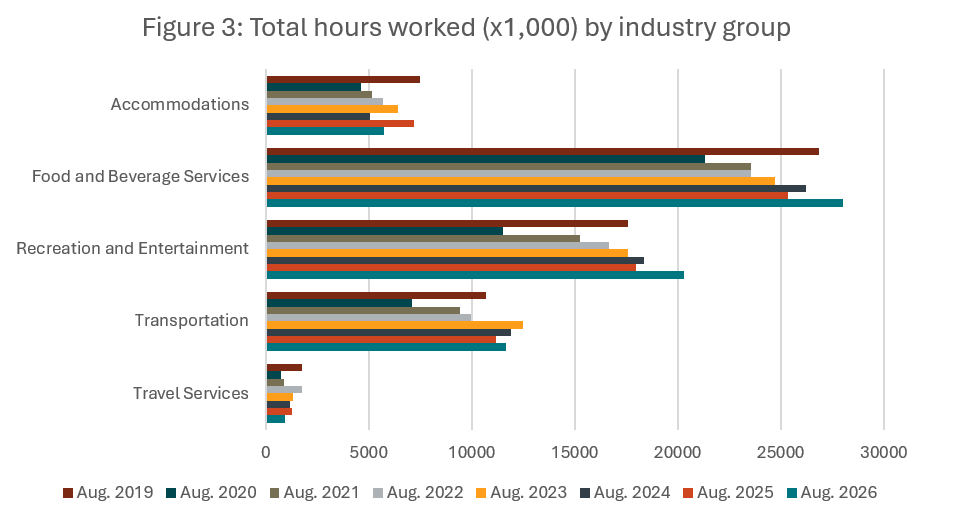
At the industry level (Figure 3), year-over-year patterns show that the bulk of the gains over 2025 were made in food and beverage services and recreation and entertainment, which are also the two biggest overall employers in tourism. Transportation also saw growth from last year, while accommodations saw substantial losses (-20%). Food and beverage services, recreation and entertainment, and transportation all surpassed 2019 levels.
Youth in Tourism
Tourism plays an important role in attaching young people to employment, with its seasonality that aligns closely with academic calendars and its range of flexible opportunities for part-time work throughout the year. The skills and experiences that young Canadians gain through working in tourism will serve them well throughout their lives, regardless of which sector they end up working in. At a time when public discourse is heavily focused on youth unemployment and the myriad challenges facing youth, tourism is well positioned to support youth onto the first rung of the employment ladder.
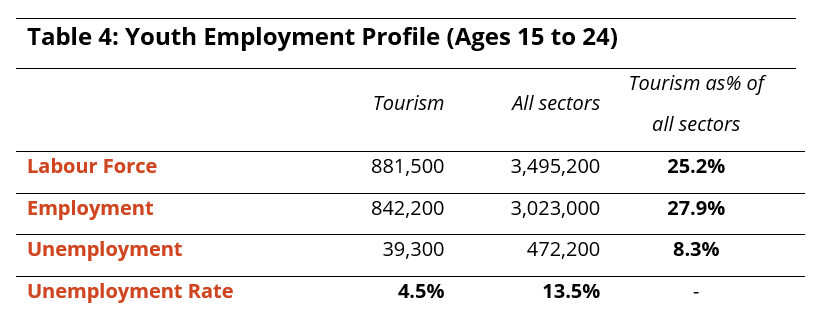
The unemployment rate in August for youth in tourism was one-third of what it was across the total economy (Table 4), with nearly 28% of youth working in tourism. At 4.5%, the youth unemployment rate in tourism had fallen from July by 1.2 percentage points, while its economy-wide counterpart was nudged up by 0.3 percentage points.
As the adoption of AI threatens to undercut entry-level jobs in many sectors and political attention turns to the social and economic perils of those not in education, employment, or training (NEET), tourism continues to punch above its weight in supporting young Canadians who want to work.
Industry Closeup: Accommodations
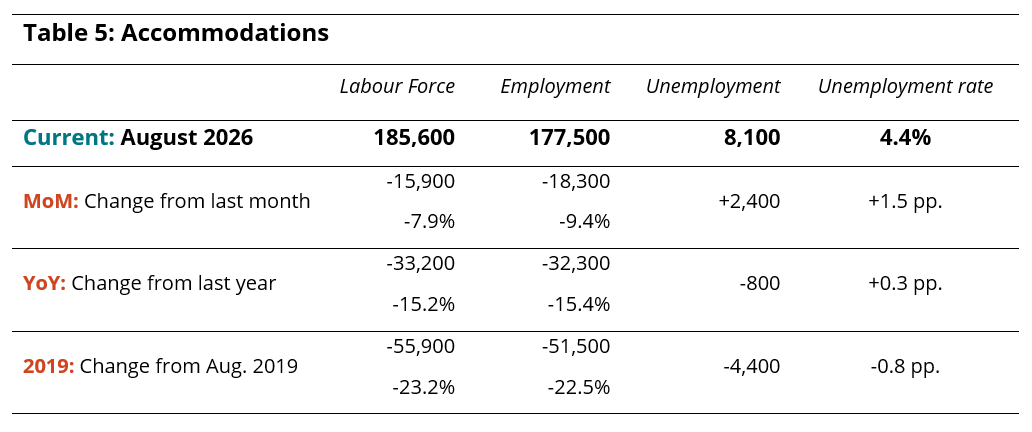
Although the accommodations industry saw some positive movement earlier this year, that has not continued through to the end of the summer (Table 5). Around 18,000 people left work in the industry from July (-9.4%), bringing total employment to just shy of 178,000. The industry was also significantly smaller than this time last year (-15%), and likewise smaller than before the pandemic (-23%). The unemployment rate was slightly higher in August than in July, but was not much different than in 2025 or 2019.
Industry Closeup: Food and Beverage Services
In August, food and beverage services saw only slight gains from July, but this bucked the overall sector-level trend of employment losses (Table 6). Unemployment held largely steady at 4.7%, while the total employment figure sat comfortably above one million. Year-over-year growth was slightly less than 6%, and the net gains from before the pandemic were around 4%. In spite of tightening economic times, Canadians still seem to be eating out, although they are likely shifting to more affordable foodservice options.

Industry Closeup: Recreation and Entertainment
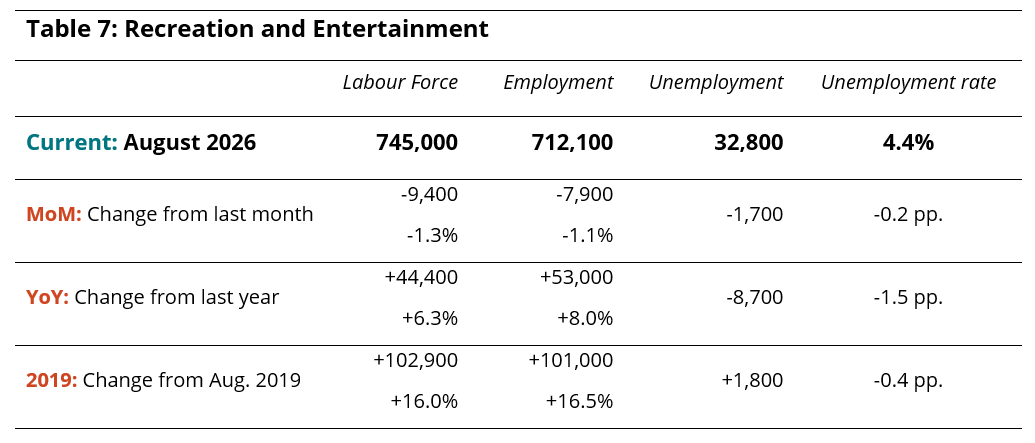
Recreation and entertainment saw small month-over-month losses across both labour force and employment (Table 7), although this is perhaps to be expected, given the consistent growth of the past year could not continue indefinitely. Nevertheless, employment stood at over 700,000, which was a gain of nearly 50,000 people from last year, and over 100,000 from before the pandemic. Unemployment stood at 4.4%, little changed from July.
Industry Closeup: Transportation
The transportation industry saw losses of around 6% from July (Table 8), bringing the August unemployment rate up to 5%. Employment was slightly higher than this time last year, while labour force had fallen, but both indices were around 10% higher than they were before the pandemic. At this level of granularity, it is difficult to determine what is driving this increase, although it seems likely that this is at least partially down to an increase in ride-share drivers, particularly as the line between ride-share and food delivery blurs (e.g., drivers contracting with both Uber and Uber Eats reporting their employment in a way that classifies them as passenger-carrying drivers).

Industry Closeup: Travel Services
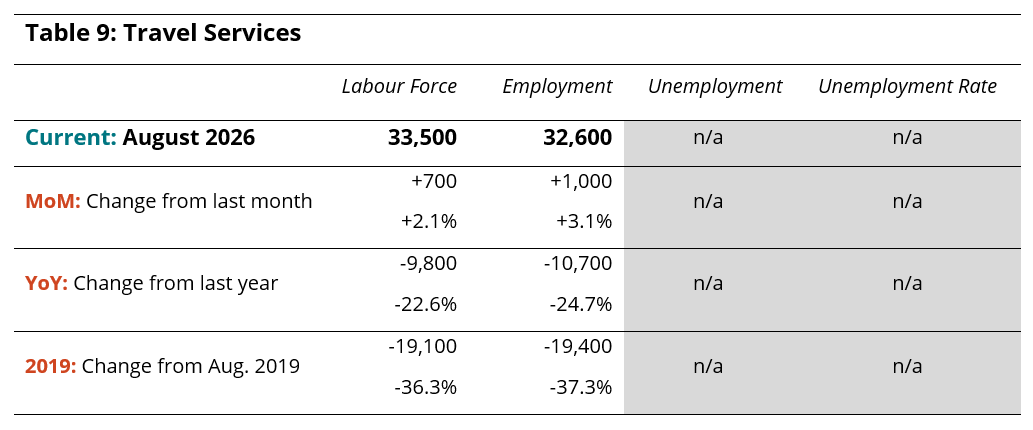
As noted previously, the travel services industry is not always reliably represented in the Labour Force Survey data, due to the sampling methods of the survey and the small size of this industry group. This means that employment and labour estimates are prone to disproportionately large swings from month to month, and that small changes in absolute terms can become exaggerated when normalized to percentages. Table 9 provides LFS estimates for travel services in August 2026, but should be used cautiously.
Provincial Perspectives
The Canadian economy is subject to some pronounced regional differences, and that is particularly true in the tourism sector. Figure 4 provides a comparison of provincial unemployment rates, for the tourism sector in particular and for the total labour force (i.e., comprising all industries).
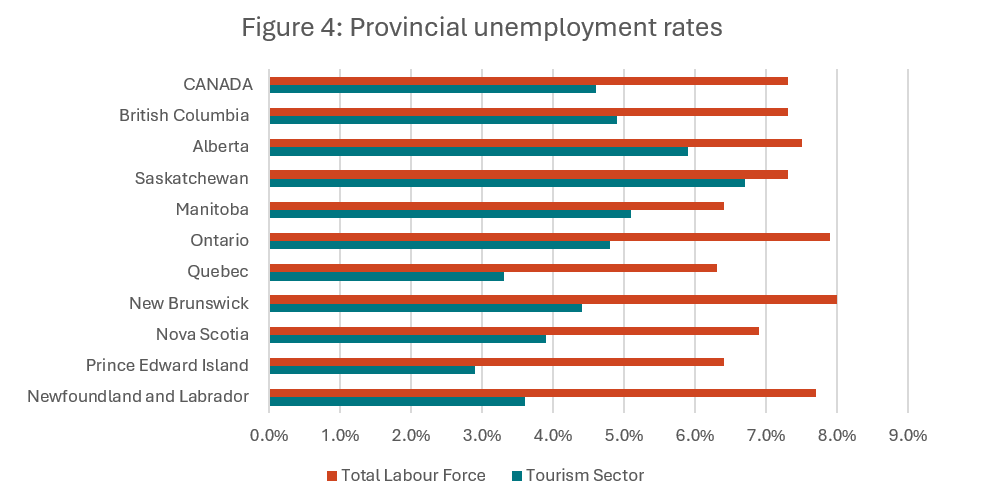
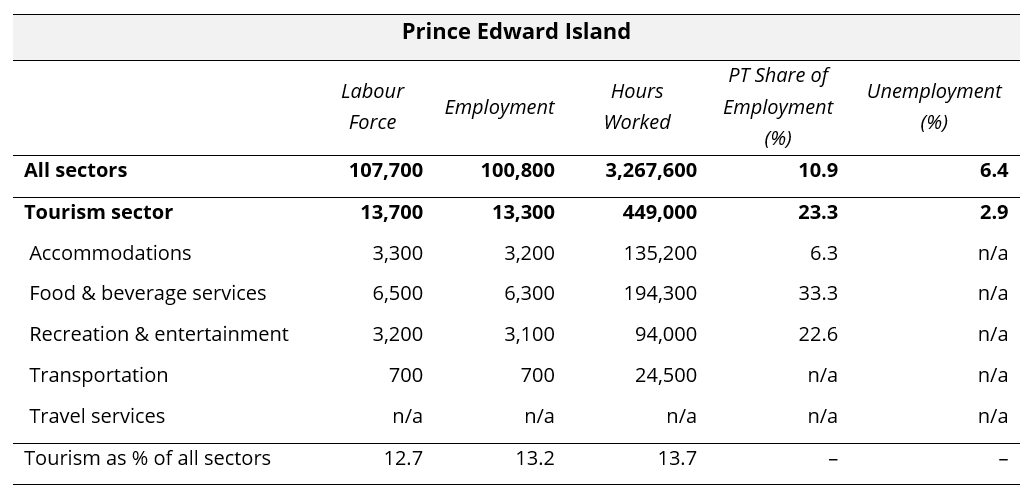
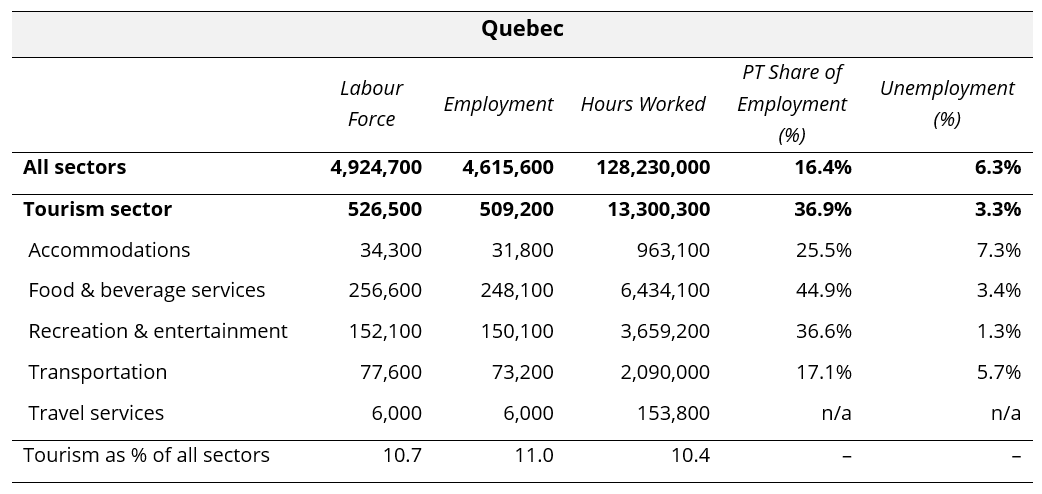
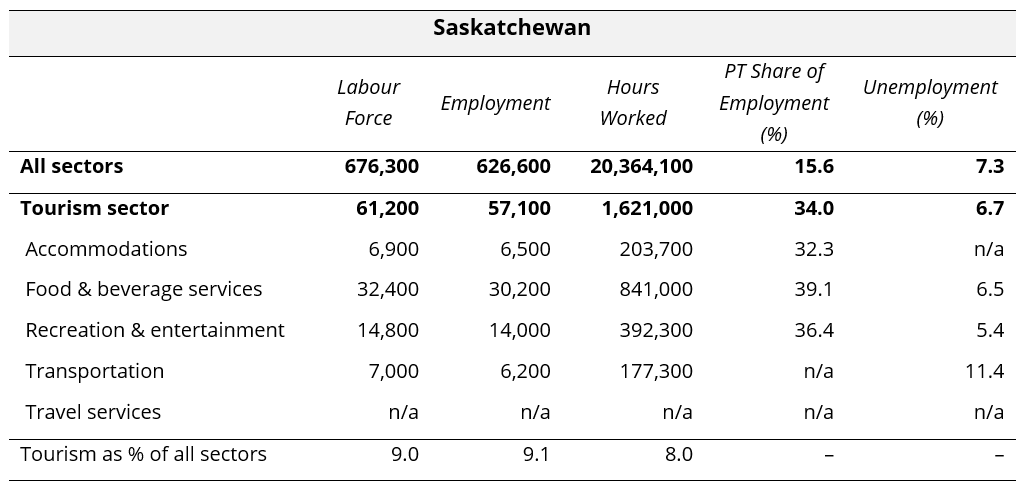
In August, the national tourism unemployment rate was 4.6%, below the economy-wide national average of 7.7% (calculated using seasonally unadjusted data). This pattern held across all provinces, with tourism unemployment rates consistently lower than those across the broader economies. Tourism unemployment rates ranged from 2.9% in Prince Edward Island and 3.3% in Quebec, to 5.9% in Alberta and 6.7% in Saskatchewan.
Provincial Summaries for August 2026
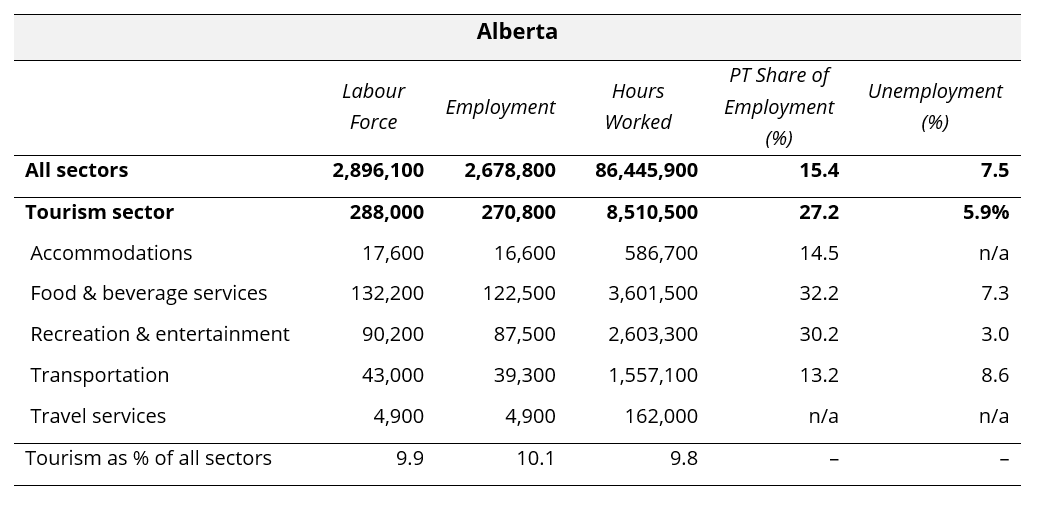
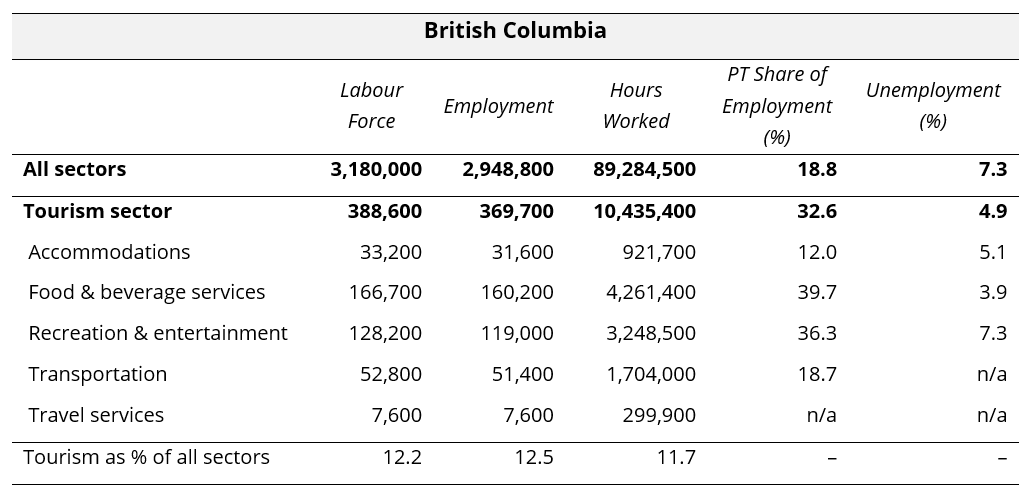
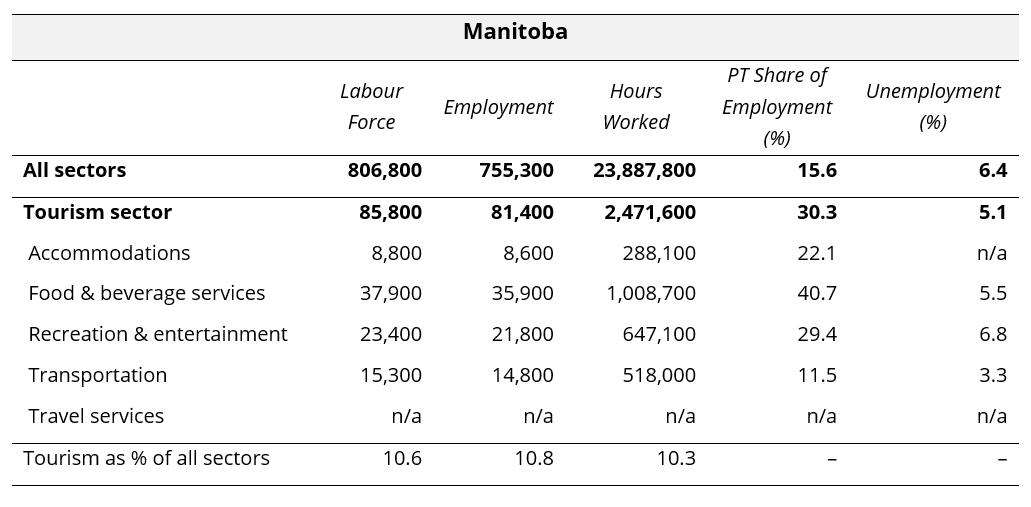
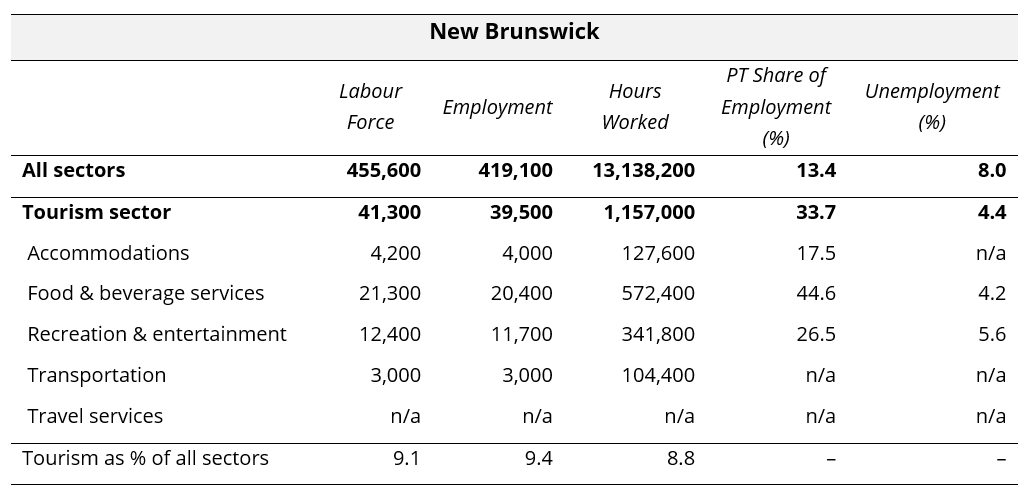
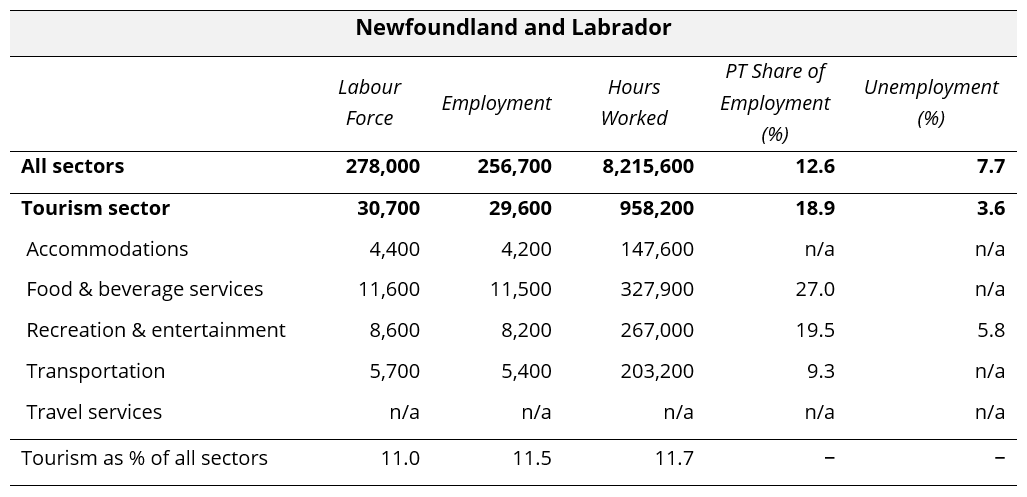
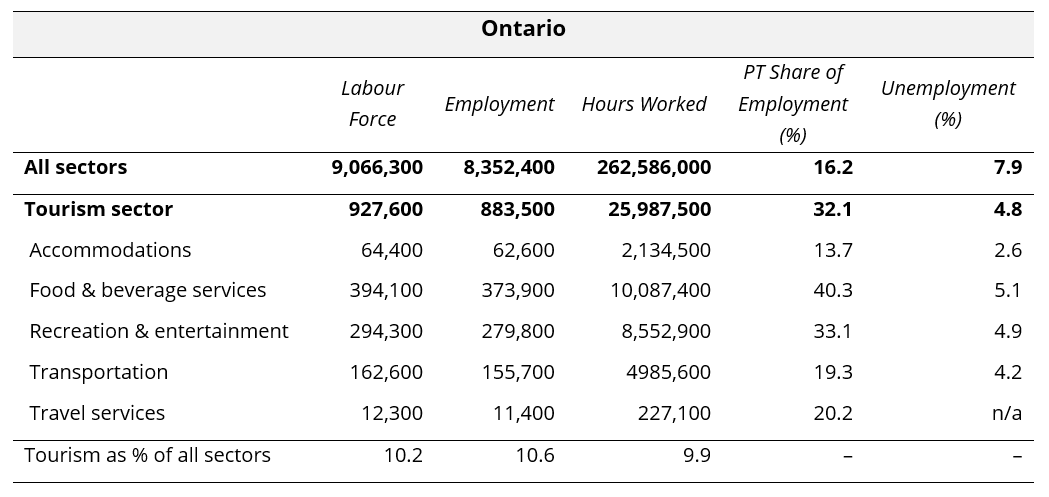
The following ten tables provide August 2026 summaries for the provinces, focusing on tourism and its five industry groups. Comparison data is provided for the larger provincial economy, as a benchmarking reference. Seasonally unadjusted estimates are provided for labour force, employment, and hours worked, and the final row of each table indicates tourism’s share of each of these metrics. The share of work that is part-time (as opposed to full-time) is also provided, as a rough indicator of the labour composition, as well as the unemployment rates.
Where data was not available due to suppression from Statistics Canada, “n/a” has been entered in the table. The three territories are not included in the LFS releases at this level of granularity, so no comparison is possible between the territories and the provinces. The provinces are listed alphabetically.

View more employment charts and analysis on our Tourism Employment Tracker.
[1] As defined by the Canadian Tourism Satellite Account. The NAICS industries included in the tourism sector those that would cease to exist or would operate at a significantly reduced level of activity as a direct result of an absence of tourism.
[2] SOURCE: Statistics Canada Labour Force Survey, customized tabulations. Based on seasonally unadjusted data collected for the period of August 9 to 15, 2026.