
Accommodations Industry Gains Against an Overall Sector Decline.
The tourism sector[1] in March 2026 saw declines in both labour force and employment from the previous month[2]. Both indices were, however, up on last year, and also on 2019 as a pre-pandemic baseline, indicating that the sector is continuing to grow.
The broader national economy saw very little change on a seasonally unadjusted basis, with very slight gains on both labour force and employment. March is often a slow month in the tourism labour cycle, so this temporary dip is not unexpected.
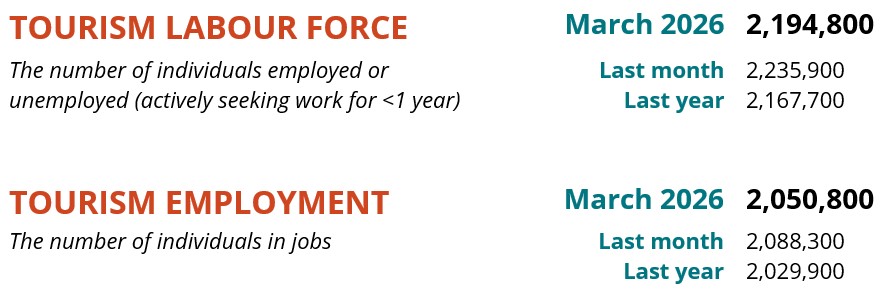
Table 1 provides a snapshot of each industry group’s performance across labour force, employment, and unemployment, as compared with February 2026 [MoM], March 2025 [YoY], and March 2019 as a pre-pandemic baseline. Small arrows represent changes of less than 1% (or one percentage point, in the case of unemployment).

Bucking recent trends, accommodations alone saw month-over-month gains, while all other industry groups shrank from February. Relative to last year, the sector’s overall growth was driven entirely by strong performances in transportation and in recreation and entertainment, both of which have shown fairly consistent gains over the past couple of years. The picture was much the same with respect to 2019, with accommodations and food and beverage services—and, less reliably, travel services—all remaining below pre-pandemic levels.
Tourism Sector
The tourism sector overall lost around 37,500 workers in March, a loss of nearly 2% from February. However, year-over-year there was growth of around 1% across both labour force and employment, suggesting that the March dip is part of the normal seasonal dip across the sector. The aggregate sector was around 2% larger than it was pre-pandemic. Table 2 provides a summary of sector-level labour statistics.

Across all sectors of the economy, there was very little change from February across labour force or employment, although the total number of unemployed people rose by 2.7% (see Table 3). The economy-wide unemployment rate was 7%, slightly higher than tourism’s 6.6% (calculated using seasonally unadjusted data).

Tourism employment accounted for 9.9% of all employment in Canada, basically unchanged from February. Around 9.2% of the Canadian labour force worked in tourism.
Part-Time and Full-Time Employment
The ratio of part-time to full-time work can provide an interesting perspective on the stability of the labour force. Tourism typically has a fairly high share of part-time workers (defined by Statistics Canada as working fewer than 30 hours per week), although the ratio varies across industry groups (see Figure 1).

March saw a slight overall decrease in part-time work from February (orange bars), consistent across most industry groups but bucked by transportation, with saw a slight increase. The part-time ratio has increased slightly year-over-year at the sector level, with the most consistent pattern seen in transportation. The most consistent decrease has been seen in accommodations, which is unsurprising given the labour challenges this industry has been facing recently.
Hours Worked
Total hours worked is another useful metric for assessing the stability of the labour force, as businesses can more rapidly scale shifts in response to customer demand than they can hire new workers or shrink their employee roster. Figure 2 provides a sector-level view of hours worked, while Figure 3 presents a year-over-year comparison across industry groups.

The total hours worked across tourism in March was slightly higher than it was February (+0.7%), and also slightly higher that last year (+1.0%), although it remained below 2019 levels (-4.0%). There has been a steady incremental annual increase since 2023, however, which is a positive sign that the sector is continuing to grow, albeit slowly.
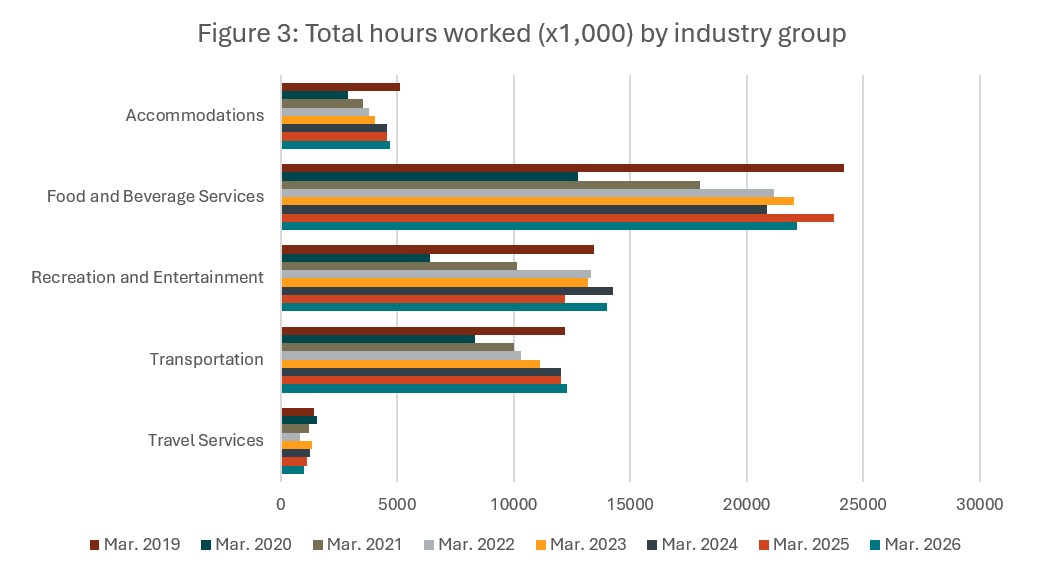
At the industry level, the total hours worked this March surpassed last year’s total in recreation and entertainment (+14.9%), accommodations (+2.7%), and transportation (+2.3%), while the total dropped in food and beverage services (-6.6%) and in travel services (-11.5%). These trends mirror changes in employment levels, discussed in the following sections. Only recreation and entertainment and transportation had surpassed the total hours worked in March 2019, although there has been fairly steady growth since the pandemic across most industry groups.
Industry Closeup: Accommodations
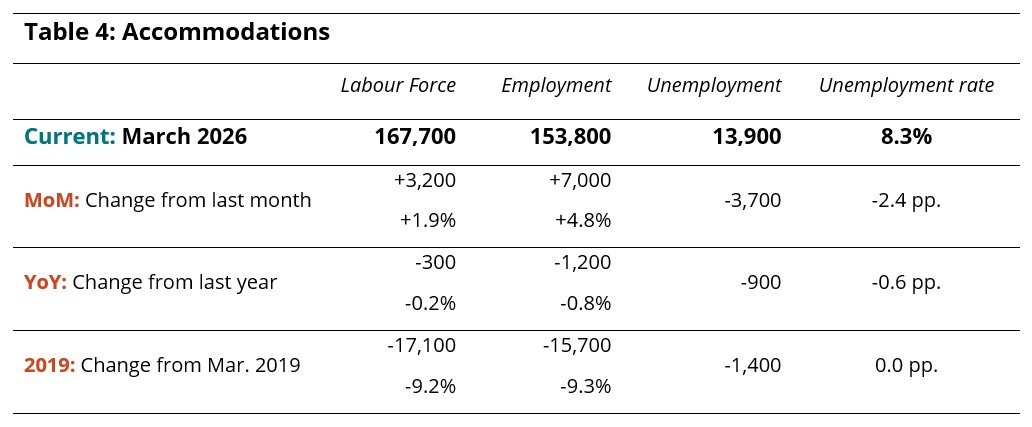
Accommodations was the only industry group to see month-over-month gains from February (Table 4), although the totals for both labour force and employment marked a slight decrease from last year, and remained substantially below 2019 levels. Hopefully, this early increase for 2026 marks the beginning of a strong season as businesses look to fill their positions ahead of the summer.
Industry Closeup: Food and Beverage Services
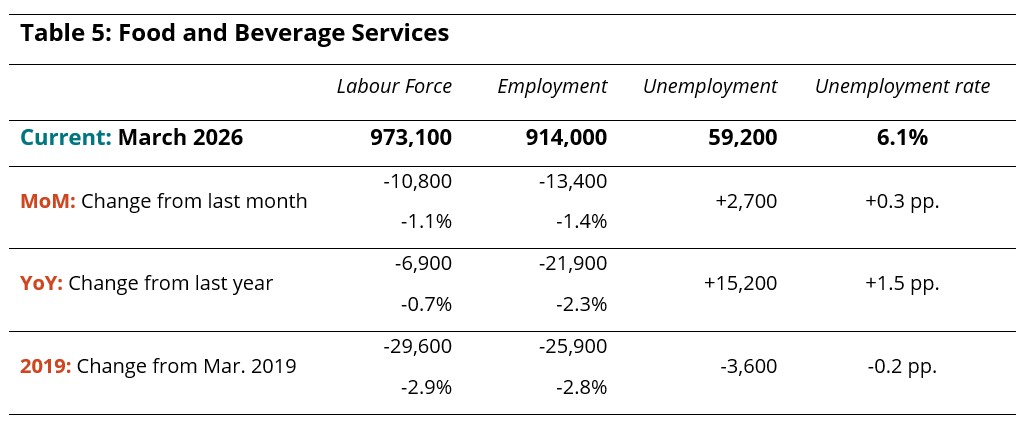
Both labour force and employment fell by around 1% from February (Table 5), pulling the unemployment rate up slightly to 6.1%. The industry group also remained below March 2025 levels and March 2019 levels. This industry has been struggling for a while to regain ground lost over the pandemic; given the extent to which youth find employment in food and beverage services, this may signal a change in the extent to which youth are interested in working (or are financially compelled to work) part-time while studying. This remains an open question, however, and one that we will monitor.
Industry Closeup: Recreation and Entertainment
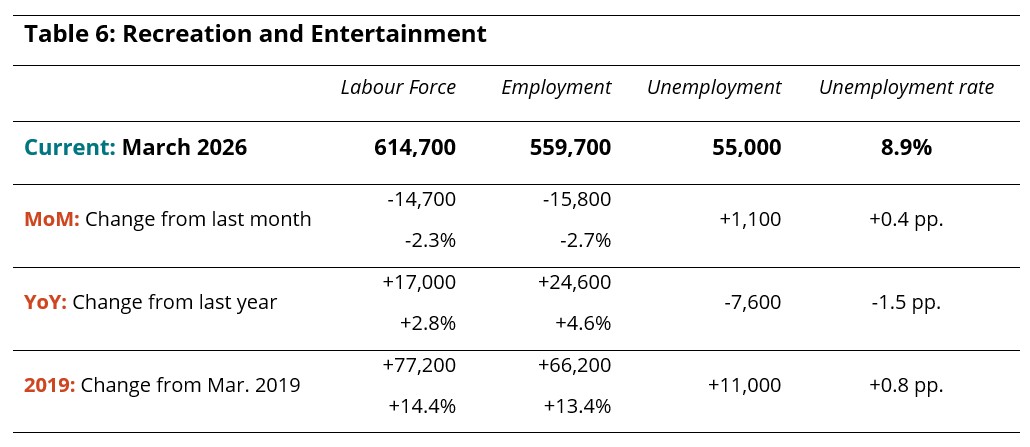
Running counter to general trends of strong growth over the past two years, recreation and entertainment saw a loss of around 2.5% across both labour force and employment in March (Table 6), and an increase in the unemployment rate to 8.9%. However, the sector remained in a stronger position relative to last March, and continued to outperform pre-pandemic levels.
We have seen some degree of month-to-month volatility in this industry over the past year, suggesting that it’s facing some uncertainty. This may be climate related (as many recreational pursuits are weather dependent), or related to financial pressures that constrain recreational spending.
Industry Closeup: Transportation
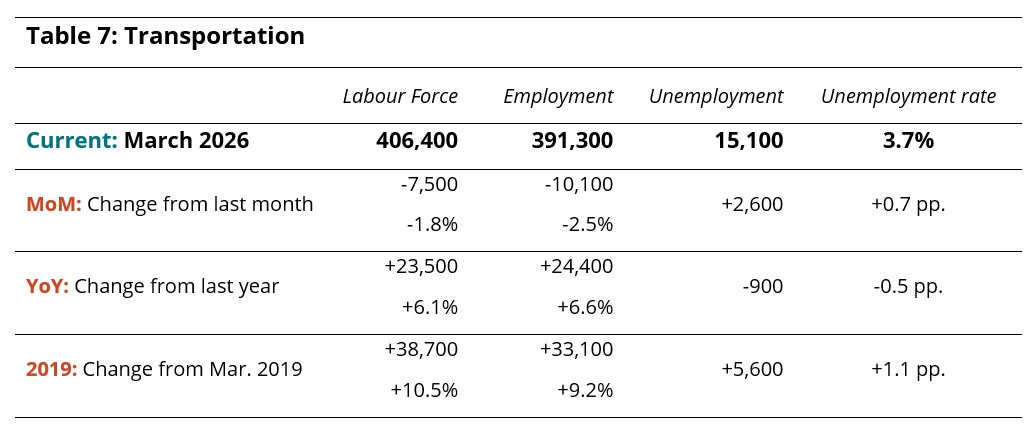
Transportation has been a fairly strong performer in the last two years, but saw a contraction across both labour force and employment from February (Table 7). This decrease was comparable to that seen in recreation and entertainment (around 2%), which is interesting to note as these two industries have been broadly parallel in their trajectories over the past few years. Transportation was up on last year and on 2019 across both labour force and employment.
Industry Closeup: Travel Services
Data relating to the travel services industry should be treated with caution, as its share of the total Canadian economy is so small that it is poorly represented in a survey with the sample size used in the Labour Force Survey. This makes it prone to disproportionately large swings from month to month, as well as encountering data suppression issues. The information in Table 8 should therefore be taken as broadly indicative of the state of the industry, but not as an accurate snapshot of any specific moment in time. As of March 2026, labour force and employment remained substantially below pre-pandemic levels.

Provincial Perspectives
The Canadian economy is subject to some pronounced regional differences, and that is particularly true in the tourism sector. Figure 4 provides a comparison of provincial unemployment rates, for the tourism sector in particular and for the total labour force (i.e., comprising all industries).
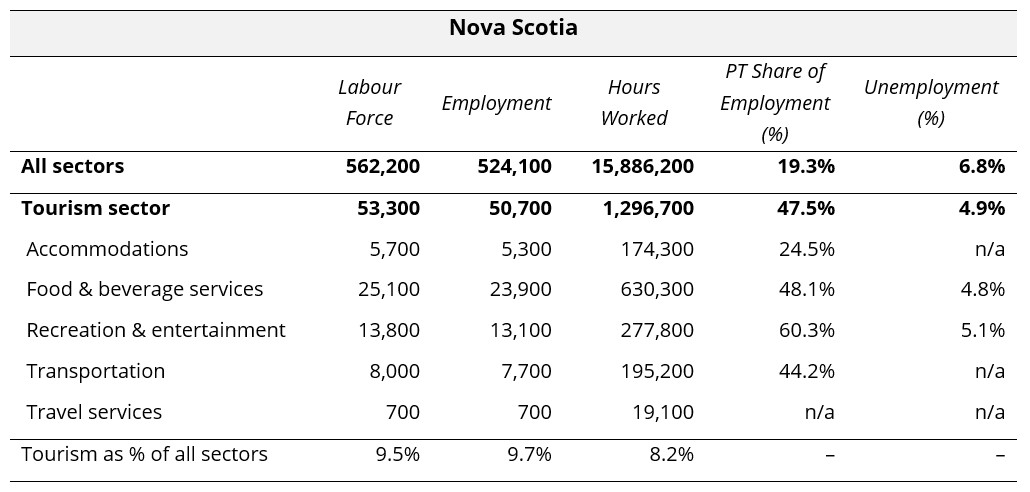
In March 2026, the national unemployment rate in tourism was lower than that of the total economy, a pattern which held true in five provinces: Alberta, Manitoba, Ontario, New Brunswick, and Nova Scotia. In the other provinces, tourism unemployment rates were higher than in their respective overall economies.
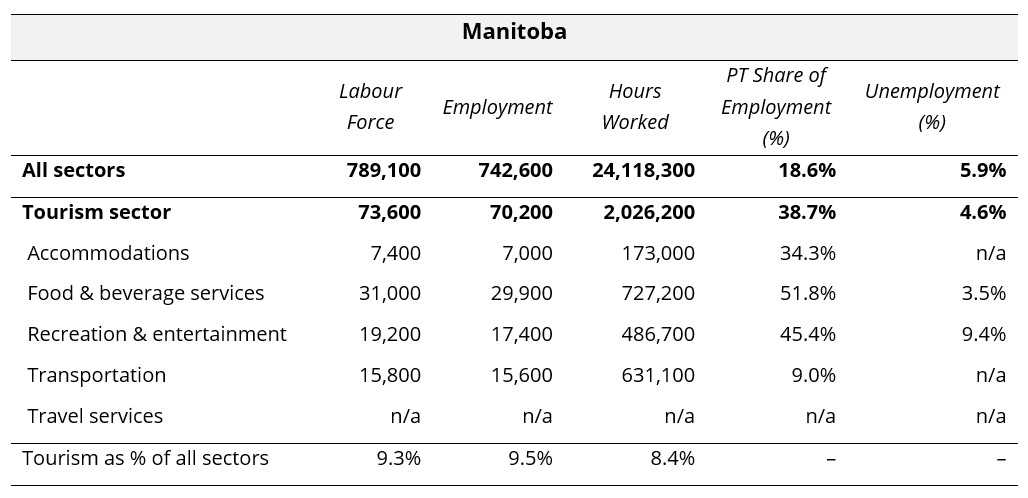
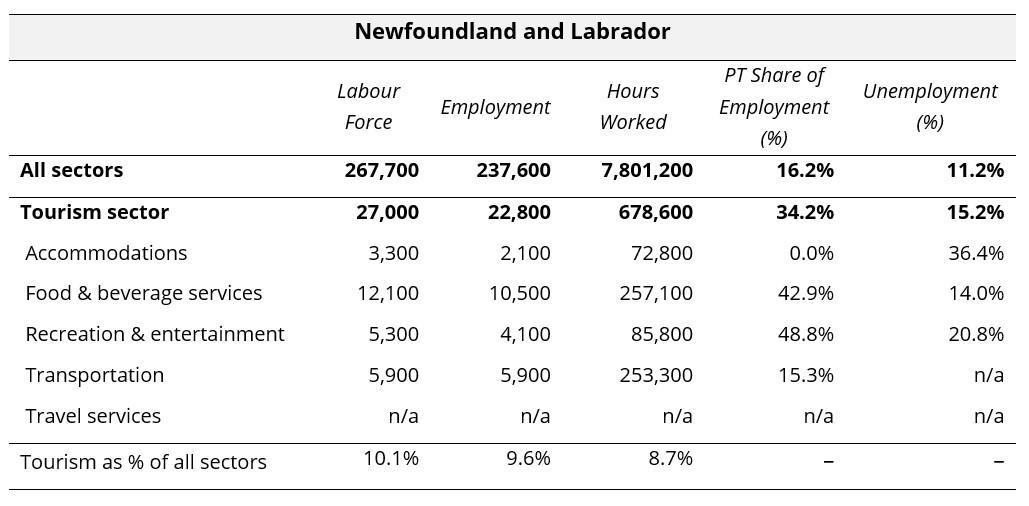
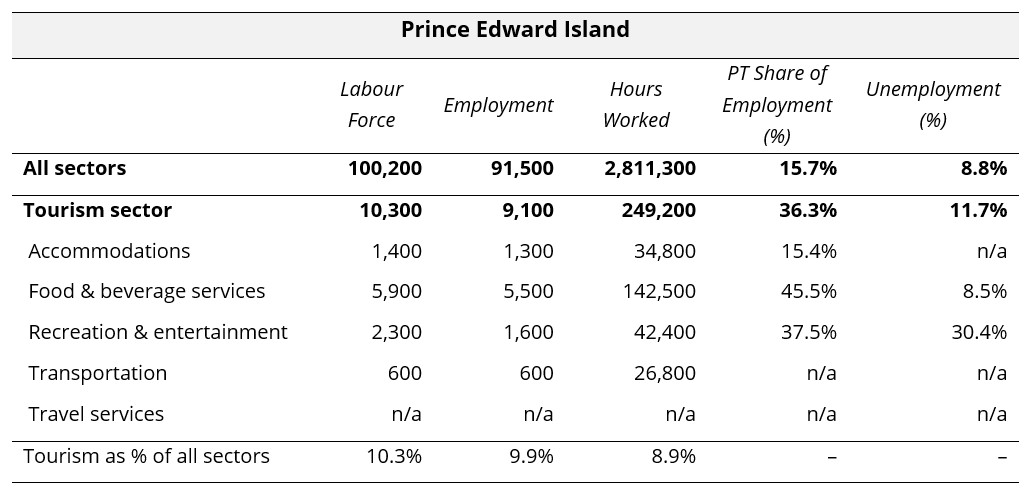
Tourism unemployment rates were highest in Newfoundland and Labrador (15.2%) and in Prince Edward Island (11.7%), and lowest in Manitoba (4.6%) and Alberta (4.7%).

Provincial Summaries for March 2026
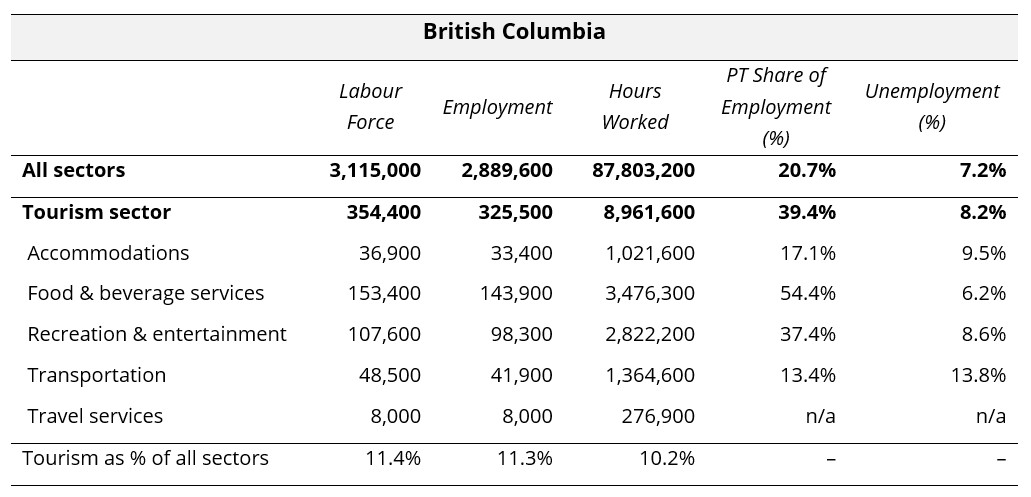
The following ten tables provide March 2026 summaries for the provinces, focusing on tourism and its five industry groups. Comparison data is provided for the larger provincial economy, as a benchmarking reference. Seasonally unadjusted estimates are provided for labour force, employment, and hours worked, and the final row of each table indicates tourism’s share of each of these metrics. The share of work that is part-time (as opposed to full-time) is also provided, as a rough indicator of the labour composition, as well as the unemployment rates.
Where data was not available due to suppression from Statistics Canada, “n/a” has been entered in the table. The three territories are not included in the LFS releases at this level of granularity, so no comparison is possible between the territories and the provinces. The provinces are listed alphabetically.





View more employment charts and analysis on our Tourism Employment Tracker.
[1] As defined by the Canadian Tourism Satellite Account. The NAICS industries included in the tourism sector those that would cease to exist or would operate at a significantly reduced level of activity as a direct result of an absence of tourism.
[2] SOURCE: Statistics Canada Labour Force Survey, customized tabulations. Based on seasonally unadjusted data collected for the period of March 15 to 21, 2026.