
Employment Grows as Summer Comes into Its Own.
Although the number of Canadians visiting the United States has continued to edge up over recent months[1], many continue to choose to focus on other destinations for their travel plans. This trend has supported moderate month-over-month labour force and employment gains for the tourism sector[2] in June 2026[3], bringing tourism employment up to 2.27 million across the country.
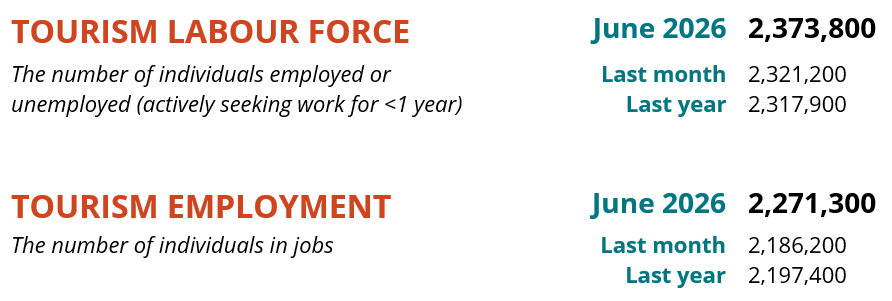
Table 1 provides a snapshot of each industry group’s performance across labour force, employment, and unemployment, as compared with May 2026 [MoM] and June 2025 [YoY], and with June 2019 as a pre-pandemic baseline. Small arrows represent changes of less than 1% (or one percentage point, in the case of unemployment).
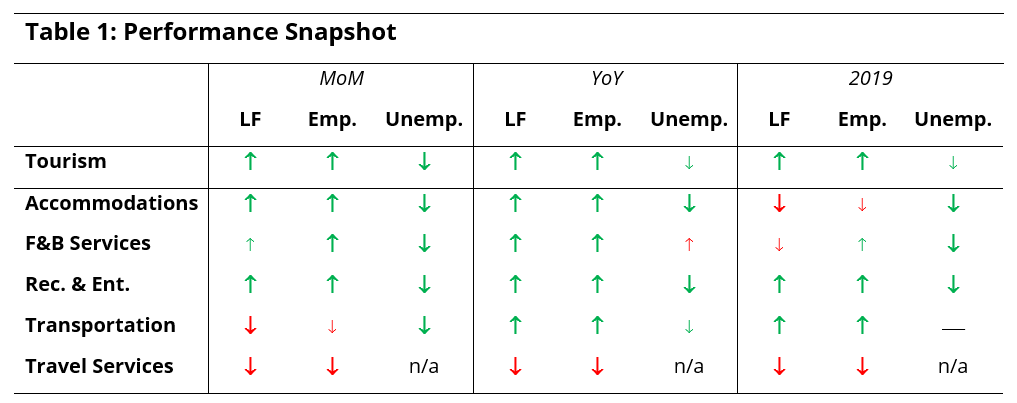
At the industry group level, most industries grew both their labour force and employment complements from May, with higher gains in employment pulling down unemployment rates. Transportation saw month-over-month decreases, although this is seasonally normal as this industry group includes school bus drivers, many of whom stopped working as the school year wrapped up.
Most industry groups were also in a much stronger position than last year as well. Data pertaining to travel services continues to show that the industry remains depressed, and while the specifics of the data remain unreliable (as we have discussed in previous months), the overall trend of failure to rebound following COVID-19 continues.
Tourism Sector
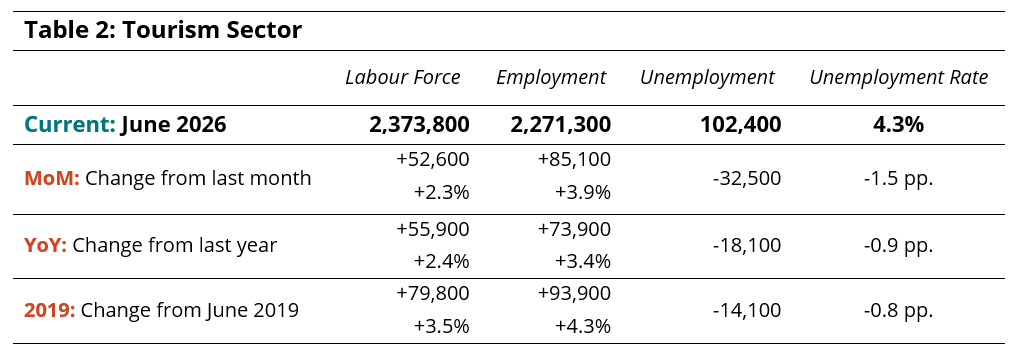
At the sector level, there was moderate growth in both labour force and employment from May, with around 53,000 people entering the labour pool and 85,000 finding work (Table 2). This drew the unemployment rate down to 4.3%.
The sector was in a comparable position with respect to last year, with gains of between 2% and 4% on both indices. Growth was slightly more pronounced relative to 2019, although as has generally been the case for the past two years, this growth was predominantly in two industries: recreation and entertainment and transportation.
The tourism sector’s net gains outpaced those of the broader national economy (Table 3), with nearly 40% of all new employment based in the tourism sector. The economy-wide unemployment rate dropped by 0.5 percentage points to 6.1% (calculated using seasonally unadjusted data), while the unemployment rate in tourism remained comfortably below that (-1.8 percentage points).

Tourism employment accounted for 10.5% of all employment in Canada, slightly higher than last month (+0.3 percentage points), and also higher than in June 2019 (+0.8 percentage points). Around 9.9% of the overall Canadian labour force held a job in tourism, a slight increase from May.
Part-Time and Full-Time Employment
The ratio of part-time to full-time work provides an interesting perspective on the stability of the labour force, particularly in industries that offer a lot of part-time work through the off-peak seasons but ramp up their full-time complement over the summer. Year-over-year comparisons also offer insight into shifts in the sector’s overall composition. While tourism generally sees an aggregate part-time share of employment of around 40%, there is considerable variation between industries (Figure 1).
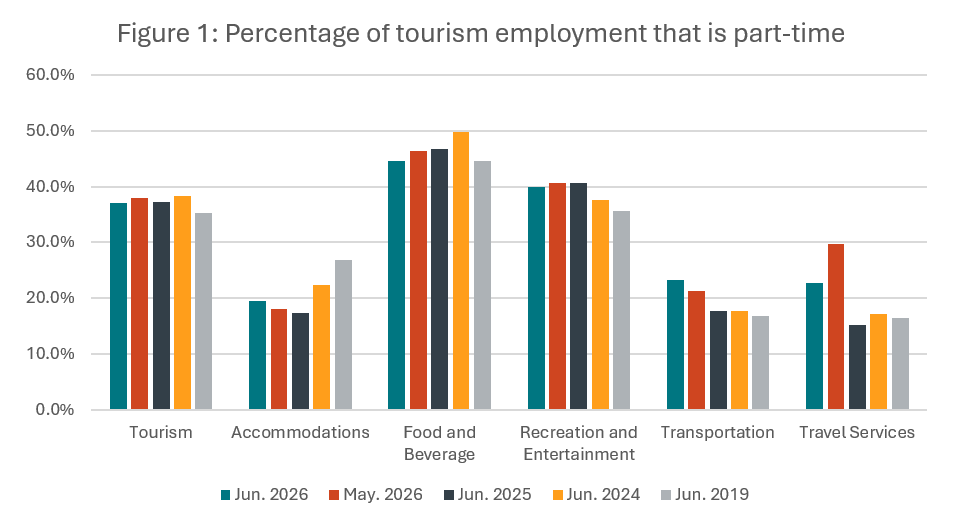
There was little change in the part-time share from May at the sector level, with a net shift towards full-time work of 0.7 percentage points. The sector had slightly more part-time employment than in June 2019, although the difference is not great.
At the industry group level, accommodations saw a slight shift towards more part-time work but remained substantially below pre-pandemic levels (7.5 percentage points). Food and beverage services saw a slight decrease in part-time employment, returning to pre-pandemic patterns, while recreation and entertainment saw very little month-over-month change, but was 4.3 percentage points more reliant on part-time workers than it was in 2019. Transportation saw a modest shift towards more part-time work from May, which amounted to a more substantial increase relative to previous years (around +6 percentage points). Travel services—to the extent that the recent data is reliable—shows a month-over-month decrease in part-time work but a year-over-year increase.
Hours Worked
The total number of hours worked offers another useful perspective on the tourism workforce (Figure 2), as this metric is more immediately responsive to changes in customer demand than raw employment figures alone. Hours worked in June increased by 5.6% from May, and were around 3.5% higher than last year, although they remained just shy (-0.6%) of 2019 levels.

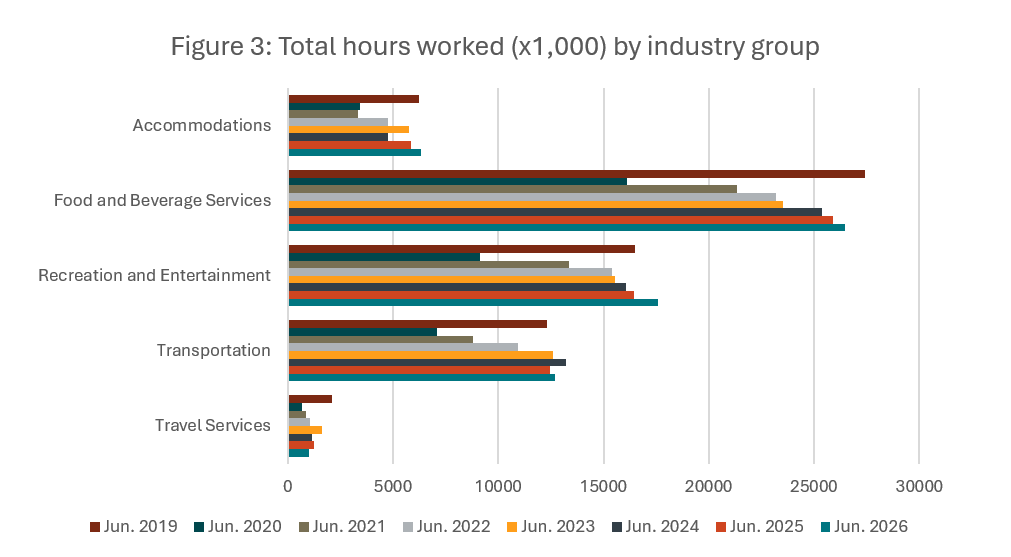
At the industry level (Figure 3), total hours worked trended upward across all industry groups expect travel services, with the largest relative gain seen in accommodations (+8%). Accommodations, recreation and entertainment, and transportation had all surpassed 2019 totals, while food and beverage services—although generally showing consistent growth year-over-year—remained below this benchmark.
Youth in Tourism
Tourism plays an important role in attaching young people to employment, with its seasonality that aligns closely with the academic calendar and its range of flexible opportunities for part-time work throughout the year. The skills and experiences that young Canadians gain through working in tourism will serve them well throughout their lives, regardless of which sector they end up working in. At a time when public discourse is heavily focused on youth unemployment and the myriad challenges facing youth, tourism is well-positioned to support youth onto the first rung of the employment ladder.
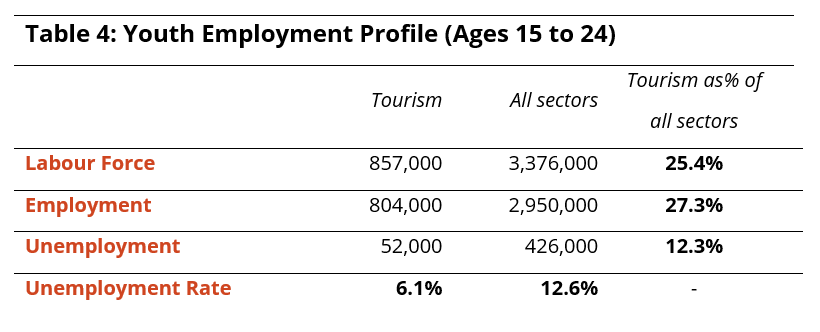
The sector continues to provide better labour market outcomes for youth than the overall Canadian economy (Table 4), with over one-quarter of all working youth holding a job in tourism. However, only 12% of all unemployed youth are looking for work in tourism, with a youth unemployment rate in our sector of 6.1% compared to 12.6% across all sectors.
Industry Closeup: Accommodations
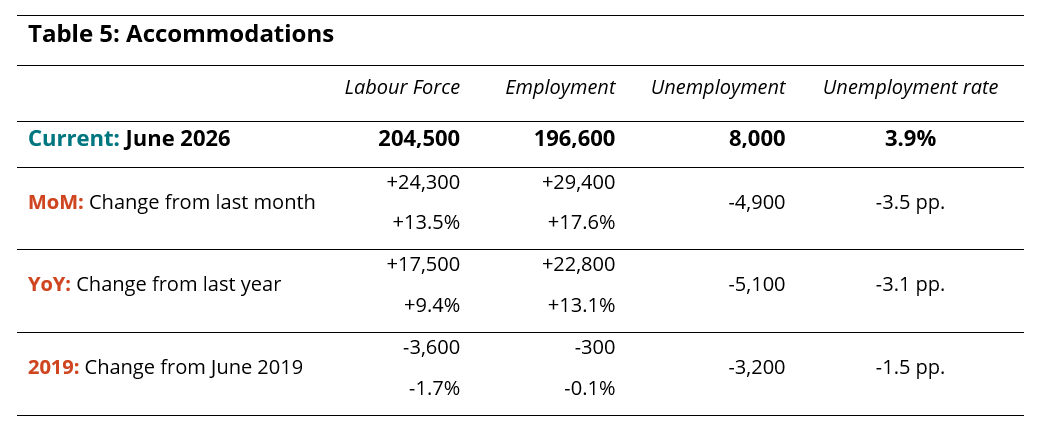
Both labour force and employment saw substantial gains from May (+13.5% and +17.6%, respectively), with a net gain of nearly 30,000 employees in June (Table 5). There were around 23,000 more people working in accommodations than this time last year, and although the industry fell just shy of surpassing 2019 levels, the gap has continued to narrow. The unemployment rate fell to 3.9%, the lowest it has been since June 2024.
Industry Closeup: Food and Beverage Services
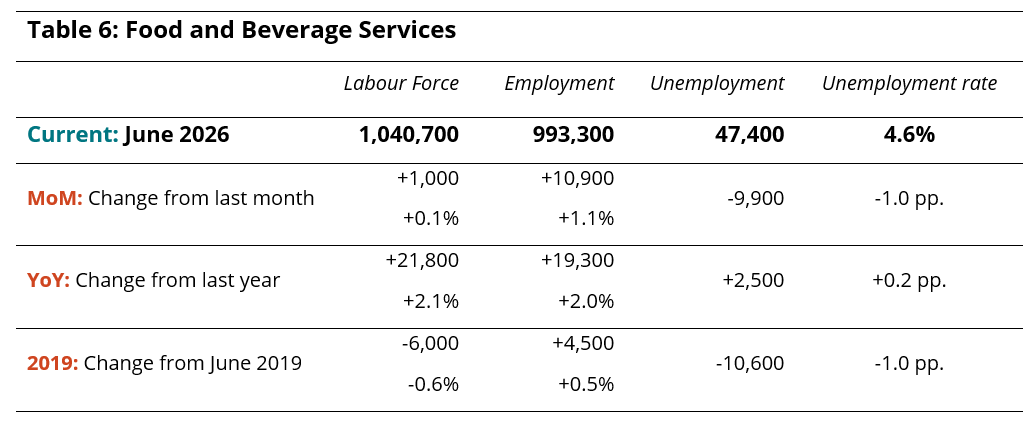
There was very little change from May in food and beverage services (Table 6), with a slight increase in employment (+1.1%) and almost no movement in labour force. Combined, these worked to bring the unemployment rate down to 4.6%, which is comparable to the unemployment rates observed most summers. In spite of slower growth from May, both employment and labour force grew relative to last year, and employment edged past 2019 levels.
Industry Closeup: Recreation and Entertainment
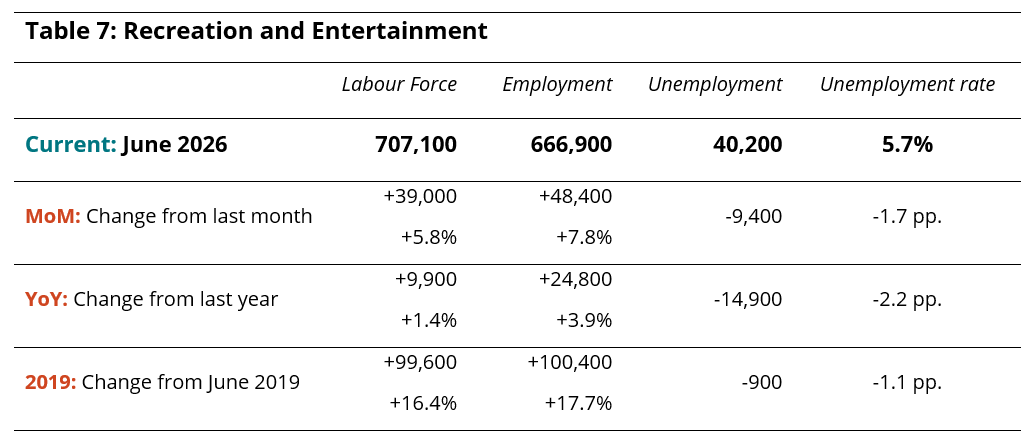
Recreation and entertainment continued to show strong performance in June (Table 7), with nearly 50,000 people finding work. Employment figures were also elevated compared with last year, and the sector was 100,000 people stronger than it was in 2019. The unemployment rate lowered to 5.7%.
Industry Closeup: Transportation
Transportation saw a decrease in both labour force and employment from May (Table 8), likely due to the end of the school year and the impact this can have on bus drivers. However, the industry retained its strong position relative to last year, and has continued to outperform 2019 levels, as it has for a couple of years. The unemployment rate fell to 1.4%, driven by the larger decrease in labour force than in employment.

Industry Closeup: Travel Services
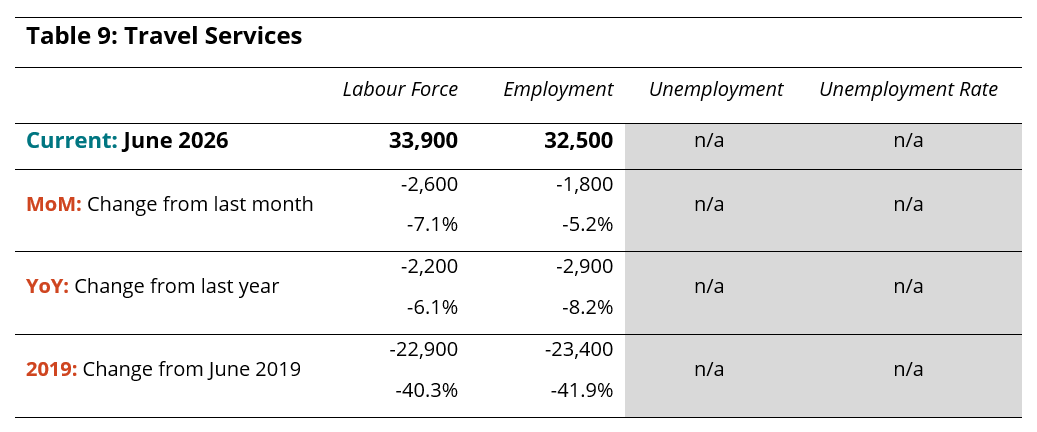
As always, data for travel services is not always reliable, as it is prone to disproportionately large swings from month to month. Partly this is an effect of the sampling in the Labour Force Survey (LFS), and partly because of the relatively small proportion of the Canadian workforce that this industry represents. It is not uncommon to find month-over-month changes of plus or minus 5% to 10%, without any consistent direction of change. Additionally, the tendency for small absolute differences to become exaggerated when turned into percentages can skew the interpretation of the LFS findings.
The data provided in Table 9 reflects the June 2026 LFS estimates, but should be treated with caution. It suggests some decrease relative to last month and last year, but more reliable is the order of magnitude of the difference from 2019, which indicates that, although the raw numbers may not be entirely reliable, the sector has failed to rebound to its pre-pandemic levels, and given the long-range continuity of this shortfall, it seems unlikely that the industry group will ever return to its previous size. The increased popularity of online booking services and AI-generated itineraries can likely account for a lot of the industry’s contraction.
Provincial Perspectives
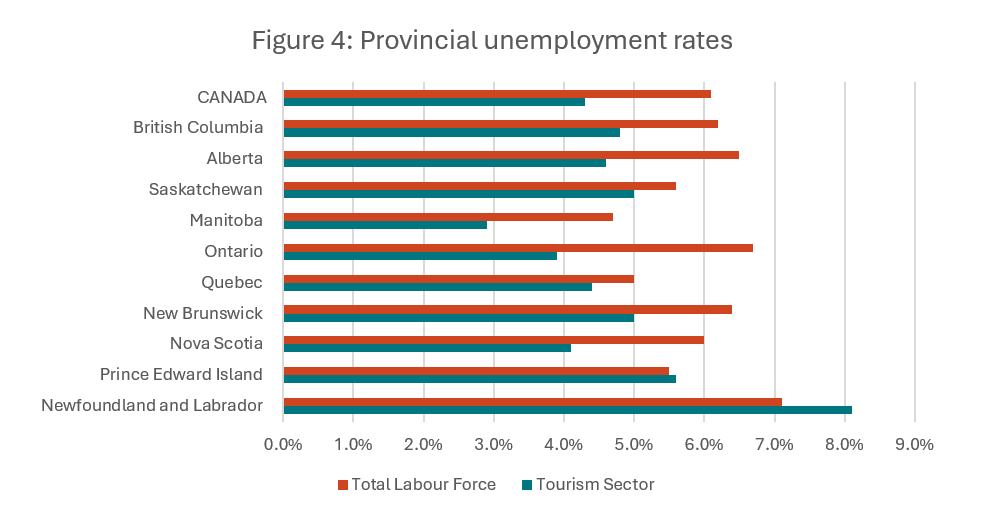
The Canadian economy is subject to some pronounced regional differences, and that is particularly true in the tourism sector. Figure 4 provides a comparison of provincial unemployment rates, for the tourism sector in particular and for the total labour force (i.e., comprising all industries).
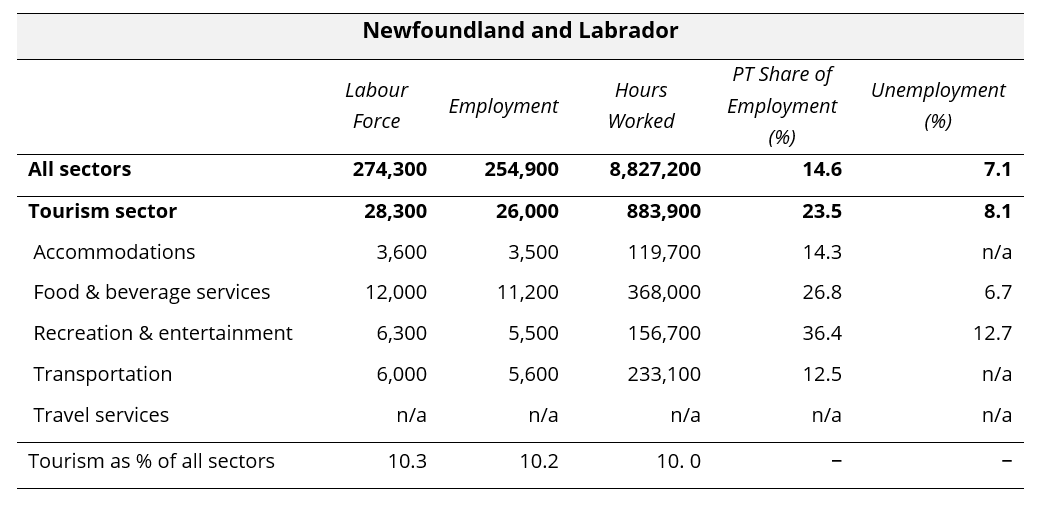
In June 2026, the national unemployment rate in tourism was below that of the overall Canadian economy, and this pattern also held true in all but two provinces. In Newfoundland and Labrador, tourism had an unemployment rate one percentage point higher than the economy-wide provincial average, while the gap was much smaller in Prince Edward Island. It is worth noting that these two provinces have particularly pronounced seasonal variation in tourism demand, and June may still be relatively early in their demand cycle.
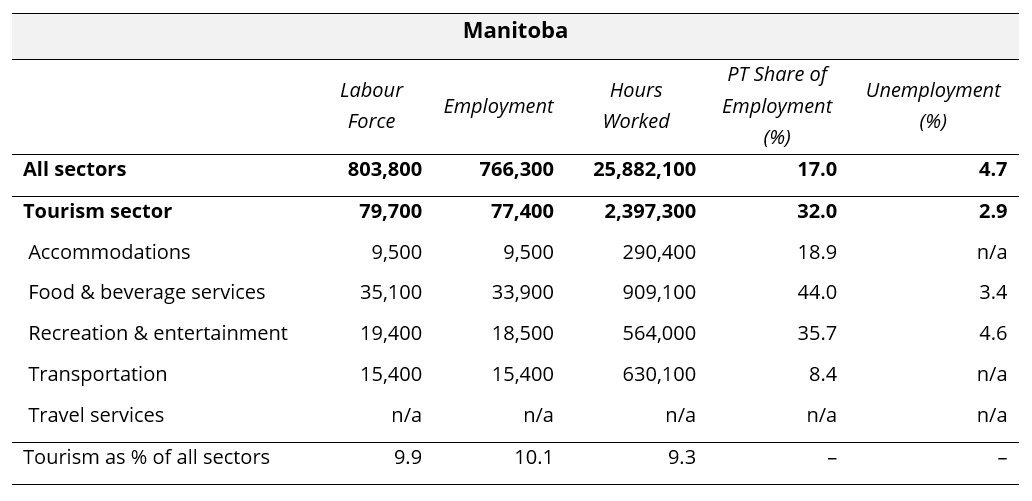
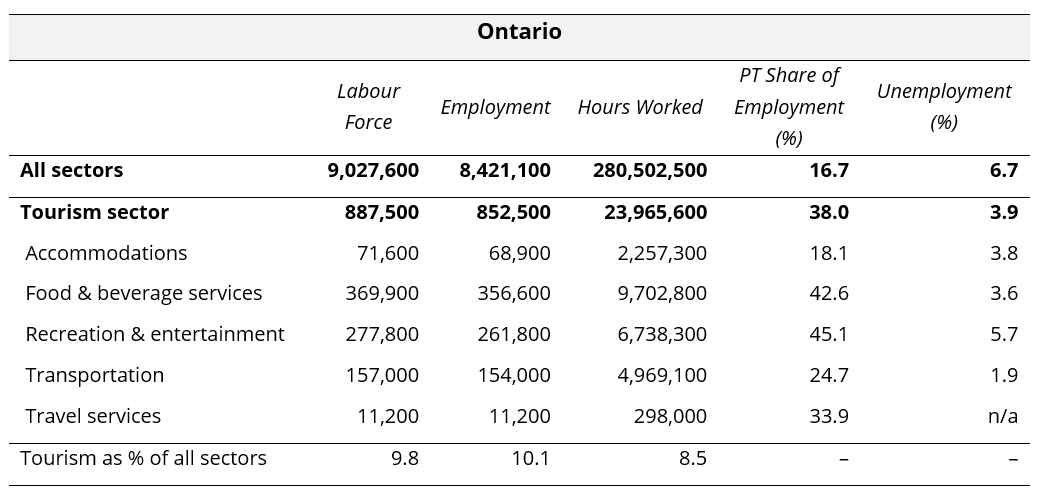
Tourism unemployment rates ranged from 2.9% in Manitoba and 3.9% in Ontario to 8.1% in Newfoundland and Labrador and 5.6% in Prince Edward Island. As summer demand continues to drive employment across tourism, it is likely that the provincial unemployment rates in tourism will continue to be broadly lower than those seen across the whole economy.
Provincial Summaries for June 2026
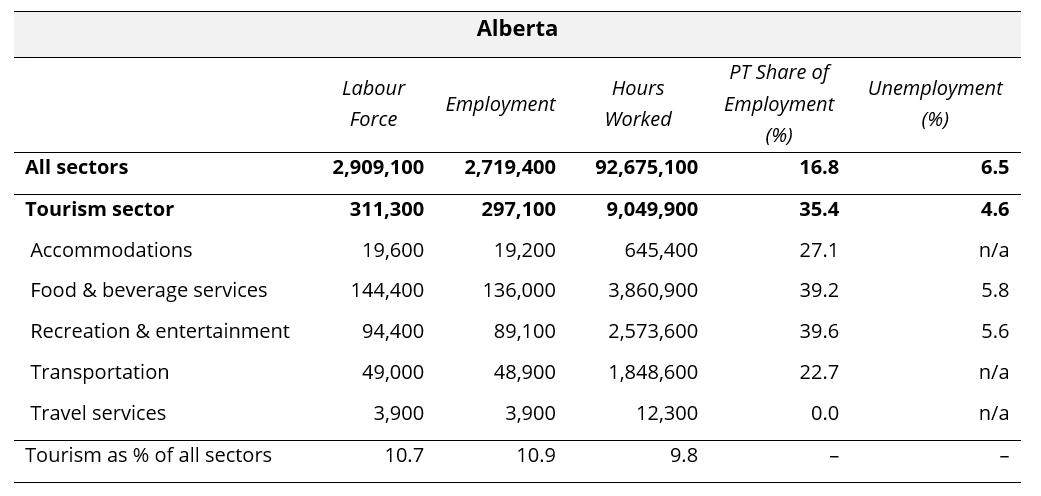
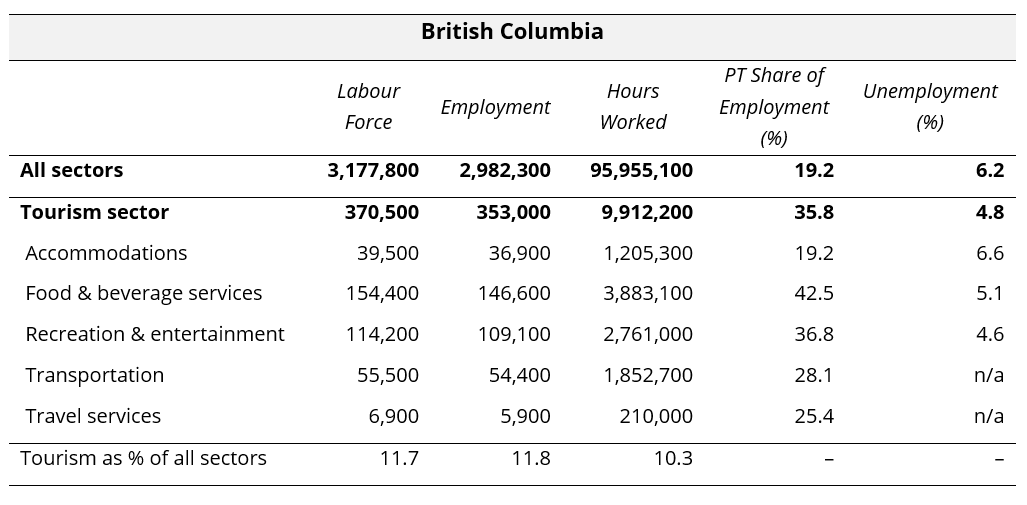
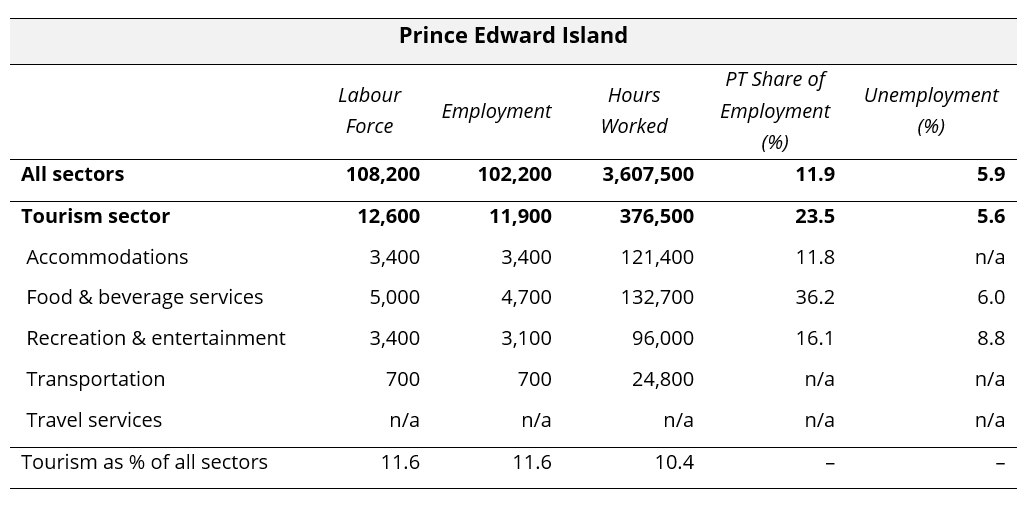
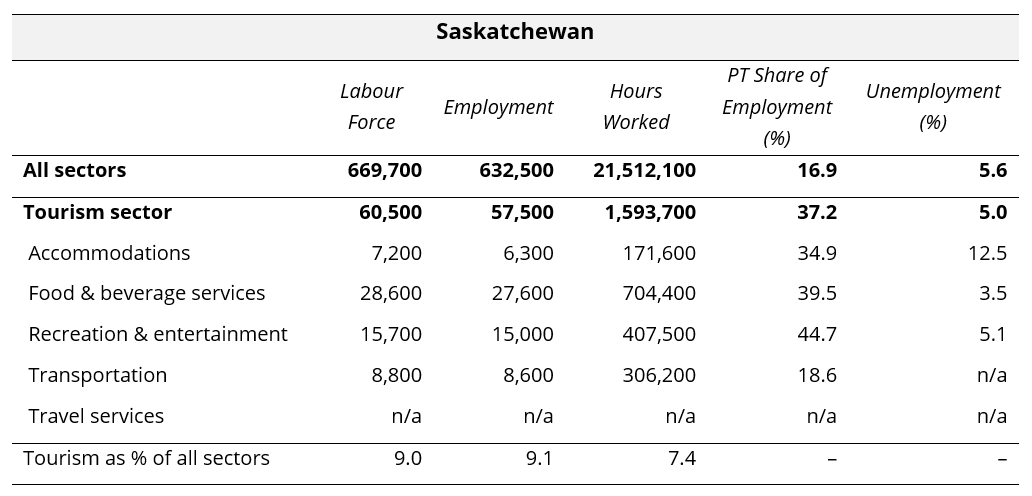
The following ten tables provide June 2026 summaries for the provinces, focusing on tourism and its five industry groups. Comparison data is provided for the larger provincial economy, as a benchmarking reference. Seasonally unadjusted estimates are provided for labour force, employment, and hours worked, and the final row of each table indicates tourism’s share of each of these metrics. The share of work that is part-time (as opposed to full-time) is also provided, as a rough indicator of the labour composition, as well as the unemployment rates.
Where data was not available due to suppression from Statistics Canada, “n/a” has been entered in the table. The three territories are not included in the LFS releases at this level of granularity, so no comparison is possible between the territories and the provinces. The provinces are listed alphabetically.



View more employment charts and analysis on our Tourism Employment Tracker.
[1] SOURCE: Statistics Canada, Leading indicator of international arrivals to Canada, June 2026.
[2] As defined by the Canadian Tourism Satellite Account. The NAICS industries included in the tourism sector those that would cease to exist or would operate at a significantly reduced level of activity as a direct result of an absence of tourism.
[3] SOURCE: Statistics Canada Labour Force Survey, customized tabulations. Based on seasonally unadjusted data collected for the period of June 14 to 20, 2026.