Tourism Contracts in Parallel with Broader Economy.
The tourism sector[1] in January 2026 contracted slightly from December[2], with both labour force (-0.5%) and employment (-1.6%) seeing decreases. However, these losses were broadly in line with patterns seen across the broader economy, where labour force fell by 0.8% and employment by 1.2%. This may be a regular seasonal contraction, or it may be an effect of the ongoing economic pressures facing the Canadian economy.
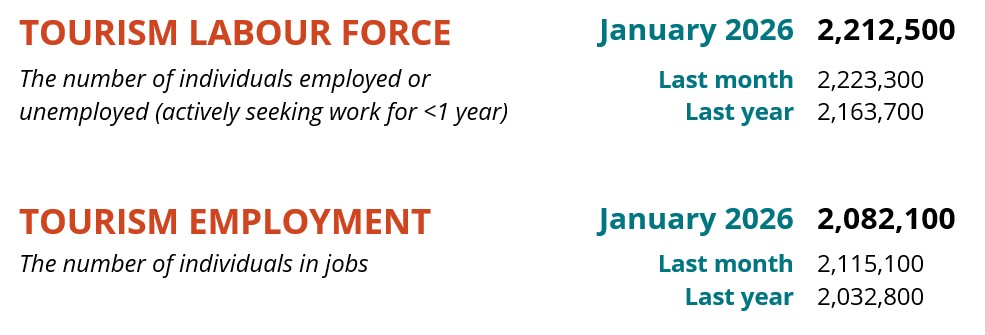
Table 1 provides a snapshot of each industry group’s performance across labour force, employment, and unemployment, as compared with December 2025 [MoM], January 2025 [YoY], and January 2019 as a pre-pandemic baseline. Small arrows represent changes of less than 1% (or one percentage point, in the case of unemployment).
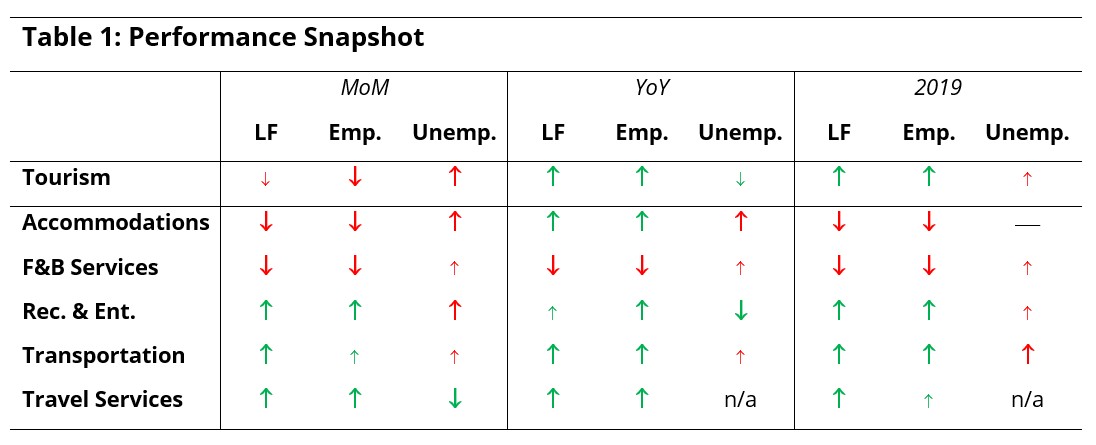
At the industry group level, there was some variability from last month, with accommodations and food and beverage services counteracting gains in recreation and entertainment, transportation, and—to a less dependable degree—travel services. Relative to last year, only food and beverage services saw a decrease, although both food and beverage services and accommodations remained below 2019 levels.
Tourism Sector
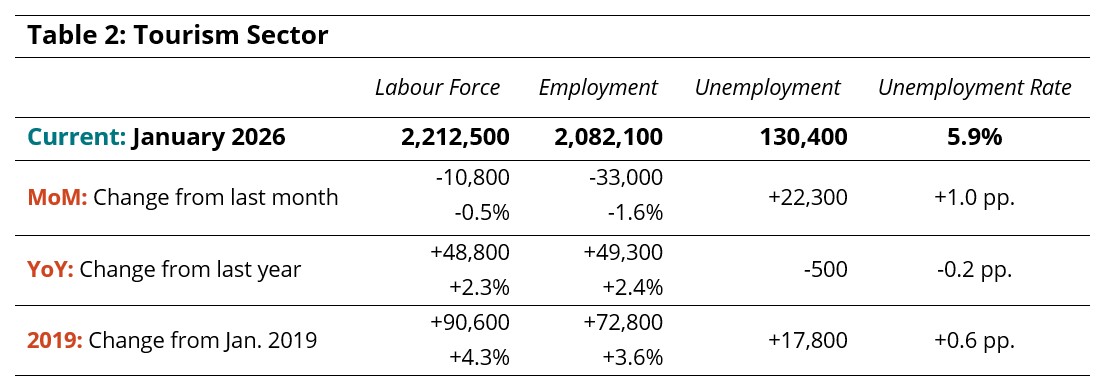
In January, tourism employment fell by 33,000 workers, three times the loss seen in labour force, which pulled the unemployment rate up by a full percentage point. Both indices were around 2% higher than last year and around 4% higher than in 2019. Table 2 provides a summary of the sector-level labour statistics.
Across all sectors of the Canadian economy, the unemployment level rose to 6.7% from December (calculated using seasonally unadjusted data), remaining higher than the national tourism unemployment rate of 5.9%. Economy-wide labour force and employment both fell month over month (Table 3).
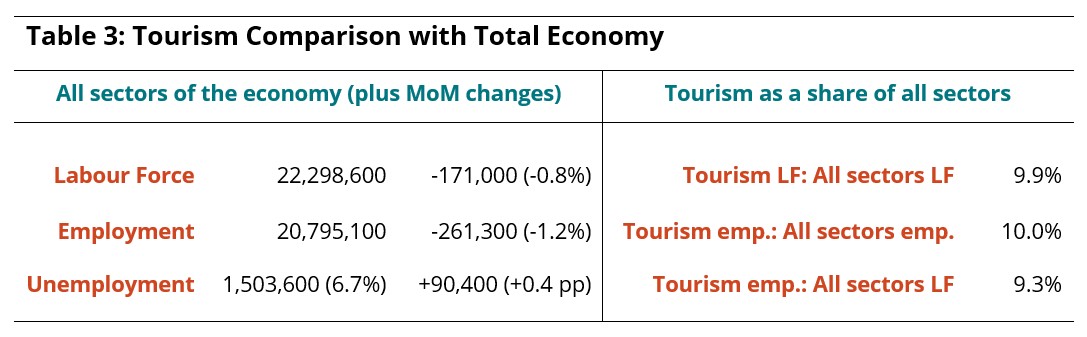
Tourism employment accounted for 10.0% of all employment in Canada, with 9.3% of the total Canadian labour force working in tourism.
Part-Time and Full-Time Employment
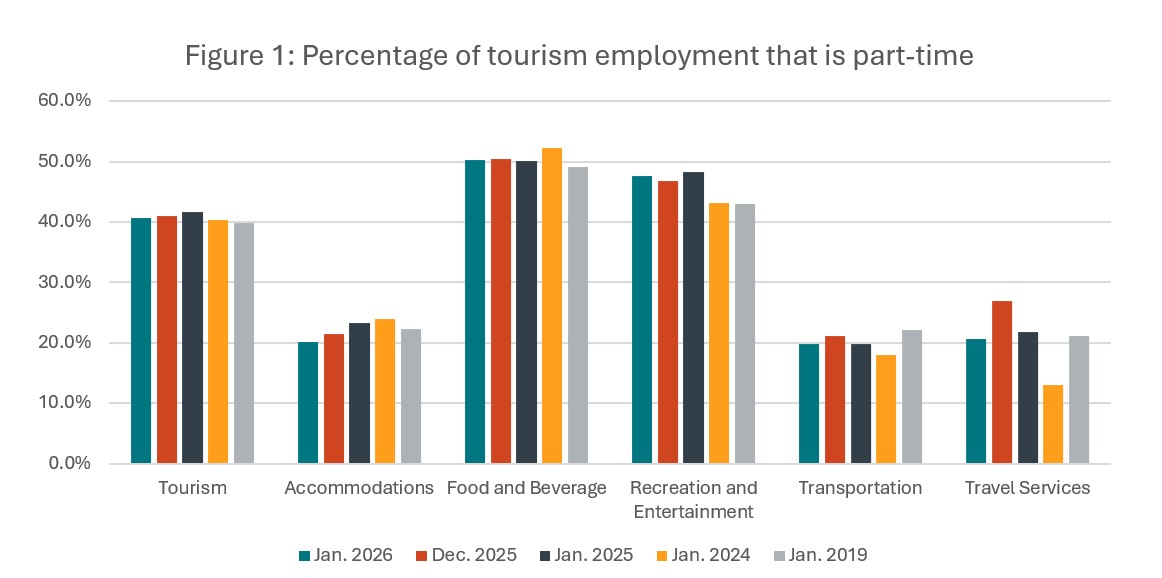
Part-time work[3] at the sector level contracted slightly from December (Figure 1), and although it has contracted slightly year-over-year since January 2025, these changes have been minimal. It has stayed relatively stable at around 41% part-time, slightly higher than in 2019. Part-time work in accommodations fell from December and year-over-year for the past few years, ending around 2 percentage points below where it was in 2019. In contrast, recreation and entertainment has seen a general increase in part-time work from pre-pandemic patterns (+4.5 pp), with little change over more recent time periods. Employment patterns held steady in food and beverage services, while transportation has seen more volatility but no consistent shift away from around 20%, although it was below 2019 levels. Travel services was likewise highly variable, which is likely an artifact of this industry’s small size in relation to the LFS sample.
Hours Worked
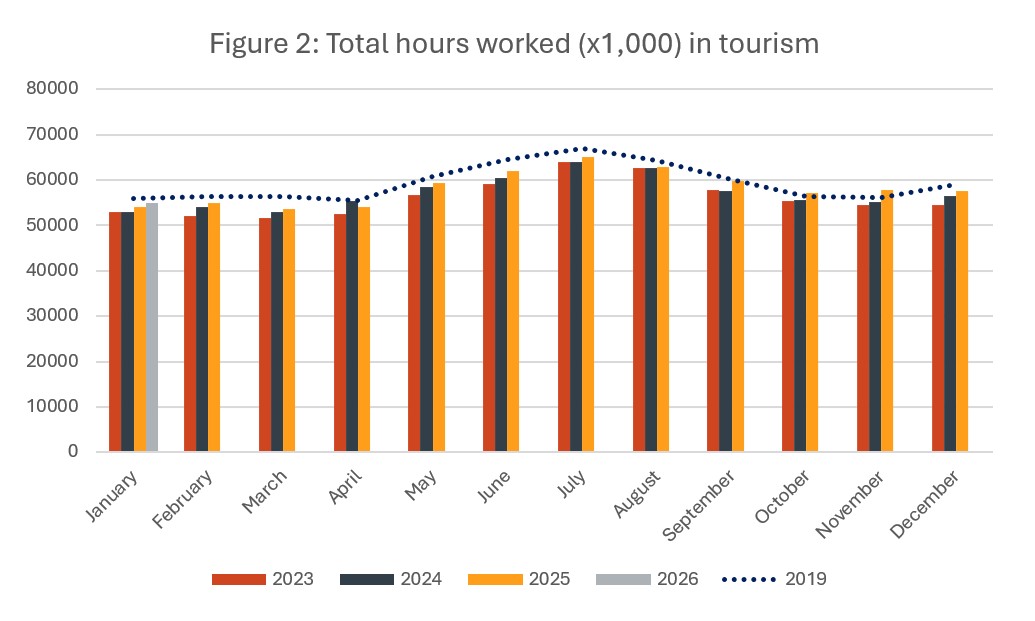
The hours worked in tourism provides a useful perspective on the stability of the workforce, as it provides more information on trends seen in employment numbers and the part-time work share. In January, total hours worked fell from December (-4.8%), but edged up from last year (Figure 2), which parallels the employment figures. Total hours worked remained below 2019 levels.
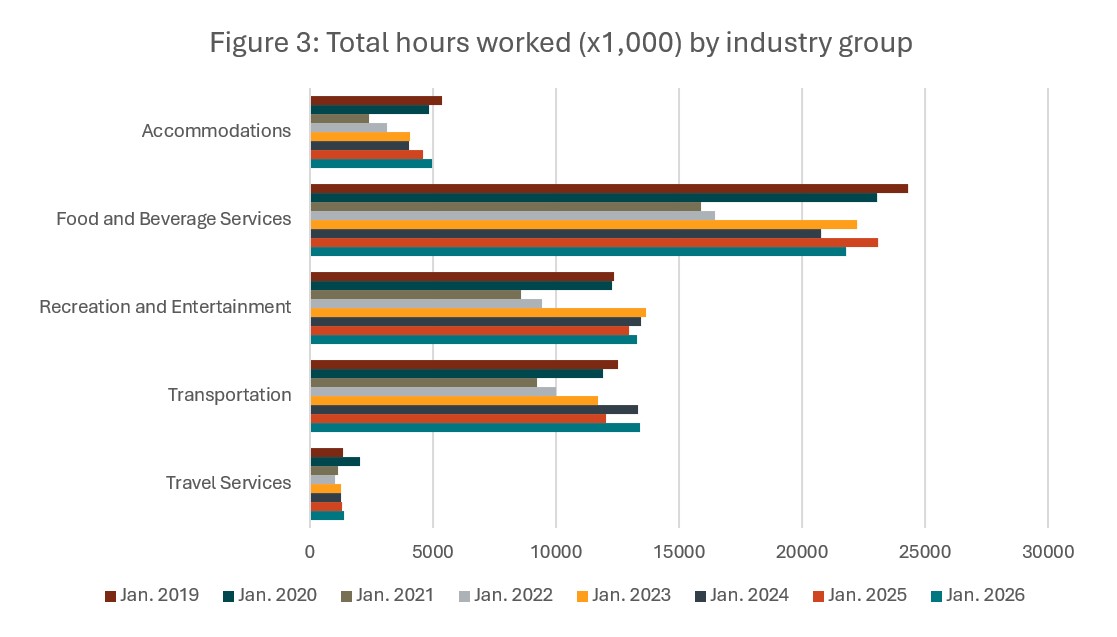
At the industry group level (Figure 3), accommodations and transportation both saw gains over last year, although the trends were different for these two industries: accommodations saw the continuation of a steady increase from the historic low observed in 2021, while the larger gain in transportation seems to be due to an abnormally low number in January 2025. Hours worked in recreation and entertainment in January have been falling slightly over the past few years, in line with the overall gradual increase in part-time work in this industry. There was more variability in hours worked in food and beverage services, which also reflects some of the difficulty this industry has had over the past few years, first in recovering from COVID-19 and later in addressing changing customer demand through recent economic uncertainties. Travel services has shown very slight increases year over year since 2022. In January 2026, recreation and entertainment, transportation, and travel services surpassed hours worked in January 2019, although as with all data relating to travel services, this should be taken cautiously.
Industry Closeup: Accommodations
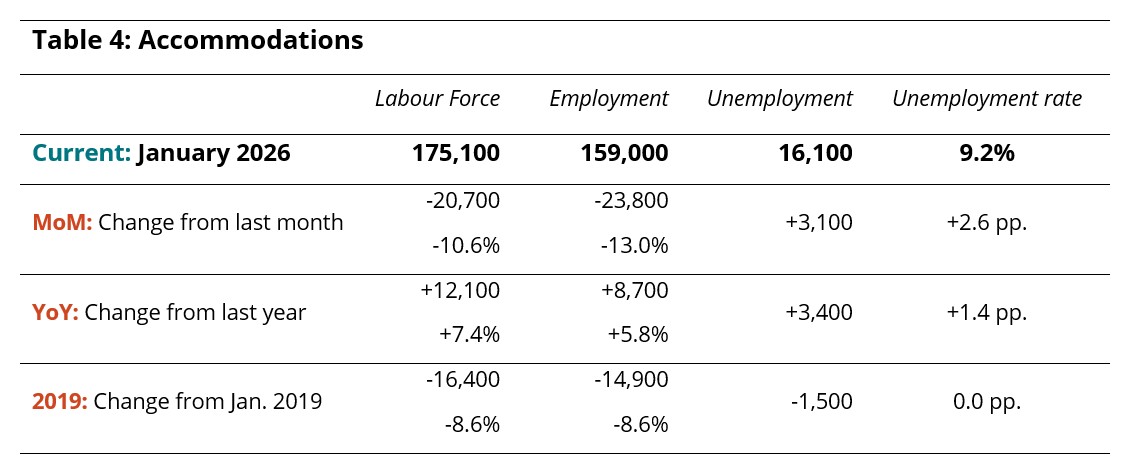
Accommodations ended 2025 on an upswing, ticking past 2019 levels for the first time, but January saw a substantial decrease (Table 4). Around 24,000 people left employment in the sector, a decrease of 13% on the last month, which pulled the unemployment rate up to 9.2%. The employment total of 159,000 marked an increase of nearly 6% on last year, although these levels remained around 9% below 2019 figures.
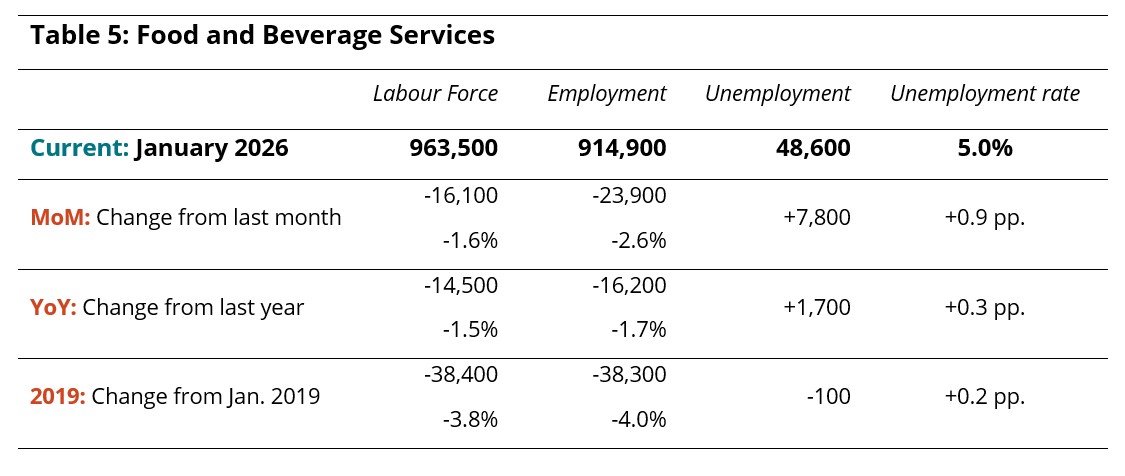
Industry Closeup: Food and Beverage Services
Food and beverage services continued December’s trend of decline (Table 5), with losses in employment surpassing those in labour force, adding nearly a full percentage point to the unemployment rate. The employment number of 915,000 marked a decrease on both last year (-2%) and pre-pandemic levels (-4%).
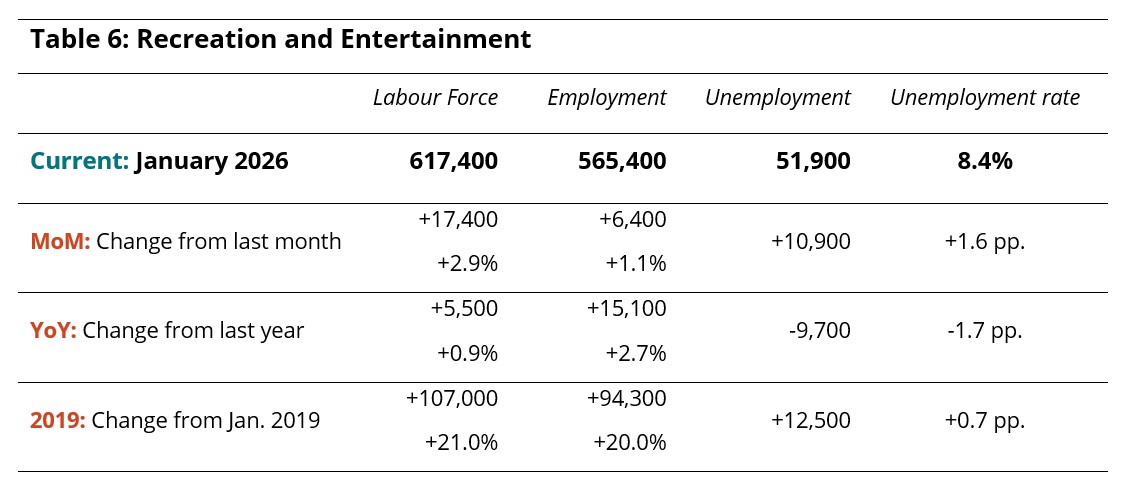
Industry Closeup: Recreation and Entertainment
Recreation and entertainment saw small gains in both labour force and employment from December (Table 6), continuing the general trend of sustained growth over the past year, bringing labour force to 617,000 and employment to 565,000. Unemployment edged up to 8.4% from December, but this remained lower than last year. This industry has grown substantially since 2019, with both labour force and employment increasing by around 20%.
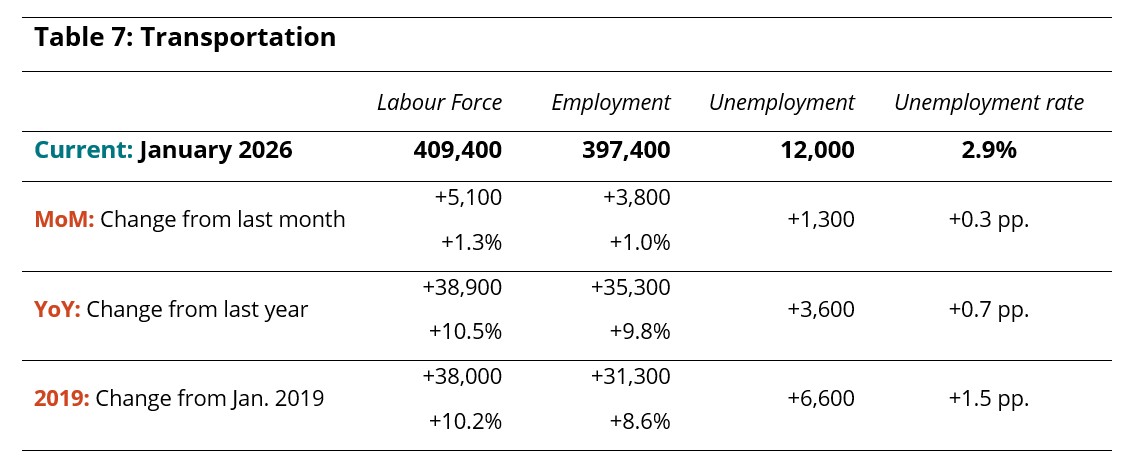
Industry Closeup: Transportation
Like recreation and entertainment, transportation has seen a more sustained trajectory of growth than other tourism industries since the pandemic, a trend which continued into January (Table 7). There were modest gains in labour force and employment from December (around 1%), and more substantial gains relative to last year and to 2019 (around 9% or 10%). Employment stood at nearly 400,000 in January.
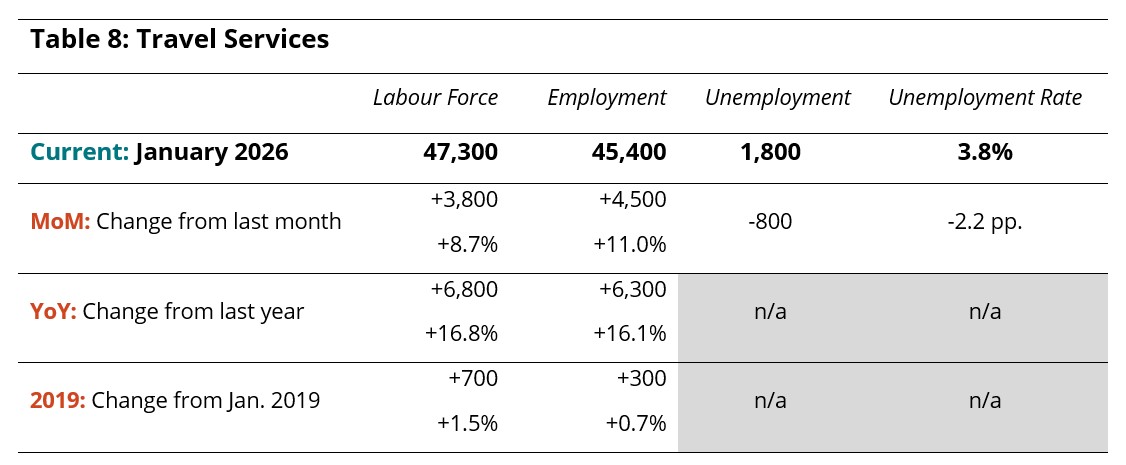
Industry Closeup: Travel Services
Data relating to the travel services industry group does not always present an accurate snapshot of the workforce at any given time, due to its relatively small share of the overall economy and the sampling used in the LFS. Data presented here should be taken cautiously and interpreted in relation to longer-term trends in the sector.
January LFS data reported a moderate increase in both labour force and employment from December (Table 8), and a slightly larger increase from last year. Travel services also edged past 2019 levels, although this should be viewed with some skepticism, as small real-world changes can become disproportionately magnified in the scaling-up necessary to produce these estimates.
Provincial Perspectives
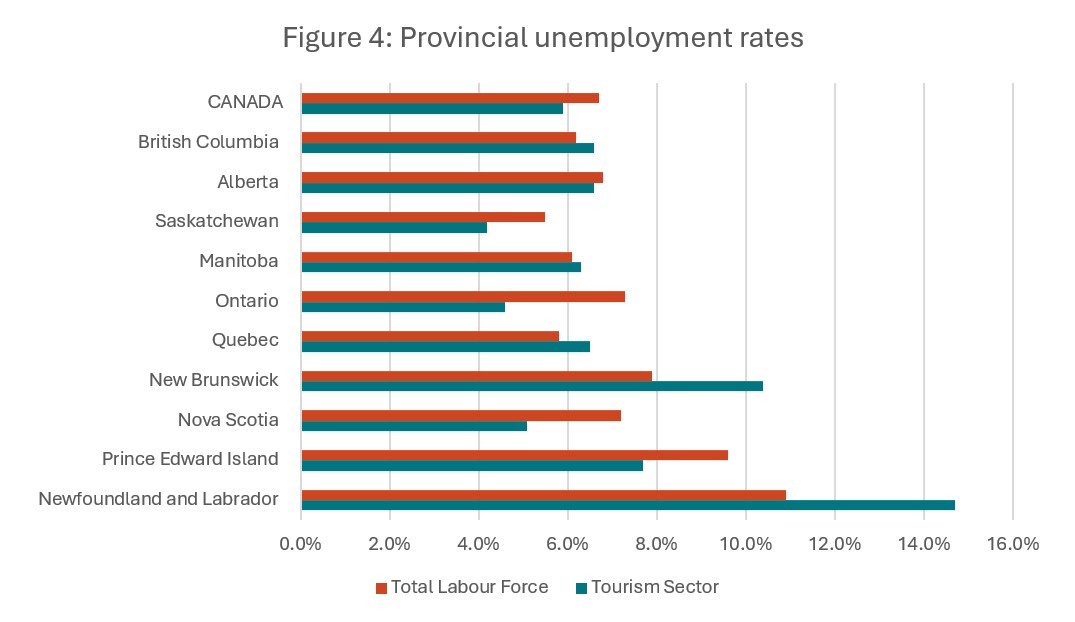
The Canadian economy is subject to some pronounced regional differences, and that is particularly true in the tourism sector. Figure 4 provides a comparison of provincial unemployment rates, for the tourism sector in particular and for the total labour force (i.e., comprising all industries), as a point of comparison.
The tourism unemployment rate surpassed that of the total labour force in British Columbia, Manitoba, Quebec, New Brunswick, and Newfoundland and Labrador, with the difference being most pronounced in the Atlantic provinces. Tourism unemployment rates were highest in Newfoundland and Labrador (14.7%) and New Brunswick (10.4%), and lowest in Saskatchewan (4.2%) and Ontario (4.6%).
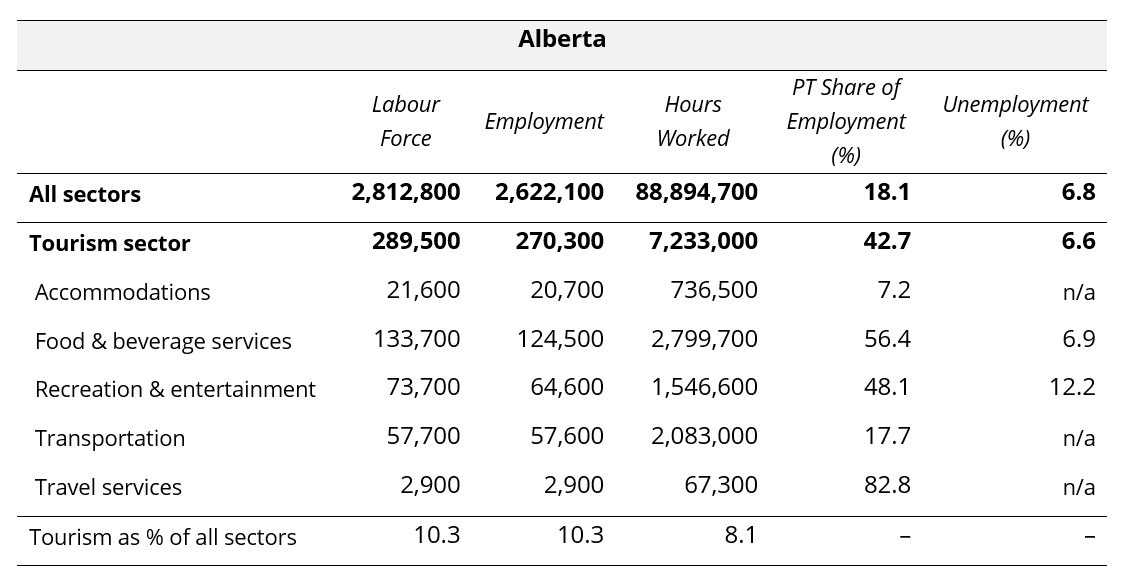
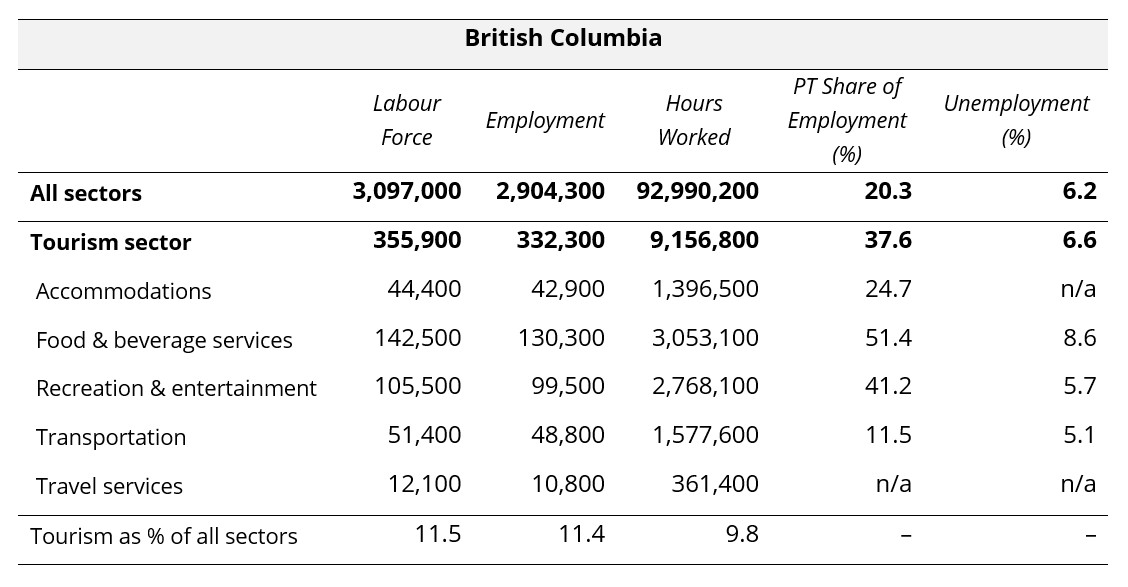
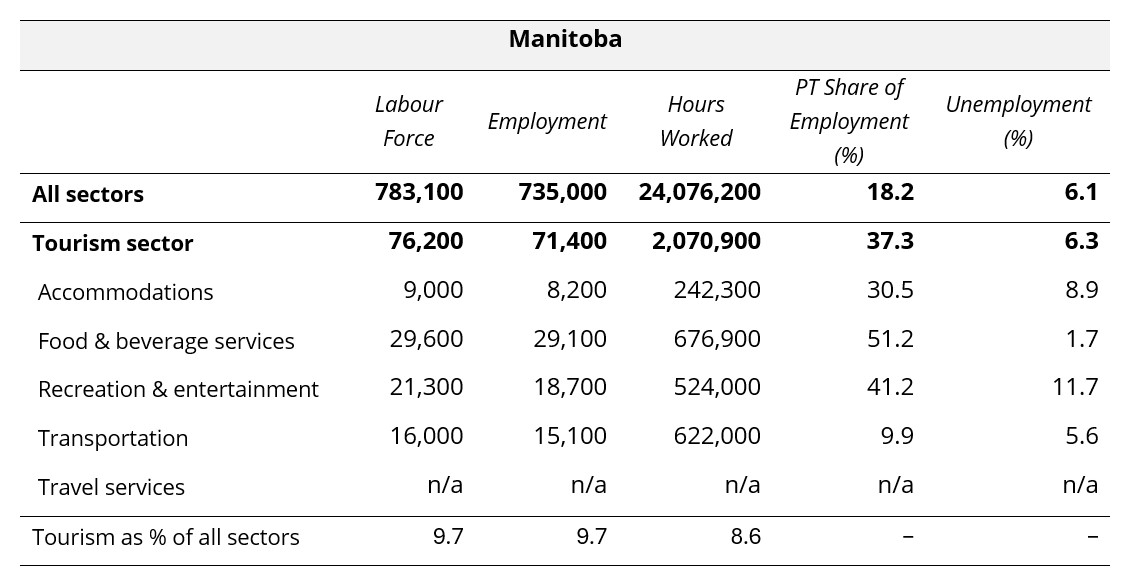
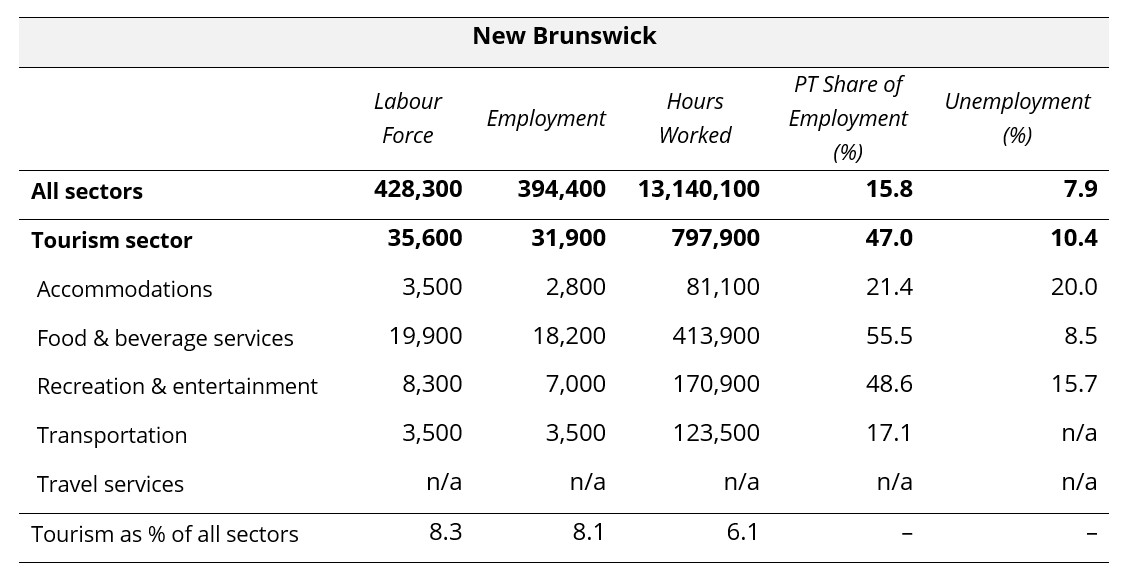
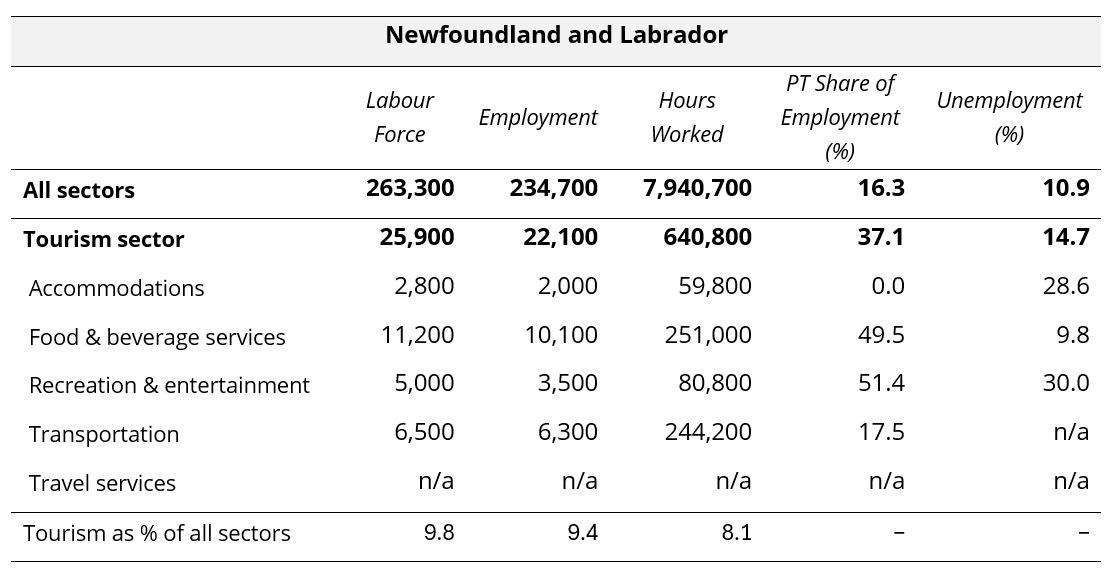
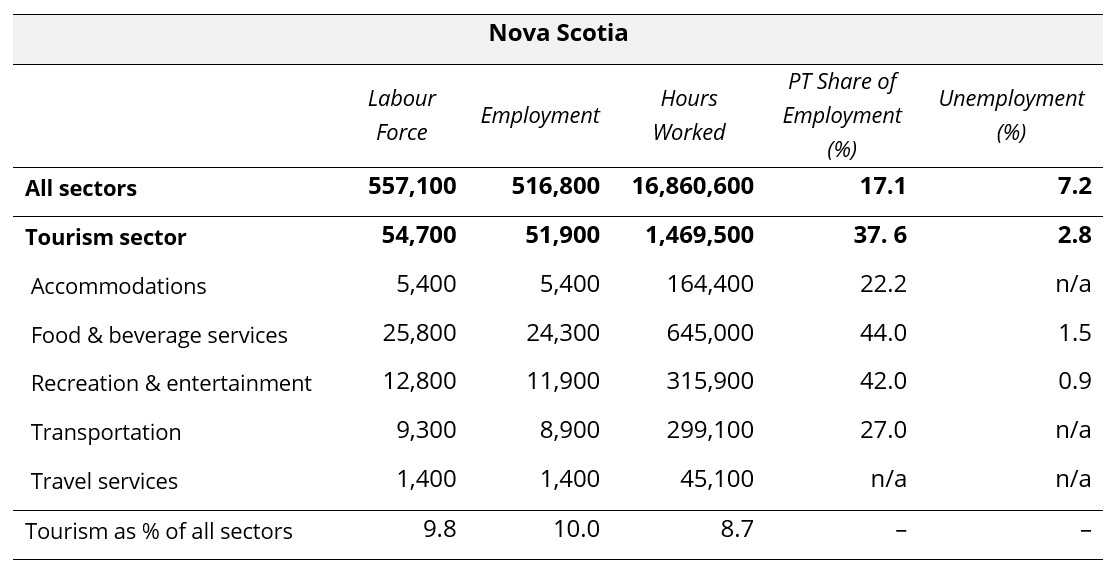
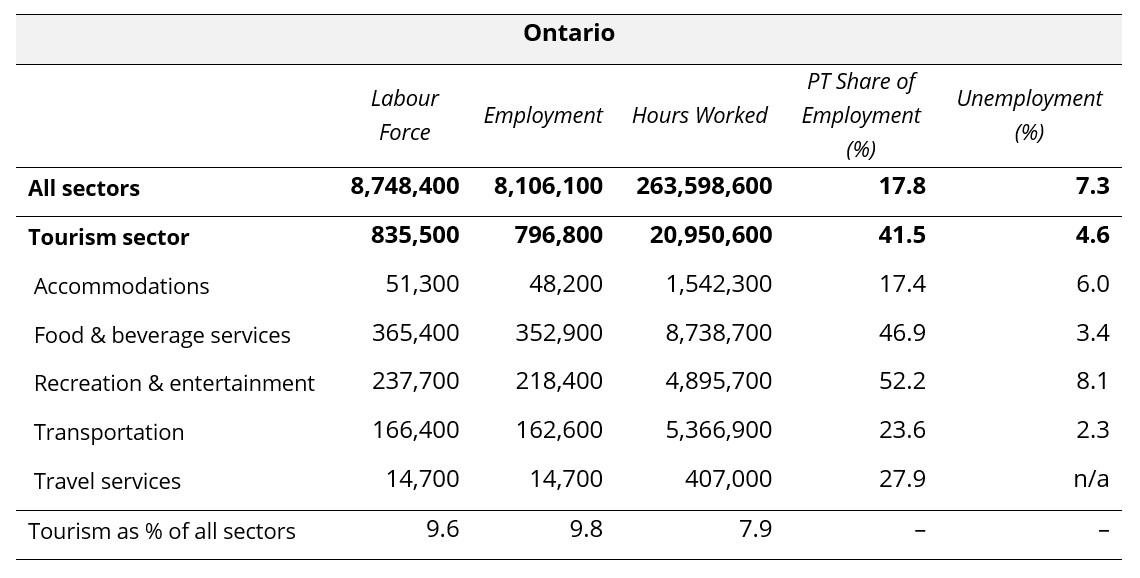
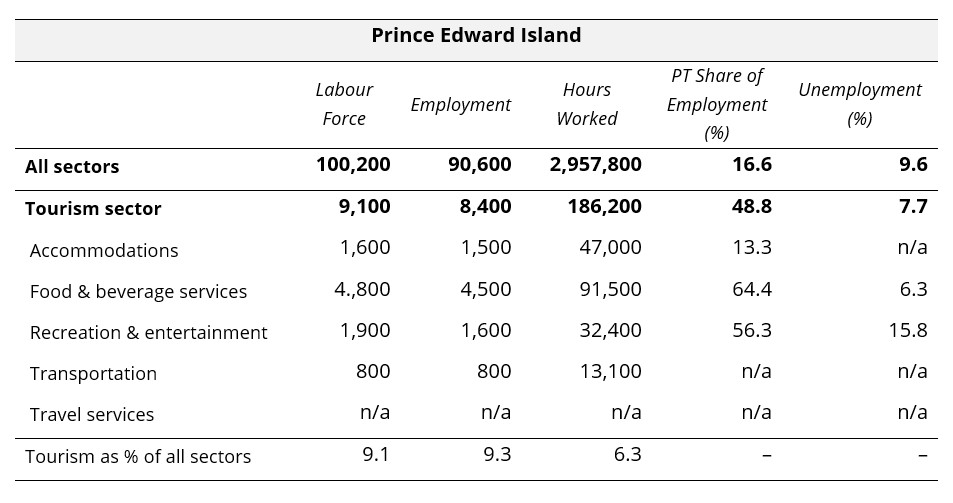
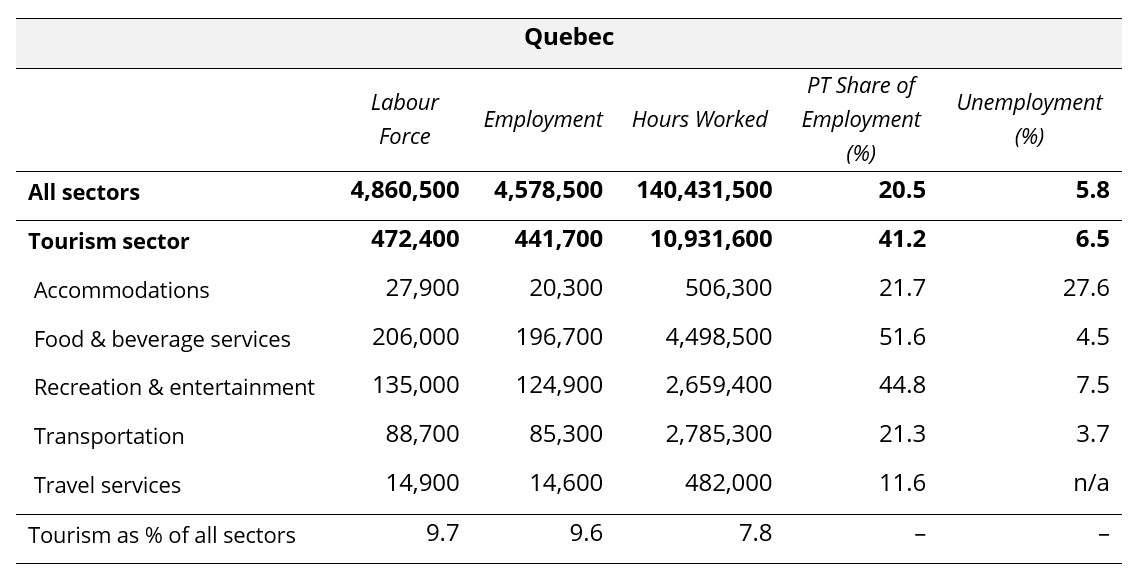
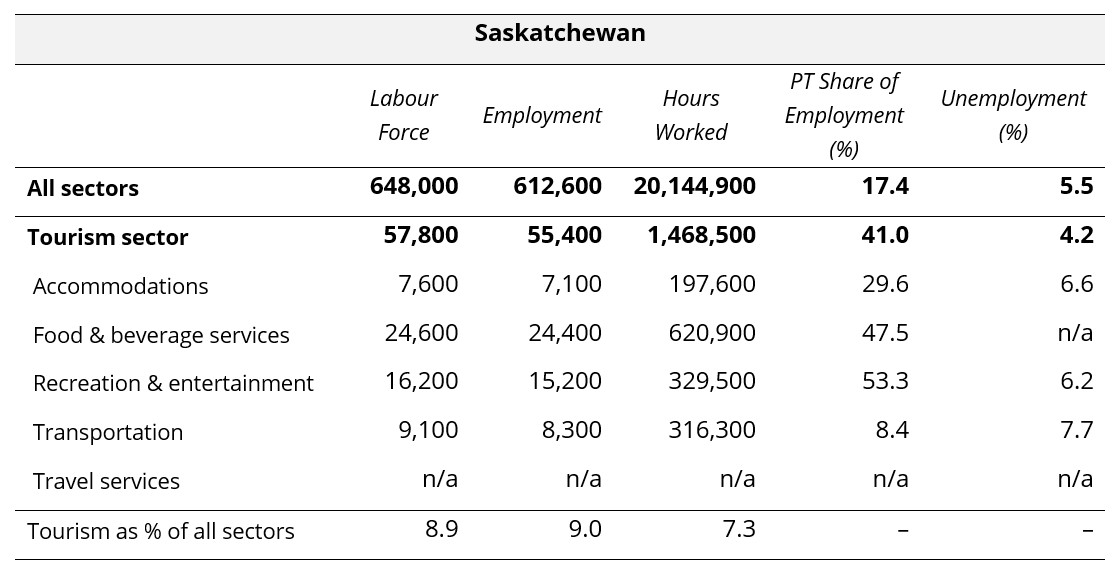
Provincial Summaries for January 2026
The following ten tables provide January 2026 summaries for the provinces, focusing on tourism and its five industry groups. Comparison data is provided for the larger provincial economy, as a benchmarking reference. Seasonally unadjusted estimates are provided for labour force, employment, and hours worked, and the final row of each table indicates tourism’s share of each of these metrics. The share of work that is part-time (as opposed to full-time) is also provided, as a rough indicator of the labour composition, as well as the unemployment rates.
Where data was not available due to suppression from Statistics Canada, “n/a” has been entered in the table. The three territories are not included in the LFS releases at this level of granularity, so no comparison is possible between the territories and the provinces. The provinces are listed alphabetically.
View more employment charts and analysis on our Tourism Employment Tracker.
[1] As defined by the Canadian Tourism Satellite Account. The NAICS industries included in the tourism sector those that would cease to exist or would operate at a significantly reduced level of activity as a direct result of an absence of tourism.
[2] SOURCE: Statistics Canada Labour Force Survey, customized tabulations. Based on seasonally unadjusted data collected for the period of January 11 to 17, 2026.
[3] Statistics Canada defines full-time work as 30 hours per week, and part-time work as less than 30 hours per week.