One of the challenges our tourism sector faces is inconsistency. With industry associations, DMOs, and economic development teams each focused on their specific needs—to say nothing of differences between municipal, regional, provincial/territorial, and national frames of reference—it’s very easy to get confused about the numbers that define tourism.
So how many people in Canada work in tourism? It seems like a fairly straightforward question—count them up, and there’s your answer. Right?
Well, it depends what you actually want to know. Are you seeking the number of people who hold jobs in tourism businesses? Or are you more interested in how many of those jobs exist because of tourists? Both are important data points, and both show up in public messaging and advocacy work in support of our sector, so it’s really important to make sure that the right number is used in the right context.
The two numbers we want to focus on are the National Tourism Indicators number and the Labour Force Survey number. Read on for the details.
National Tourism Indicators
The National Tourism Indicators (NTI) are a set of statistical measures developed within the National Economic Accounts, which is a system designed to capture macroeconomic data and generate estimates of the Canadian economy. With the National Economic Accounts, there are some sector-specific subsets, called Satellite Accounts, and tourism is one of the sectors that has a satellite account. While a full exploration is a bit more than what we need for our current purposes, it’s worth mentioning that the Tourism Satellite Account (TSA) is also the source of the definition of tourism: which industries should be included in labour and economic estimates of tourism, and which shouldn’t.
The NTI covers the domestic supply of tourism commodities—which refers to accommodations, food and beverage services, recreation and entertainment, transportation, and travel services—as well as demand for those commodities, both domestic and international. These overall numbers are determined through an economic analysis of the economy, and these are used to produce numbers relating to Gross Domestic Product (GDP) and employment in tourism.
It’s very important to note that the NTI—and all data points derived from it—are focused exclusively on the direct economic impacts of tourists (visitors), not tourism businesses (which can also serve the local community).
Statistics Canada attributes business revenue to tourists through a series of surveys (including the Travel Survey of Residents of Canada, the International Travel Survey, and the Survey of Employment, Payroll and Hours), coupled with the Labour Productivity Database.
The employment estimates generated from the NTI reflect “the number of jobs in an industry generated by, or attributable to, tourism spending on the goods and/or services produced by that industry”. When Statistics Canada reports this figure, they refer to Jobs generated by tourism, and it refers only to jobs that are directly supported by visitor (tourist) spending.
This estimate covers only a portion of the tourism workforce, but it gives an approximation of the economic impact of tourism in a local economy. In the absence of tourists, these jobs would not exist.
Labour Force Survey
The Labour Force Survey (LFS) is a monthly survey distributed to households across Canada, stratified to be representative of Canada’s population demographics and geographic distribution. Selected households participate for six months, which ensures a degree of short-term stability, and each month, one-sixth of the sample changes (which provides long-term representativeness). Each month, data relating to employment is collected from around 100,000 people, and population-level estimates are extrapolated from this sample.
In contrast to the NTI jobs estimate, the LFS estimate of employment includes everyone who works in a tourism industry, regardless of what their job is or whose spending (visitor or local) enables their employer to keep them on staff.
The LFS references the same set of industries as the NTI, but crucially it looks at overall employment levels in tourism, which Tourism HR Canada groups into the five industry groups that comprise the sector.
2025 in Two Numbers
So how do these two numbers compare? The diagram below gives you working estimates for 2025.
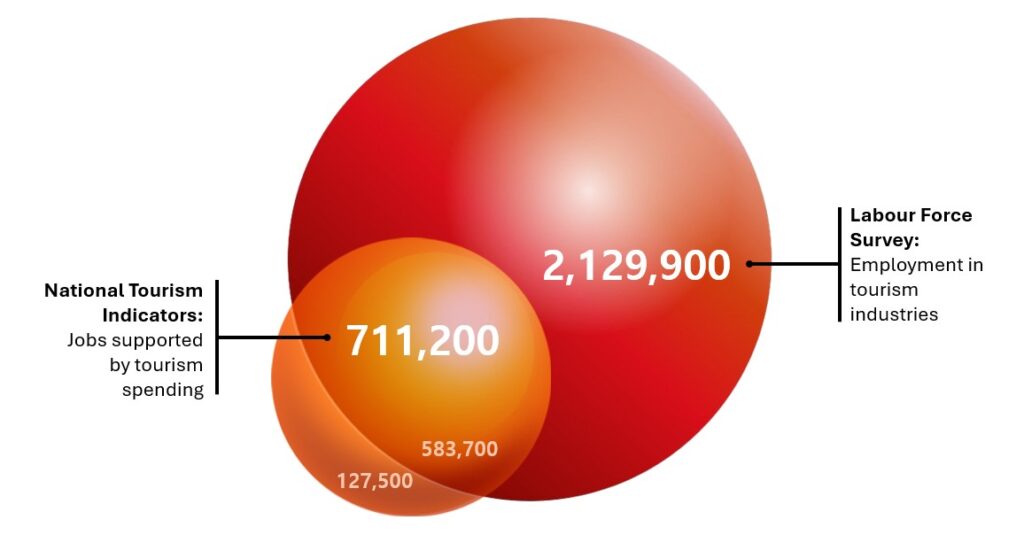
Under the National Tourism Indicators system of counting jobs, tourism generated around 711,200 jobs in Canada in 2025[1]. Of these, 583,700 were in tourism industries and 127,500 were in other industries (e.g., gas stations, drug stores—any places where tourists spend money while travelling that is not considered a tourism industry under the TSA definition).
Under the Labour Force Survey system, total tourism employment in Canada was around 2,129,900 in 2025[2]. By definition, all of these people were working in tourism industries.
Historically, the total NTI estimate has been around 1/3 of the LFS estimate. This ratio was stable for several years, then fluctuated at the peak of the COVID-19 disruptions, but has recently begun to re-stabilize at around 1/3 again.
So Which Number Is “Right”?
Well, they both are—but they answer different questions.
If you want to know about the money being brought into a community from outside, and the local economic impact of that external spending, you want to look at the NTI number. This is the number of people who would not be employed if tourism disappeared overnight.
If you want to know about the economic impact of tourism businesses operating in a community—that is to say, how much employment those businesses support in total, and the downstream effects of their wages circulating in the local economy—then you want to look at the LFS number.
Since both numbers have their place, depending on what you are trying to discuss, it’s important to be clear about which number you’re using when you put data into the public sphere. Having two contradictory numbers in circulation, without any context or explanation, can confuse discourse and get in the way of efforts to help address labour needs across the sector.
[1] At the time of publication, Q4 data for 2025 was not yet available, so this figure is an average of Q1-Q3, rather than an average of Q1-Q4.
[2] This figure comes from the 2025 Annual LFS.