Unemployment is a headline-grabber in the current Canadian news cycle: with geopolitical instability and economic unpredictability, many businesses are facing strong headwinds, and the threat of being laid off hangs over much of the Canadian workforce.
Tourism may be slightly removed from these immediate and direct concerns—Canadians expressed a strong interest in travelling domestically this summer, which bodes well for tourism operators and should keep employment levels fairly stable—but the decision to travel at all rests upon disposable income, so if there are mass layoffs as a result of trade tensions with the USA, tourism businesses may suffer as visitor demand dries up, affecting tourism employment levels.
Tourism HR Canada regularly reports on unemployment rates in the tourism sector as part of our monthly labour force survey analysis. Eagle-eyed regular readers may have noted that the economy-wide unemployment rates that we report in these monthly analyses are not always the same as those reported more widely. This doesn’t mean that we’ve been getting it wrong all along, but rather that unemployment is a trickier concept than it might first appear, and there are different ways of reporting on it. This article unpacks some of that complexity, and then takes a closer look at youth employment and unemployment, which is sometimes seen as a canary in the coalmine of economic conditions.
What Is Unemployment?
Canada collects and shares a wealth of information about the population, including conducting dozens of regular surveys that look at all aspects of employment, economic, and demographic matters. Together, these provide a rich data environment for monitoring and modelling the state of the country at any given moment. Each of these surveys and sampling exercises have their own schedules: some are monthly, some are quarterly, some are annual, and some—like the census—occur only every five years.
One of the most robust labour surveys conducted by Statistics Canada is the Labour Force Survey (LFS), which reports on labour force, employment, and unemployment across the Canadian population, scaled up from a representative sample of around 100,000 people. Because of the sample size, the estimates that are produced are not necessarily a perfect reflection of the real experiences of Canadians at any given moment, but they provide a reliable approximation, and the real strength of the LFS is its ability to show trends over time[1]. So while it’s not a perfect tool, it is a very useful one for those monitoring labour conditions across the country and across the economy. The LFS is the source of official unemployment figures.
The intuitive meaning of unemployment is “people who aren’t working”. It is generally reported as a percentage, which means that it’s calculated by dividing one number by another number, where the number on top of the fraction (the numerator) represents a subset of the number on the bottom (the denominator). Technically, this is the unemployment rate (UR), although it is often not reported this way: you will more likely hear newsreaders say something like, “Unemployment reached 7% last month”, rather than the more accurate, “The unemployment rate reached 7% last month”. This is a subtle distinction, but one worth bearing in mind because the two numbers that feed into this calculation might not be what you think they are.

In order to be classified as an unemployed person in the LFS, someone must be at least 15 years old and actively looking for work. This excludes people who are choosing not to work, who fall broadly into three groups:
- People who are not interested in looking for work (for example, stay-at-home parents, retirees, some full-time students)
- People who are not able to work (due to illness or disability, for example)
- People who have been looking for work but have become discouraged
This last category, discouraged job-seekers, is the most nebulous, because exactly when someone goes from being an active job-seeker (and therefore unemployed) to a discouraged one (and therefore no longer active in the labour force) is not clearly defined, and may vary between regions, industries, or sectors.
The denominator in this equation, the number of people in the labour force, is the sum of everyone aged 15 or older who is employed (working) and everyone aged 15 or older who is unemployed. It therefore also excludes the three groups of people listed above, as well as a few groups of people (Indigenous persons living on reserves, institutionalized people—whether in long-term care, hospitals, or prisons—and full-time members of the Canadian Forces). In all, there is a sizable proportion of the Canadian population who is not part of the labour force. The labour force participation rate is the share of the Canadian population that is either employed or unemployed; in August 2025, this rate stood at 66.1%. The employment rate—the share of the Canadian population that was working—was 60.9%. This means that even though the official unemployment rate in August was 8.0%, in fact around 39% of the Canadian population was not working.
Of course, from an employment perspective, we primarily want to know about the people who were looking for work, and whether they were successful in finding or retaining a job, so this definition makes sense. But it is important, when considering unemployment in the context of the overall economy, to know exactly what the term “unemployment” refers to.
Seasonality
So where does the discrepancy mentioned above come from? Well, all labour data can either be seasonally adjusted, or left unadjusted. The intention behind seasonal adjustment is to take account of normal, cyclical changes in employment over the course of year, so that the impacts of external factors can be more clearly observed.
But because tourism is such a seasonally contingent sector, Tourism HR Canada always reports data that is seasonally unadjusted. We want to monitor the actual number of people in employment in any given month, regardless of whether any change from the previous month is due to sector-specific factors or because of larger social or economic pressures. And since we report tourism statistics without seasonal adjustment, we also report economy-wide statistics without seasonal adjustment, because otherwise any comparison between tourism and the rest of the economy would be misleading.
In contrast, the unemployment rate that is reported in the news is almost always seasonally adjusted. It has been corrected to smooth out the expected peaks and troughs across the year, because in that context, unemployment rate is an indicator of the overall health of the economy rather than an actual metric about the employment circumstances of individual people. It is not the case that either number is more correct than the other, but rather that they are both correct answers to different questions.
Tourism Unemployment
Tourism unemployment rates, as reported by Tourism HR Canada, draw on the Statistics Canada definition of the tourism sector, which is defined economically at the industry level. Industries in Canada are coded according to the North American Industry Classification System (NAICS[2]), and the definition of tourism rolls up various NAICS codes into five industry groups: accommodations, food and beverage services, recreation and entertainment, transportation, and travel services. We use these industry groups when reporting on tourism statistics, because these groups aggregate the data in a way that makes sense for our sector.
Estimating tourism employment is easy enough to do: for every person who is employed, their job is categorized by industry. It is slightly trickier when classifying unemployment: how do you categorize something that doesn’t currently exist? In the LFS, this is resolved by asking about where an unemployed person last worked, provided they worked in the past 12 months. Someone who is currently unemployed and is looking for work, whose last job was in a restaurant, would be classed in the LFS data as an unemployed person in food and beverage services, even if they were looking for work in a different sector.
In our monthly LFS reports, unemployment rates in tourism (and in any of the five industry groups) are calculated in the same way that they are for the economy as a whole, but both the numerator and the denominator are restricted to the sector (or industry) in question:


…and so on, across the five industry groups. This allows us to report on the labour conditions of the overall tourism sector in relation to that of the broader economy[3], and also to explore the relative conditions of the different tourism industries. Between employment numbers and the unemployment rate, we can get a reasonable sense of the employment landscape.
So how does tourism compare to the larger overall Canadian economy?
Employment and Unemployment Rates
Figure 1 provides annual LFS estimates for raw employment numbers (bars, read against the left axis) and for unemployment rates (dotted lines, read against the right axis), for tourism (in blue) and for the entire economy (in orange).
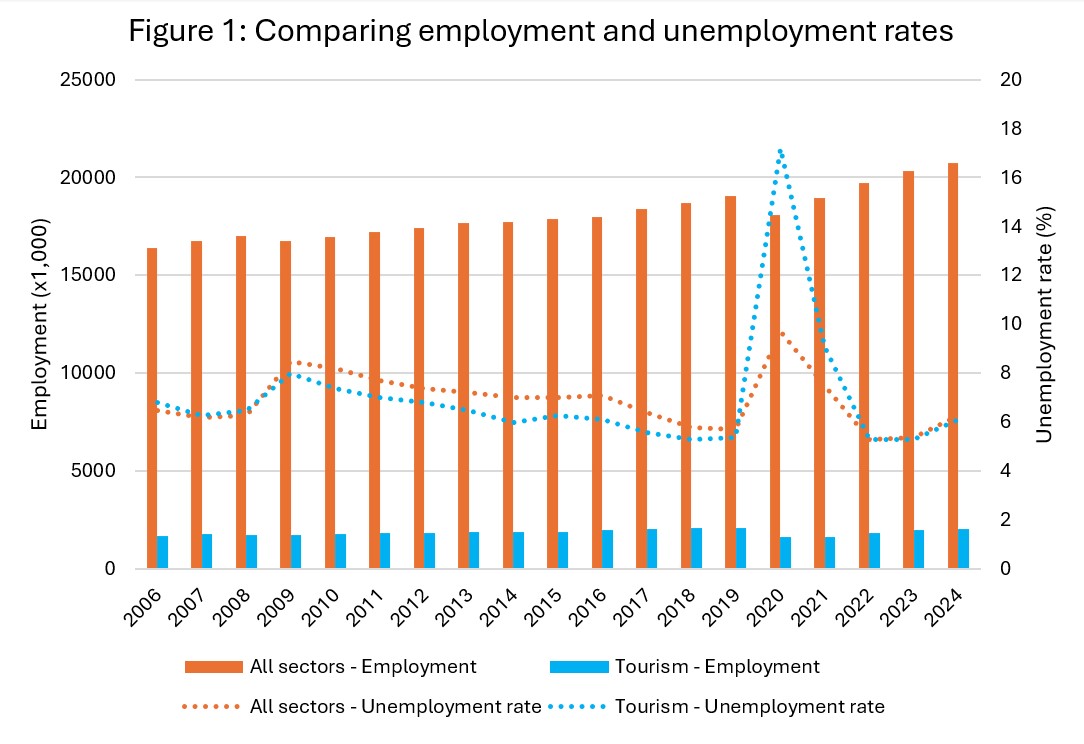
There are a couple of points worth noting here. First, in the decade before the pandemic, unemployment rates in tourism were consistently around one percentage point lower than they were across the broader economy. The pandemic disrupted this pattern, with tourism businesses being hit disproportionately hard, so the spike in 2020 is not unexpected. In the years since the worst of the disruption, unemployment rates in tourism have been about the same as those in the broader economy.
The second thing to note is the relative size of raw employment numbers for tourism versus the whole economy. Up until the pandemic, tourism employment consistently accounted for around 10% of all employment in Canada, closer to 11% from 2016 to 2019. It dipped below 9% at the height of the pandemic, and has returned to 10% in the past two years. Taken together, these employment measures indicate that employment has been growing less quickly in tourism than it has been across the economy as a whole.
Youth in Tourism
There are a number of existential threats facing the Canadian economy at the moment, ranging from climate change to AI adoption to global trade uncertainties, and many of these will have the most direct impact on young workers. As we saw during the pandemic, businesses facing a fall in demand may be more likely to scale back on frontline workers than they are on more senior employees, which will disproportionately affect younger workers. Youth unemployment rates are quite commonly discussed in current affairs: the lifelong impacts of disrupted employment for young people can be far-reaching[4], so the labour conditions facing youth are an important metric for understanding the overall health of the economy.
Figures 2a and 2b decompose the data from Figure 1 into two age groups, those aged 15 to 24 (young workers) and everyone aged 25 and older. As before, employment is represented by solid bars and unemployment by dotted lines, and tourism is blue while the overall economy is orange.
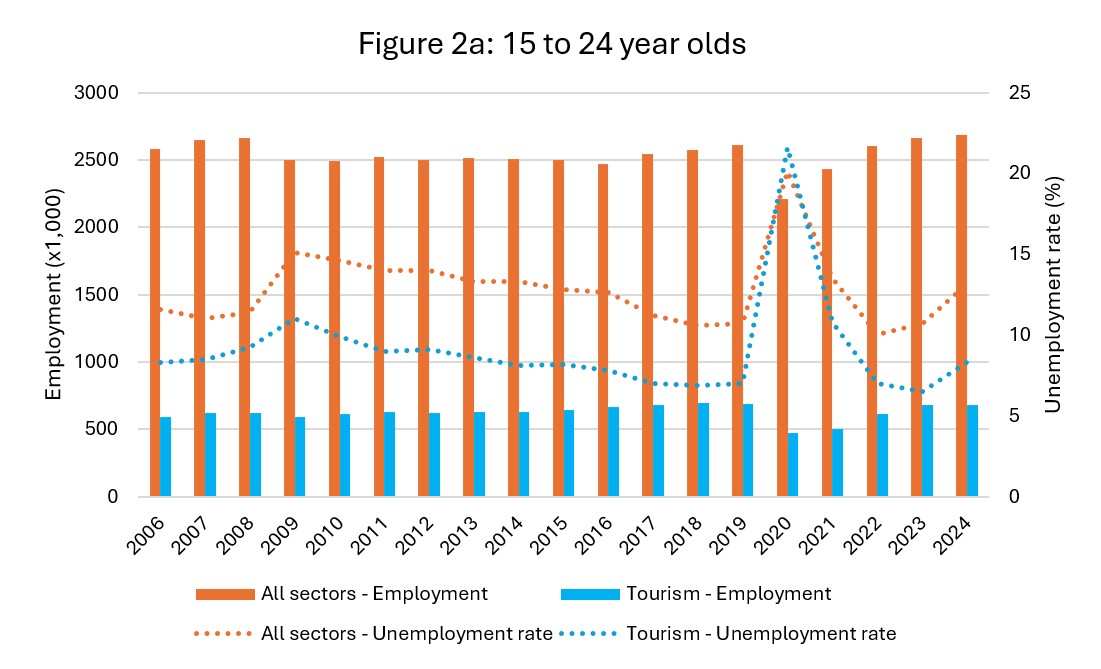
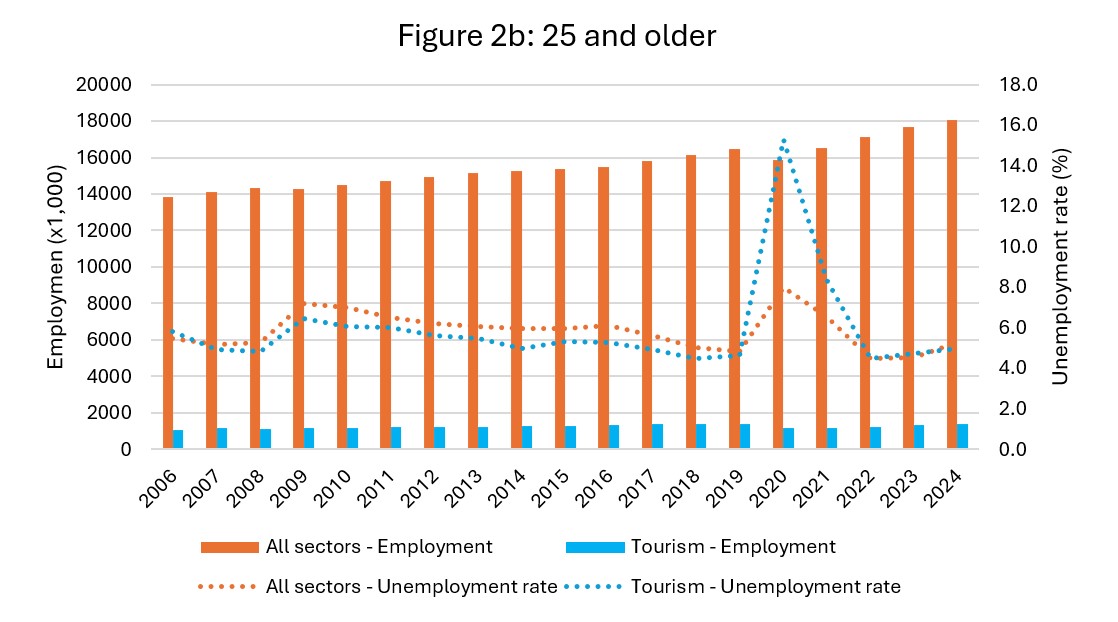
The first clear pattern to emerge from this age comparison is that youth employment in tourism is much higher (proportionately) than it is for the other age group, with around 25% of all young workers in Canada employed in a tourism business, compared with between 6% and 10% for older workers (Figure 3). The second thing to note in Figures 2a and 2b is that the unemployment rate for youth in tourism has long been substantially lower than it has been across the economy as a whole, by around 4 or 5 percentage points for the most part. The 2020 peak disruption saw the tourism unemployment rate climb slightly higher than that of the broader economy, but by 2021 the gap had begun to widen again, and in 2024 it was back to historical norms. Across the other age groups, the average unemployment rate in tourism was generally lower than that across the whole economy in the 10 years leading up to the pandemic, although the gap was much smaller.
The difference between the rapid return to expected unemployment rates for youth and the much slower regrowth of employment numbers is because of how unemployment is calculated: with many young people staying out of the labour force for an extended period of time following the pandemic, both the numerator and denominator were suppressed. The lowest tourism unemployment rate was in 2023 (6.5%), after which it returned a more typical rate (8.3%) in 2024 as more young people (re-)entered the workforce.
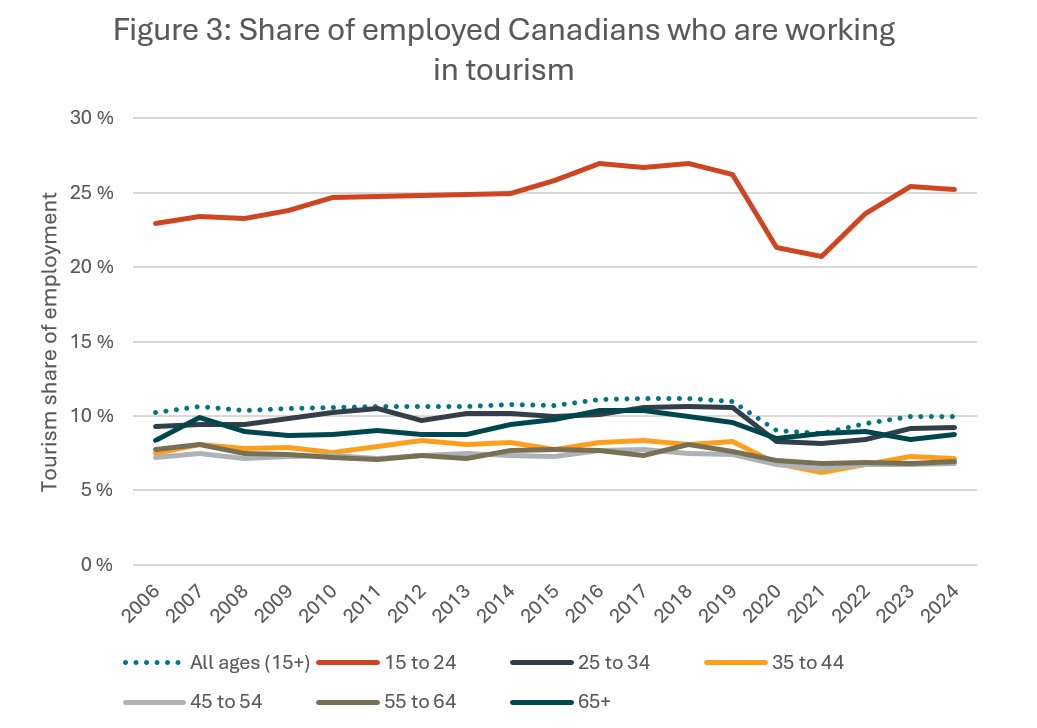
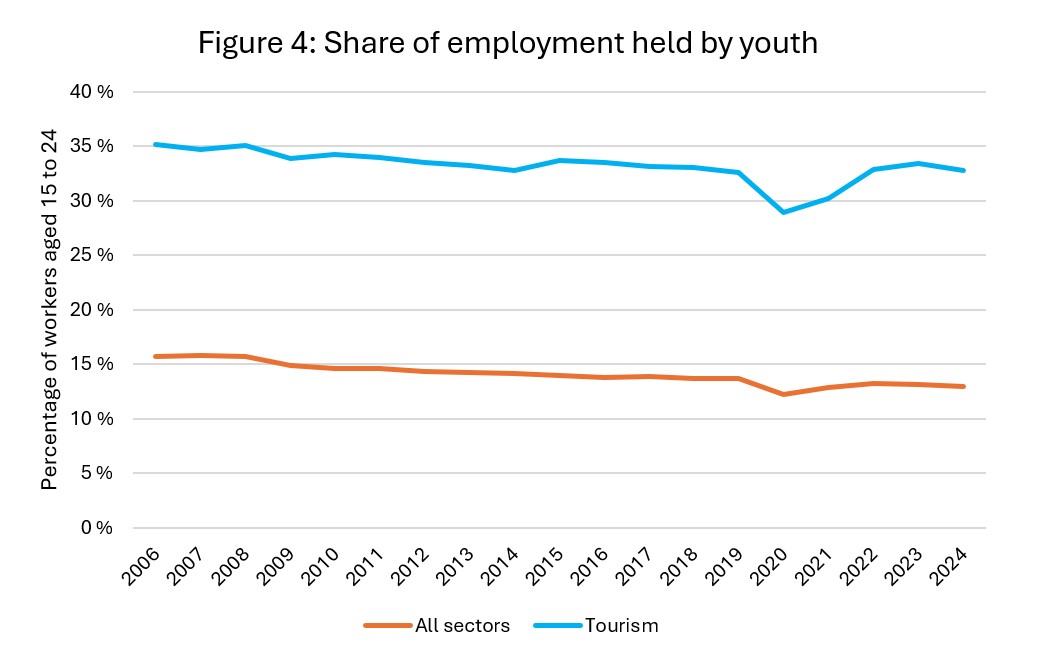
As touched on briefly above, young people find a lot of work in tourism. This is partly an effect of the kind of entry-level work that is available in the sector, and also partly an effect of the scheduling flexibility and seasonality associated with peak periods of employment for tourism businesses. Evening and weekend shifts make tourism businesses obvious places for part-time employment while in school, and the alignment of school and business cycles means that those looking for full-time work become available at the same time that businesses are expanding their workforces ahead of summer. Indeed, youth make up around a third of the total tourism workforce (Figure 4, blue line), while across all sectors, youth make up only around 14% of the workforce (orange line).
Tourism jobs offer young Canadians work opportunities that are flexible, dependable, and diverse, and provide opportunities to develop key employability skills that they will take with them throughout their careers, whether they stay in tourism or transition to a different career path. Of course, we would like them to stay working in tourism for the long haul, but that’s not realistic and would create all sorts of other problems down the road—but our sector can certainly do better to retain some of the youth who pass through our businesses.
So who are all these young people working in tourism?
Gender of Young Workers
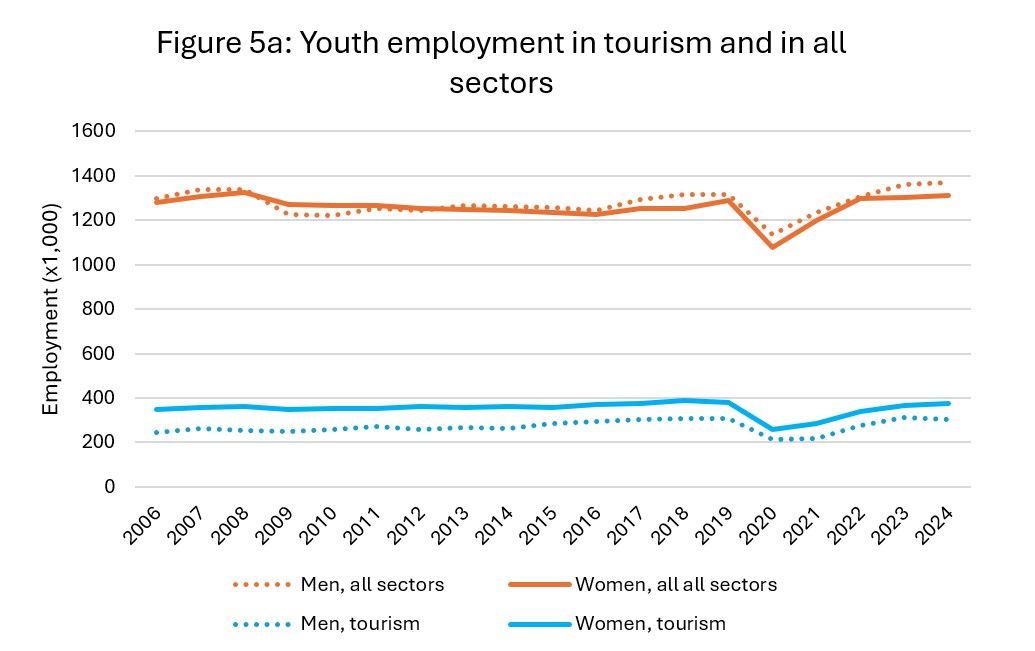
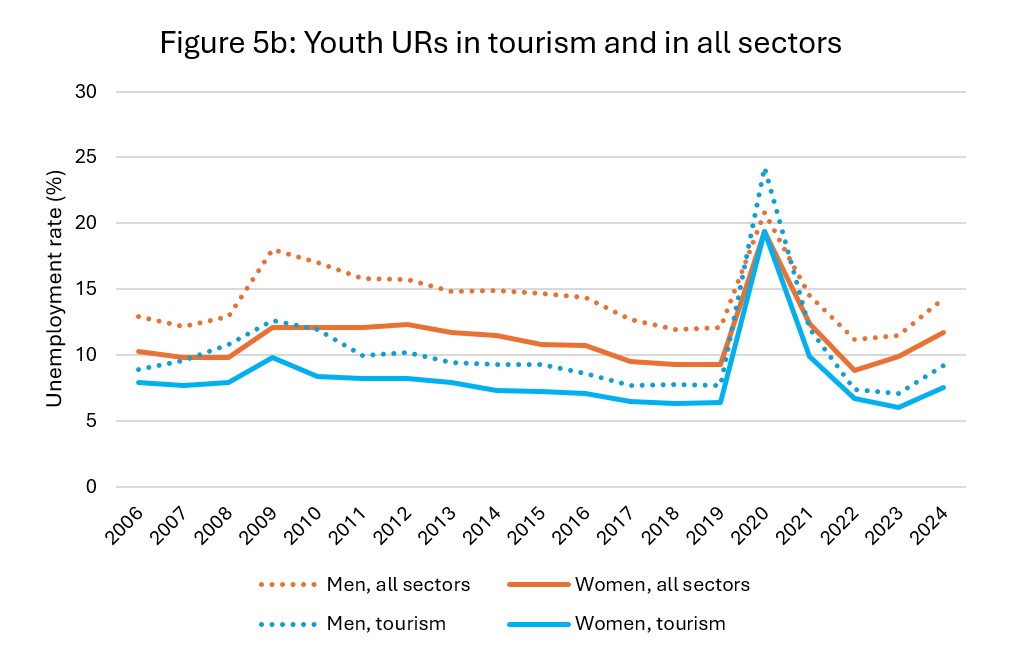
From 2006 to 2024, there were more women aged 15 to 24 working in tourism than men, while the gender split across all sectors was more balanced (see Figure 5a). Since 2006, an average of 21% of all young working men were employed in a tourism industry, while tourism employed an average of 28% of all young working women. From an unemployment perspective (Figure 5b), unemployment rates in tourism for young Canadians were lower than they were across the whole economy, and lower for women than for men, regardless of the sector.
Immigration Status of Young Workers
The tourism sector benefits enormously from young international workers. Many people who come to Canada with a working holiday visa pay their way in their chosen destinations through work in tourism, and a lot of international students find work in tourism businesses throughout their studies and during vacations. Tourism also offers a foothold in the labour market for newcomers to Canada, whether here on a temporary work permit or settling as a permanent resident. While these international youth by no means work exclusively in tourism, they nevertheless constitute an important part of the tourism workforce. Just as it is useful to compare how young workers are supported in tourism versus across all sectors, it is also useful to take a closer look at employment and unemployment rates across different immigration categories.
There are two immigration status categories explicitly coded in the LFS (people born in Canada, and landed immigrants), but there’s also a residual category (referred to here as “other”) arrived at by subtracting the first two categories from the age group total. This “other” category includes everyone who holds a temporary work permit, along with a few other categories. While it’s not possible to tease apart different categories of temporary workers (such as those on a Temporary Foreign Worker Permit, an international student visa, or any of the other short-term work permits available), this data point nevertheless provides a rough estimate of the role of temporary workers in Canada.
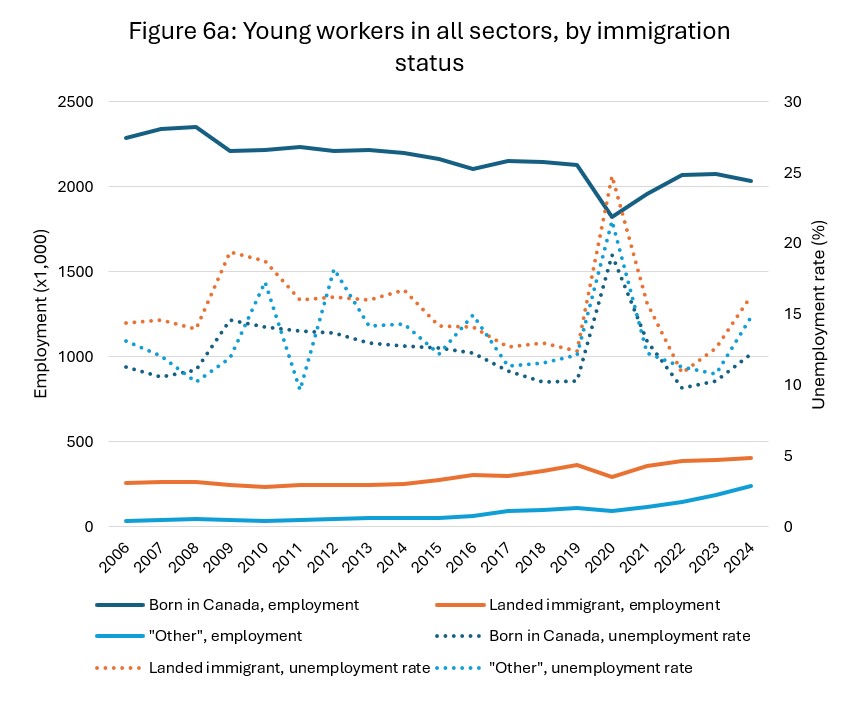
Figures 6a provides a snapshot of the young workforce (aged 15 to 24) across all sectors. By far the largest proportion of the workforce is those born in Canada (dark blue solid line, read against the left axis), and the “other” category represents the smallest share (light blue), although the raw counts for this category have been increasing over the past several years. It’s also interesting to note that younger workers born in Canada have been declining steadily over the time span of this analysis, seeing a loss of around 320,000 young people in employment from the peak in 2008 to 2024 (-13%). From an unemployment perspective (dotted lines, read against the right axis), those born in Canada tend to have lower unemployment rates than landed immigrants, by around 3 percentage points. Unemployment rates for the “other” category of workers are more variable, but that’s not too surprising given that totals of different types of work permit will fluctuate in response to various international factors, and not all work permits allow the same degree of unemployment (TFWP, for instance, is contingent on an employment contract, while the working holiday visa has no such restrictions).
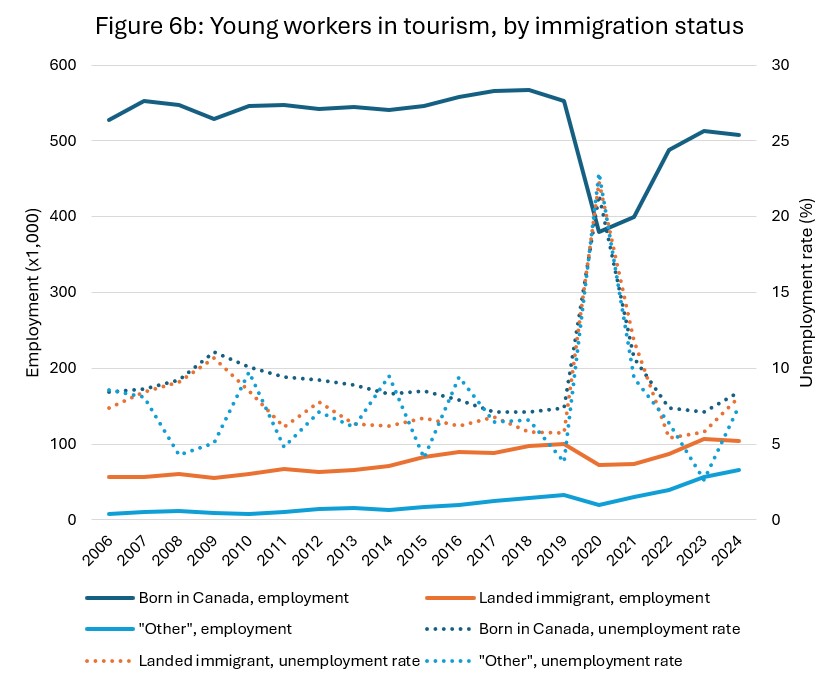
Figure 6b provides the same demographic breakdown of younger workers, but looking only at employment in the tourism sector. It’s important to note when comparing 6a and 6b that the employment axis is at a different scale (with tourism representing around one-quarter of all employment for this age group), while the unemployment rate axis is at the same scale.
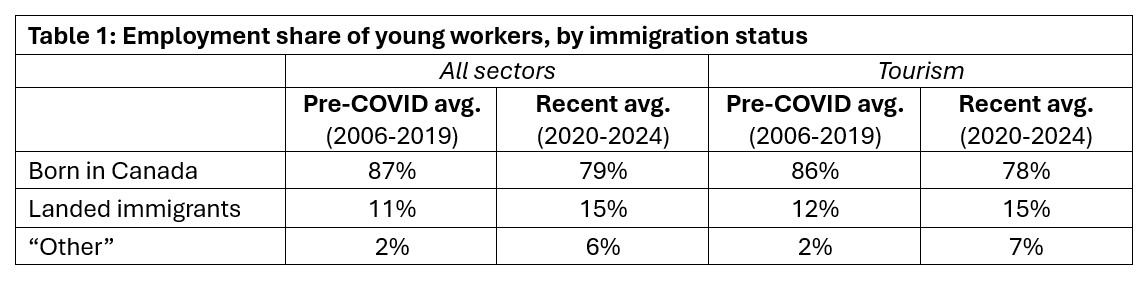
As with the overall economy, youth employment in tourism is dominated by those born in Canada, and indeed the relative shares of employment across these three groups is quite similar in tourism and the larger economy, with tourism employing only a slightly higher share of international workers and landed immigrants (see Table 1). Both the total economy and tourism saw a shift in the young workforce of around 8%, from those born in Canada to immigrants and temporary workers.
It’s interesting to note that raw tourism employment counts for youth born in Canada held relatively steady in tourism up until the pandemic, and in fact trended upwards slightly (the same period when it was slowly declining across the overall economy). Since the pandemic, the tourism employment count has remained below 2019 levels, while those of “other” workers has edged upwards. The number of young landed immigrants working in tourism increased incrementally from 2006 to 2019, and while it has returned to pre-pandemic levels, it has not returned to this growth trajectory, although there may be a time lag effect here—we may see this number continue to increase in the coming years. In terms of tourism unemployment, young landed immigrants had lower unemployment rates (except at the peak of the pandemic) than those born in Canada, while those of the “other” workers were about as variable as they were in the larger economy, for much the same reasons.
The Unemployment-Vacancy Gap
The media narrative, and a big part of the national conversation around labour, is focused on the high levels of unemployment and the large number of job vacancies. Why can’t all the unemployed people simply be hired into those vacancies? The fact is, it’s not that simple: the two main stumbling blocks are skills and mobility.
From a skills perspective, many of the jobs with vacancies are in supervisory or managerial positions, which can’t just be filled with any person plucked out of a crowd: it must be someone with the right levels of training, education, and experience to take on the responsibilities associated with the role in question. And that’s a tall order when it comes to young people, particularly those who came of age during the pandemic. Some youth will have been working from their teenaged years and may have the experience to step into those roles, but most are simply not ready for those jobs. And when young workers with the right experience are also students, they may not be able to take on a full-time job and the added responsibilities of being a supervisor. For many of these young people, mid-level vacancies are just not a viable option for starting out in the labour market.
The second sticking point is mobility: many unemployed people are not in the right places to take up the jobs that are standing vacant. Unemployment rates are widely reported nationally and provincially, but at these scales, the problem of geography is well-hidden. If there are lots of unemployed people in Ottawa, for example, and lots of jobs in Toronto, it’s a tall order to expect people to pack up and move to a new city. And young people may not be able to afford to move to a new city, or they may be students and tied to a particular college or university, particularly not for part-time or seasonal work. The problem isn’t restricted to young workers, either—someone who is settled, who has a family and a comfortable life, for instance, will be less likely to be able to relocate, particularly if their partner is also working or their children are in school. The issue of mobility touches on all aspects of a person’s life, from healthcare to childcare to affordable housing, and is a larger structural problem facing the sector, and the economy as a whole.
Tourism’s Value Proposition for Young Workers
Around 50% of Canadians have worked in tourism at some point in their lives, often when they were young: tourism offers good entry-level jobs for those who are new the world of work, and provides essential skills training that young workers will take with them throughout their careers. At a time when social employability skills—what we used to talk about as ‘soft skills’, such as communication, adaptability, and problem-solving—are going to be in increasing demand across the labour force, tourism’s role in training Canada’s future leaders has never been more important.
And as a sector, tourism does well by its young workers. Tourism employs one in four young workers in Canada, with businesses in almost every community. Tourism provides a particularly welcoming work environment for women and for migrants, whether permanent or temporary, and makes sure that everyone can get a foothold in the labour market. Youth unemployment rates are lower in tourism than the national average, and the flexibility possible in a sector that operates all day, every day—sometimes 24/7—means that young people can work when they need to.
To attract and retain more young people, businesses need to demonstrate how they can support their employees in having a work-life balance that they’re happy with, how they recognise and reward talent in their workforce, and how they align with the priorities and values of young Canadians. And that is a long-term project for our sector, but one that we need to commit to. Part of that project will lie in changing the narrative of tourism as an economic driver, and providing timely and accurate labour market intelligence is an important part of that work. Correcting misconceptions about tourism, particularly when it comes to young Canadians looking for work, is the first step.
For more on attraction and retention, explore the Compensation Culture infographics and worksheets or visit Discover Tourism’s Employer Compass.
[1] More information about the LFS methodology and data sources can be found here.
[2] More information on NAICS can be found here.
[3] When comparing tourism with the broader economy, it is important to note that the tourism figures are included in the economy-wide data.
[4] See, for example, this report from the Future Skills Centre on labour market scarring.